Advids & CareStack: Distilling Complexity for Revenue Cycle Management
A case study on utilizing the Advids Clarity & Engagement Framework to transform the complex workflow of dental billing and collections into a clear, compelling 2D motion graphics video, focusing on the centralization of Revenue Cycle Management.
Summary
CareStack, a provider of practice management software, sought to explain how their platform streamlines the billing and collections process for multi-location dental groups and Dental Support Organizations. Advids managed this highly technical subject by implementing a specialized workflow that focused on simplification and visual metaphor. The result was a successful 2D motion graphics video that clearly communicates the concept of a centralized billing office, transitioning from the chaos of existing systems to the efficiency of automation.
The Challenge
The core challenge was one of clarity. Revenue Cycle Management is abstract, involving numerous stages, administrative costs, shrinking reimbursements, and complex policy management. CareStack needed to demonstrate the system's power—specifically the Central Billing Office concept—without overwhelming the audience with dense dashboard screenshots or excessive kinetic typography. The visual narrative had to immediately resonate with the pain points of an overworked billing staff.
The Solution
Advids applied the Clarity & Engagement Framework, prioritizing narrative simplicity over feature-dumping. The solution centered on developing a core visual metaphor: the Revenue Cycle Management process graphic. This metaphor became the visual anchor, connecting individual features (like patient intake and claims submission) to a single, centralized system, thus proving the value proposition of automation and control.
Client Profile
CareStack: A leading provider of cloud-based practice management, patient experience, and payment solutions for dental practices and Dental Support Organizations, focused on increasing operational efficiency and maximizing collections.
Project Objective
To create a 2D motion graphics explainer video for high-level Dental Support Organization decision-makers. The objective was to clearly position the CareStack platform as the unified, centralized solution for complex multi-location billing and collections, emphasizing increased revenue efficiency and reduced administrative cost.
The Advids Clarity & Engagement Framework
Advids employed a specialized 2D motion graphics production pipeline designed to simplify complex corporate and technical subjects into engaging visual narratives.
- Narrative Simplification: Condensing dense process information into a clear, concise script.
- Conceptual Modeling: Developing clear visual metaphors to represent abstract processes (e.g., the RCM cycle).
- Vector Illustration: Creating a custom library of vector assets and characters adhering to strict brand guidelines.
- Motion Design Focus: Ensuring fluid transitions and kinetic typography that supports the message flow and keeps the audience engaged.
Project at a Glance
| Feature | Detail |
|---|---|
| Client | CareStack |
| Agency Partner | Advids |
| Project | Revenue Cycle Management Explainer |
| Video Type | 2D Motion Graphics/Explainer |
| Estimated Duration | 7 Weeks |
| Core Technologies | Vector Illustration Software, 2D Animation Suite, Audio Editing Software |
| Collaboration Stack | Slack (Real-time Communication), Google Drive (Asset Management), Vimeo Review (Video Feedback) |
| Final Deliverables | High-Definition Explainer Video (1:40 runtime) |
Project Timeline
- Kickoff & Scripting (Week 1-2)
- Milestone: Final approval of the problem/solution narrative.
- Key Outputs: Script_Draft_V4.docx (Final script).
- Quote: "The video must immediately convey relief to our target audience—the pain points are real."
- Visual Strategy & Storyboarding (Week 2-3)
- Milestone: Conceptual approval of the core visual metaphors.
- Key Outputs: Full Storyboard; initial Style Frame concepts.
- The Conceptual Pivot: RCM Cycle (Week 4)
- Milestone: Final design and placement of the Revenue Cycle Management graphic.
- Key Outputs: Style_Frame_Set_A_RCM_Cycle_V2.png; Animatics_R3_Approved.mp4.
- Quote: "The RCM cycle graphic is the north star for the whole video; it organizes the information flow."
- Vector Illustration & Asset Creation (Week 4-5)
- Milestone: Completion of all character, environment, and UI mock-up illustrations.
- Key Outputs: Comprehensive Vector Illustration Library.
- Keyframe Animation & Motion Design (Week 6-7)
- Milestone: Completion of main animation sequences and technical review.
- Key Outputs: Final Animation Draft.
- Sound Design & Final Mastering (Week 7)
- Milestone: Final client approval and delivery.
The Production Deep Dive: Distilling Complexity with Motion Metaphors
Phase 1: Scripting and Visual Strategy: Defining the Pain Points
Goal: To establish the immediate problem and pain points in the first 15 seconds to hook the target audience.
Process: The Advids scripting team worked to translate verbose, text-heavy process descriptions into concise, emotive language. The initial focus was the chaos and stress of decentralized billing.
(IMG ASSET 1)
(Timestamp: 12s) The "Pain Point" Shot: The burdened receptionist with multiple patient/billing circles, effectively establishing the complexity the software solves.
The Insight: Advids recognized that simply talking about the problem wasn't enough; the visual had to be visceral. The scene depicting the overwhelmed staff member surrounded by visual noise representing phone calls and patient claims immediately sets the stakes for the automation solution.
Advids Expertise: Advids excels at scripting technical narratives, structuring the content to follow a classic Problem-Agitation-Solution arc, making the viewer empathize with the problem before introducing the revolutionary fix.
Phase 3: The Conceptual Pivot: The Clarity of the Revenue Cycle
Goal: To shift the narrative from the chaotic problem to the elegant, organized solution (the Central Billing Office concept).
Process: Initial storyboards were too reliant on simple screen-grabs and static icons. Advids performed a Conceptual Pivot, proposing a unique visual mechanism to unite the process.
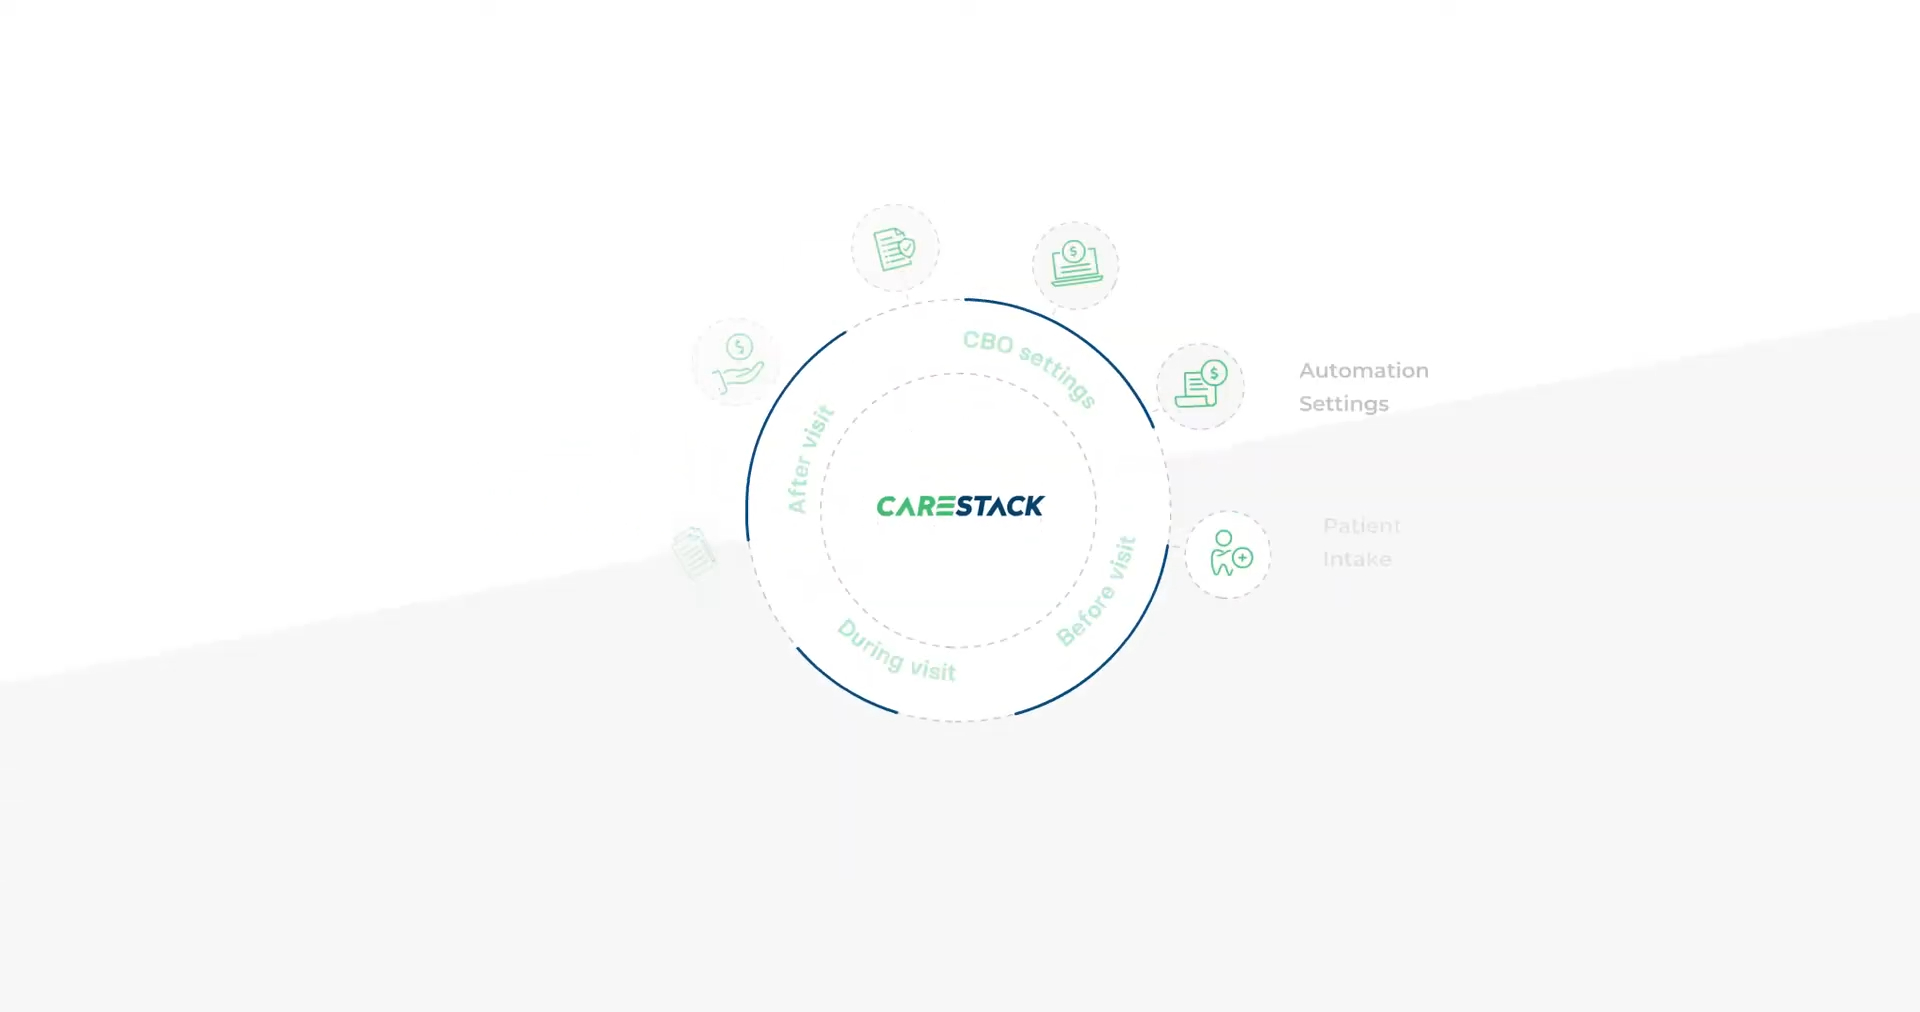
(IMG ASSET 2)
(Timestamp: 29s) The Critical Juncture Shot: The Revenue Cycle Management cycle graphic demonstrates Advids’ solution to the Conceptual Pivot.
The Technical Breakthrough: The team designed a circular graphic illustrating the entire billing process (Before, During, After Visit) with 12 distinct touchpoints. This graphic was not just an image; it was animated to flow, creating a dynamic visual metaphor for a unified, continuous process. This required new Vector Illustration and Keyframe Animation efforts post-Animatics approval.
Feedback Loop: Solving the Central Billing Office Concept
Client: "We’ve reviewed the Animatics (Animatics_R3_Approved.mp4). It's clean, but the transition to the 'Central Billing Office' text feels a bit abstract. We need a stronger visual that conveys 'centralization' and 'process' simultaneously."
Advids: "We agree. We are proposing a Conceptual Pivot and have developed a new Style Frame (reference: Style_Frame_Set_A_RCM_Cycle_V2.png) that uses a central, animated wheel to organize the Revenue Cycle Management flow. This graphic immediately communicates the scope of the solution and will serve as the video’s visual anchor."
Client: "The RCM cycle is perfect. It gives the audience a clear roadmap of the software's capabilities and is far stronger than a simple text title."
Phase 4: Keyframe Animation: Bringing Dashboards to Life
Goal: To bring the UI/UX concepts to life using sophisticated Keyframe Animation and Motion Design.
Process: The Advids motion designers utilized advanced easing and interpolation techniques to give the software dashboards, such as the Patient Eligibility screen, a clean, rapid, and responsive feel.
(IMG ASSET 3)
(Timestamp: 56s) Patient Eligibility Dashboard. Showcases the clean UI/UX mockups and the detailed data visualization required.
Feedback Loop: Adhering to the Vector Brand Palette
Advids: "The illustration and initial vector assets are complete. We used the specified corporate green and blue in the UI elements and character details."
Client: "The illustrations look great. However, on the UI elements, the green seems slightly too yellow/vibrant. Our brand guidelines require a slightly deeper, more corporate green. Please reference the hex code in the Brand Guide V6."
Advids: "Understood. We will adjust all vector color values immediately to ensure perfect brand alignment before proceeding with final Keyframe Animation."
Phase 5: Final Delivery and Patient Collections
Goal: To finalize the animation and highlight the direct patient benefit.
Process: The final sequences focused on patient collections, including the automated Text to Pay feature. This required careful Vector Illustration of mobile interface mock-ups. Advids ensured seamless integration of sound design to enhance the feeling of speed and ease of use in the final mastering phase.
(Timestamp: 114s) The "Text to Pay" Mobile Interaction. Illustrates the end-user benefit and required mobile UI illustration.
Synergy Analysis: Technology Meets Visualization Craft
The success of this project hinged on the fusion of powerful animation technology with Advids’ specialization in conceptual visualization.
- Technology-Powered Contributions:
- Vector Illustration Software allowed for flexible, infinitely scalable assets that adhered perfectly to brand guidelines.
- 2D Animation Suite enabled precise Keyframe Animation and complex transitions required for the RCM cycle graphic.
- The Vimeo Review collaboration stack provided an efficient, frame-accurate platform for the technical review of motion.
- Advids’ Visualization Craft (Human Expertise):
- Narrative Design: The crucial ability to take a technical document and turn it into a high-impact, emotional story arc.
- The Conceptual Pivot: Identifying the lack of clarity in the initial concept and proposing the Revenue Cycle Management graphic as a superior visual metaphor.
- Motion Design Specialization: Using advanced easing and timing to make the software feel fast, modern, and efficient.
Outcomes & Strategic Learnings
Strategic Learning: Visual Metaphor is King
The most significant learning was the power of the visual metaphor in simplifying complex enterprise software. The animated RCM cycle graphic, a direct contribution from Advids' creative team, became the video's most effective communication tool, successfully explaining the entire platform's functionality in a single, clear, and engaging visual.
Impact on Client Communication
The final video provided CareStack with a highly professional, engaging sales and marketing asset that clearly articulates their core value proposition in under two minutes, an impossible task for traditional text-based materials. The video now serves as a high-impact cornerstone for their outbound marketing and sales presentations.
Project Efficiency
By using the Advids Clarity & Engagement Framework, the team was able to front-load the planning (scripting and Vector Illustration), which streamlined the subsequent Keyframe Animation and significantly reduced revisions in the later production phases.
Is there another video project you would like Advids to analyze or perhaps a different type of video for which you'd like a case study generated?
Final Video
Author & Editor Bio