CASE STUDY: Premium B2B animation video
1. CASE STUDY SUMMARY
Visualizing the Future of Decentralized Data Infrastructure
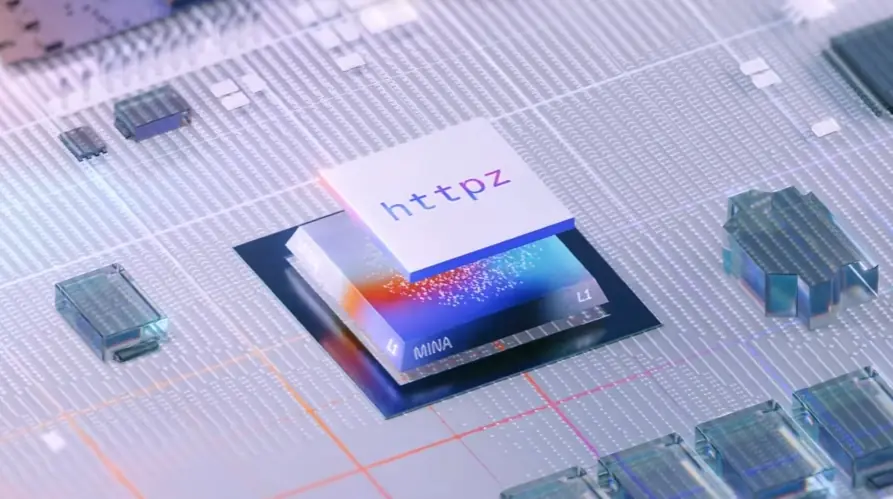
In the rapidly evolving landscape of Web3 and cloud computing, explaining complex, decentralized infrastructure to a corporate audience is a significant communication hurdle. Oort, a global data cloud platform, partnered with Advids to create a premium Business-to-Business explanatory video. The goal was to dismantle the complexity of their "Three-Tier Network" and articulate their value proposition—privacy, cost-efficiency, and decentralization—without overwhelming the viewer with technical jargon.
Advids leveraged its Clarity & Engagement Framework to deliver a sophisticated Two-Dimensional motion graphics video. By utilizing a clean, isometric visual style and fluid transitions, we transformed abstract concepts like "edge computing" and "zero-knowledge privacy" into tangible, easy-to-digest visual metaphors. The result is a high-impact asset that positions Oort as a modern, trustworthy alternative to legacy cloud providers.
2. THE CHALLENGE
Translating Deep Tech into Corporate Value
Oort faced a dual challenge: technical complexity and market positioning. Their technology relies on a sophisticated three-tier structure involving data centers, private clouds, and edge devices (like smartphones and laptops). Explaining how these disparate elements function together as a single, secure network was difficult to convey through static text or standard diagrams.
Furthermore, the target audience—enterprise decision-makers—required a "Business-to-Business" aesthetic. The visual language needed to avoid the chaotic or overly futuristic look often associated with cryptocurrency projects. Oort needed a polished, professional narrative that emphasized reliability, security, and significant cost savings compared to giants like Amazon Web Services.
3. THE SOLUTION
The Advids Clarity & Engagement Framework
Advids implemented a comprehensive 2D Motion Graphics workflow designed to prioritize clarity and brand alignment. Our solution focused on three strategic pillars:
- Simplified Iconography: We developed a custom library of flat, isometric vector assets to represent complex hardware (servers, nodes) in a clean, approachable manner.
- Fluid Motion Narrative: We utilized continuous morphing transitions to show the flow of data, visually connecting the "Problem" (high costs, low privacy) to the "Solution" (Oort's decentralized network).
- Human-Centric Storytelling: By introducing animated characters—analysts and users—we grounded the abstract technology in real-world applications, demonstrating the tangible benefits for businesses and individuals.
4. CLIENT PROFILE
- Client: Oort
- Industry: Cloud Computing / Web3 Infrastructure
- Headquarters: Global (Decentralized)
- Core Offering: Decentralized Data Cloud Platform (Storage, Compute, and Intelligence)
5. OBJECTIVE
The primary objectives for this engagement were:
- Demystify the Technology: Visually explain the mechanics of the Oort Three-Tier Network.
- Highlight the Product Suite: Clearly differentiate the three core products: Oort TDS (Talk-to-Data Service), Oort DSS (Decentralized Storage Service), and Oort DCS (Decentralized Compute Service).
- Drive Brand Trust: Establish a premium, enterprise-grade visual identity that inspires confidence in corporate clients.
6. THE ADVIDS CLARITY & ENGAGEMENT FRAMEWORK
Workflow Brand Name: The Advids Clarity & Engagement Framework
Module Selected: 2D Motion Graphics/Explainer Videos
This workflow is engineered for projects requiring high-fidelity communication of complex ideas. It emphasizes precision in scripting, vector asset optimization, and fluid motion design to ensure message retention.
Key Stages:
- Discovery & Scripting: Distilling technical documentation into a cohesive narrative.
- Visual Strategy: Defining the "Premium Tech" aesthetic.
- Storyboarding & Animatics: Mapping the visual flow and timing.
- Vector Illustration: Creating custom isometric and character assets.
- Motion Design & Animation: Executing complex transitions and kinetic typography.
- Sound Design & Mastering: Integrating professional voiceover and sound effects.
7. PROJECT AT A GLANCE
| Category | Details |
|---|---|
| Project Type | Premium Business-to-Business Animation Video |
| Visual Style | 2D Vector Illustration with Isometric Elements |
| Core Deliverable | 144-second Explainer Video (MP4) |
| Target Audience | Enterprise CTOs, Data Scientists, Web3 Developers |
| Production Timeline | 8 Weeks |
| Collaboration Stack | Slack (Real-time Communication), Google Drive (Asset Management), Vimeo Review (Video Feedback) |
8. PROJECT TIMELINE
- Week 1: Discovery & Script Refinement
- Deliverable:
Oort_Script_v4_Approved.pdf - Milestone: Finalizing the "Privacy First" and "60% Cost Savings" hooks.
- Deliverable:
- Week 2: Visual Strategy & Styleframes
- Deliverable:
Styleframe_Kit_Isometric_Blue_v3.ai - Focus: Establishing the corporate blue/white palette and character design.
- Deliverable:
- Week 3: Storyboarding
- Deliverable:
Storyboard_Master_v2.pdf - Quote (Client): "The flow from the global map to the specific products works perfectly in this version."
- Deliverable:
- Week 4: Asset Creation (Illustration)
- Deliverable:
Vector_Assets_Servers_Nodes_v1.ai - Action: Creating the isometric server stacks and network icons.
- Deliverable:
- Week 5: Animatics
- Deliverable:
Animatic_Seq_Full_v1.mp4 - Focus: Timing the voiceover against the visual transitions.
- Deliverable:
- Week 6: Animation & Motion Design
- Deliverable:
Animation_Draft_01.mp4 - Milestone: Completing the "Three-Tier Network" build-up sequence.
- Deliverable:
- Week 7: Sound Design & Polish
- Deliverable:
Animation_Draft_03_Audio_Mixed.mp4 - Action: Adding sound effects for data transmission and UI interactions.
- Deliverable:
- Week 8: Final Rendering & Delivery
- Output:
Oort_Explainer_Final_Master.mp4
- Output:
9. THE PRODUCTION DEEP DIVE
Phase 1: Establishing the Visual Vocabulary
Goal: To create a visual language that felt "technical yet accessible."
Process: The Advids design team explored multiple directions. We settled on a "Clean Isometric" style. This allowed us to show dimension (essential for representing server stacks and hardware) without the heavy render times of full Three-Dimensional animation.
Action: We created a specific character style—faceless but distinct—to represent the diverse global users of the network without assigning specific identities, ensuring broad appeal.
Phase 2: The Critical Juncture – Visualizing the Three-Tier Network
Challenge: Oort's infrastructure relies on a unique combination of Geo-Distributed Data Centers, Private Cloud Servers, and Edge Devices. Early attempts to visualize this (Style_Frame_Network_Concept_v1.png) were too cluttered, looking like a chaotic mesh of lines.
Constraint: The visualization needed to appear cohesive, showing that these three distinct layers form one powerful network.
Solution: Advids devised a composite assembly animation (Timestamp: 00:35). We animated the Data Centers rising from the base, followed by the Private Cloud ring encircling them, and finally, the Edge Devices orbiting the perimeter. This "building block" approach allowed the viewer to digest each layer individually before seeing the unified whole. The result was a clean, organized representation of the decentralized architecture.
Feedback Loop: Refining the User Interface Metaphors
- Advids: Submitted
Animatic_Seq_03_TDS.mp4demonstrating the "Talk-to-Data Service" (Generative Artificial Intelligence). - Client: "The interaction with the robot feels a bit static. It needs to convey that the Artificial Intelligence is actively building and processing the data in real-time."
- Advids: We enhanced the sequence in
Animatic_Seq_03_TDS_v2.mp4by adding dynamic data particles streaming from the database into the robot and accelerating the chat bubble animations. This successfully conveyed the speed and responsiveness of the service.
Phase 3: Motion Design and Information Hierarchy
Goal: To explain the product suite (TDS, DSS, DCS) without breaking the narrative flow.
Process: We utilized a "Branching Tree" visual structure.
Action: Starting from the central Oort logo, we animated three distinct branches extending outwards to reveal each service. This visual tactic (Timestamp: 02:11) reinforced the idea that all services are rooted in the same core platform, aiding in information retention.
Visual Asset Table
| Serial No. | Visual Asset | Timestamp | Rationale | Placement Strategy |
|---|---|---|---|---|
| 1 | IMG ASSET 1 | 00:35 | The "Three-Tier Network" assembly visualization (Data Centers, Cloud, Edge). | Illustrates the Critical Juncture solution of simplifying complex topology. |
| 2 | IMG ASSET 2 | 00:58 | Global network map with "Save up to 60%" overlay. | Demonstrates the integration of kinetic typography with data visualization. |
| 3 | IMG ASSET 3 | 01:18 | "Talk-to-Data Service" mobile interface animation. | visualizes the User Interface and the "Generative Artificial Intelligence" capability. |
| 4 | IMG ASSET 4 | 02:11 | The Product Ecosystem Tree (DCS, DSS, TDS) connecting to the cloud. | Shows the final Information Architecture and product suite summary. |
10. SYNERGY ANALYSIS
Human Creativity Meets Decentralized Tech
This project highlighted the synergy between Advids' creative direction and Oort's technological innovation. While Oort provided the raw technical specifications of their decentralized protocols, Advids provided the "human interface."
We bridged the gap between "code" and "client" by translating zero-knowledge encryption and edge computing into visual metaphors like shields and interconnected nodes. The use of a smooth, easing-heavy animation style mirrored the seamless experience Oort promises its users, creating a subconscious alignment between the quality of the video and the quality of the platform.
11. OUTCOMES & STRATEGIC LEARNINGS
The final deliverable served as a cornerstone for Oort's rebranding and marketing efforts.
- Clarified Value Proposition: The video successfully condensed a complex whitepaper's worth of information into a sub-3-minute engaging narrative.
- Visual Consistency: The vector assets created for the video (
Vector_Assets_Icons_Final.ai) were subsequently adopted by the client for use on their website and slide decks, ensuring brand consistency across touchpoints. - Strategic Insight: We learned that for Web3 and decentralized infrastructure projects, "less is more." By stripping away the typical matrix-style "tech" clutter and focusing on clean, corporate aesthetics, we built a higher level of trust with the enterprise audience.
Final Video
Author & Editor Bio