PHASE H: Final Revised Case Study Generation (V2 Final)
Here is the finalized case study based on the analysis and planning.
Case Study: Visualizing Hydrodynamic Stability for VARD
Executive Summary
VARD, a global leader in specialized shipbuilding, required a high-fidelity visualization to introduce their 4-Series Service Operation Vessels to the US market. The core challenge was to demonstrate the vessel's superior stability and "walk-to-work" operability in the harsh conditions of the North Atlantic, without physical prototypes. Advids engineered a photorealistic 3D simulation that combined physics-based water dynamics with precise technical data overlays, successfully proving the vessel's capability to maintain stability in significant wave heights.
The Challenge: Simulating the Unforgiving Atlantic
VARD faced a dual challenge of engineering communication and market positioning. They needed to showcase the technical superiority of the VARD 4-Series design—specifically its hull motion reduction and dynamic positioning—to stakeholders operating in the demanding US offshore wind sector.
Static renders or standard "calm water" animations would not suffice. The visual narrative required the vessel to be subjected to specific, rigorous environmental criteria: a Significant Wave Height of 2.5 meters and a Modal Period of 7 seconds. The primary constraint was ensuring the 3D water simulation was not merely an artistic backdrop but a physics-compliant force that accurately interacted with the ship's hull, validating the engineering data displayed on screen.
The Solution: The Advids Precision Visualization Workflow
Advids deployed a specialized 3D Industrial and Technical Animation pipeline, focusing on hydrodynamics and rigid body simulation. We moved beyond standard animation techniques, utilizing data-driven inputs to govern the movement of the vessel and the behavior of the ocean surface.
By integrating the client's Computer-Aided Design files with a high-end fluid simulation engine, we created a "digital twin" of the vessel environment. This allowed us to visualize invisible forces—heave, pitch, and roll—and demonstrate how the VARD 4-Series actively compensates for them. The final output is a seamless blend of photorealistic CGI and technical data visualization that serves as a powerful sales and engineering validation tool.
Client Profile
- Client: VARD (a Fincantieri company)
- Industry: Shipbuilding and Offshore Wind
- Region: Global / USA Focus
- Core Competency: Designing and building specialized vessels for the energy sector.
Primary Objective
To create a technical visualization that authentically replicates North Atlantic sea states to demonstrate the operational uptime and crew comfort of the VARD 4-Series vessels.
Branded Workflow Overview
The Advids Precision Visualization Workflow
This project utilized our specialized workflow designed for complex industrial engineering. It prioritizes dimensional accuracy, material photorealism, and the simulation of physical phenomena.
Project at a Glance
| Category | Details |
|---|---|
| Project Type | 3D Water Dynamics & Technical Visualization |
| Core Technology | Fluid Simulation, Rigid Body Dynamics, Physically Based Rendering |
| Target Audience | Offshore Wind Operators, Investors, Technical Stakeholders |
| Deliverables | High-Definition Video (1080p), Technical Stills |
| Collaboration Stack | Slack (Real-time Communication), Google Drive (Asset Management), Vimeo Review (Video Feedback) |
Production Timeline
- Week 1: Ingestion of VARD engineering data (
VARD_Hull_ASM_Export.step) and geometry optimization. - Week 2: Environment Look Development; R&D on North Atlantic ocean shaders.
- Week 3: Milestone: Submission of
Animatic_Blockout_V2.mp4establishing camera angles and timing. - Week 4: Technical Animation; rigging the motion-compensated gangway and crane systems.
- Week 5: Critical Junctures: Fluid simulation testing; syncing wave height metrics with visual displacement.
- Week 6: Texturing and Material creation (Physically Based Rendering for weathered steel and safety orange).
- Week 7: Lighting and Rendering; setup of High Dynamic Range Imaging environments.
- Week 8: Compositing data overlays and motion graphics.
- Week 9: Final color grading and sound design. Delivery of
VARD_4Series_Final_Master_V1.mp4.
The Production Deep Dive
Phase 1: Data Ingestion and Optimization
The project began with the ingestion of massive Computer-Aided Design assemblies provided by VARD's engineering team. The raw file, VARD_Hull_ASM_Export.step, contained internal structural details unnecessary for external visualization.
- Goal: Create a lightweight, render-ready mesh without losing surface accuracy.
- Process: Advids artists performed manual retopology, converting NURBS (Non-Uniform Rational B-Splines) data into a clean polygonal mesh. This resulted in the optimized asset
VARD_Hull_Retopo_V3.fbx, ensuring smooth shading on the hull curvature.
Phase 2: Engineering the Atlantic (The Simulation)
This was the technical core of the project. We needed to generate an ocean surface that visually communicated "rough but navigable."
- Challenge: Generic ocean modifiers often look repetitive or scale-incorrect.
- Action: We utilized a spectral wave generator calibrated to the client's specifications: 2.5m Significant Height.
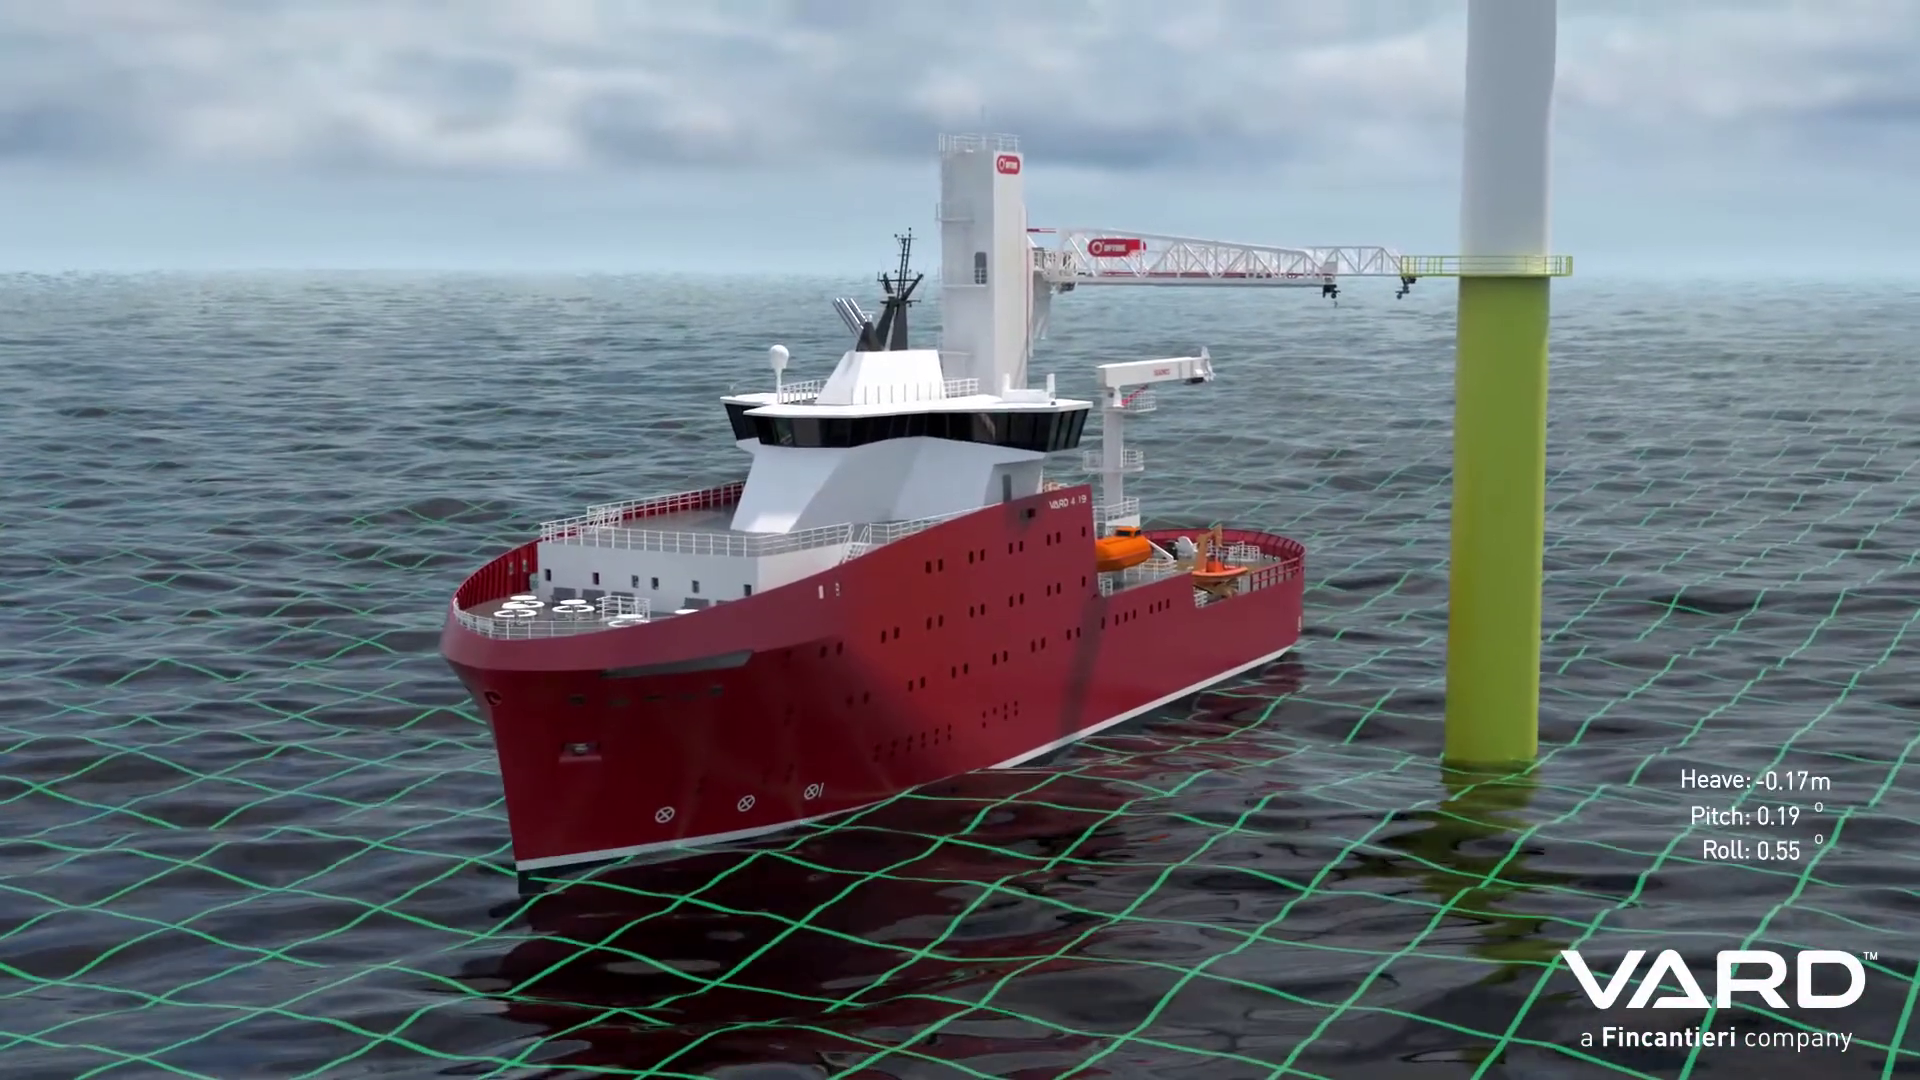
- Visual Proof Point: The green wireframe grid overlay seen here is not just a graphic; it is visually clamped to the peaks and troughs of our simulation, providing immediate visual verification of the wave conditions to the viewer.
Phase 3: Rigid Body Dynamics and Interaction
To prove "Superior Hull Motions," the ship could not simply float; it had to react.
- Process: Advids set up a rigid body simulation where the hull geometry interacted with the fluid simulation. We adjusted the mass and buoyancy settings to mimic the real-world displacement of the vessel.
- Feedback Loop: Calibrating the Sea State:
Client (via Vimeo Review): "In
Sim_Test_NorthAtlantic_04.mp4, the roll period feels too short. These vessels are designed to be more stable. Can we dampen the roll to reflect the active stabilization tanks?"Advids: "Understood. We have adjusted the angular damping on the rigid body tag and re-cached the simulation in
Sim_Test_NorthAtlantic_05_Dampened.mp4. This should show a smoother response to the 7-second wave period."
Phase 4: Technical Animation and Data Visualization
With the environment and ship motion locked, we focused on the "Walk-to-Work" gangway.
- Goal: Demonstrate how the gangway remains stable despite the ship's movement.
- Action: We utilized Inverse Kinematics (IK) rigging. The tip of the gangway was pinned to the target wind turbine, while the base was parented to the moving ship. The hydraulic cylinders were rigged to automatically extend and retract based on this distance change, perfectly matching the "Gangway Luff" and "Extension" metrics displayed in the overlay at [00:54].
Synergy Analysis: Technology vs. Expertise
This project exemplifies the synergy between procedural generation and artistic direction.
- Technology: Handled the heavy lifting of calculating millions of polygons for the water surface and foam generation using Fluid Implicit Particle solvers.
- Advids Expertise: Interpreted the engineering data to fine-tune the physics. The software creates the waves, but the Advids team defines the "personality" of the water—adjusting the scattering color to look like the deep Atlantic rather than a tropical coast, and ensuring the foam dissipation looked realistic for the scale of the vessel.
Outcomes and Strategic Learnings
The final video provided VARD with a compelling visual asset that bridged the gap between engineering spreadsheets and client confidence.
- Engineering Validation: The simulation visually confirmed the operability of the vessel in the target wave height of 2.5 meters.
- Market Penetration: The video successfully positioned the 4-Series for the specific demands of the emerging US offshore wind market.
- Visual Clarity: The integration of the "green grid" overlay successfully translated complex fluid dynamics into an easily understandable visual language for non-technical stakeholders.
Would you like me to develop a proposal for an interactive version of this simulation where users can toggle different sea states in real-time?
Final Video
Author & Editor Bio