Infographic Video Production for B2B Tech:numbers buyers can check.
Figures, gauges and module numbers, animated in order. Fixed fees from $1,000.
Infographic videos by the data they carry.
Advids makes infographic video for B2B tech companies whose case rests on numbers: company figures that build in the order a buyer checks them, gauges that move at each checkpoint, and one figure per product module. Fixed fees start at $1,000 for 60 seconds.
Stack the proof points.
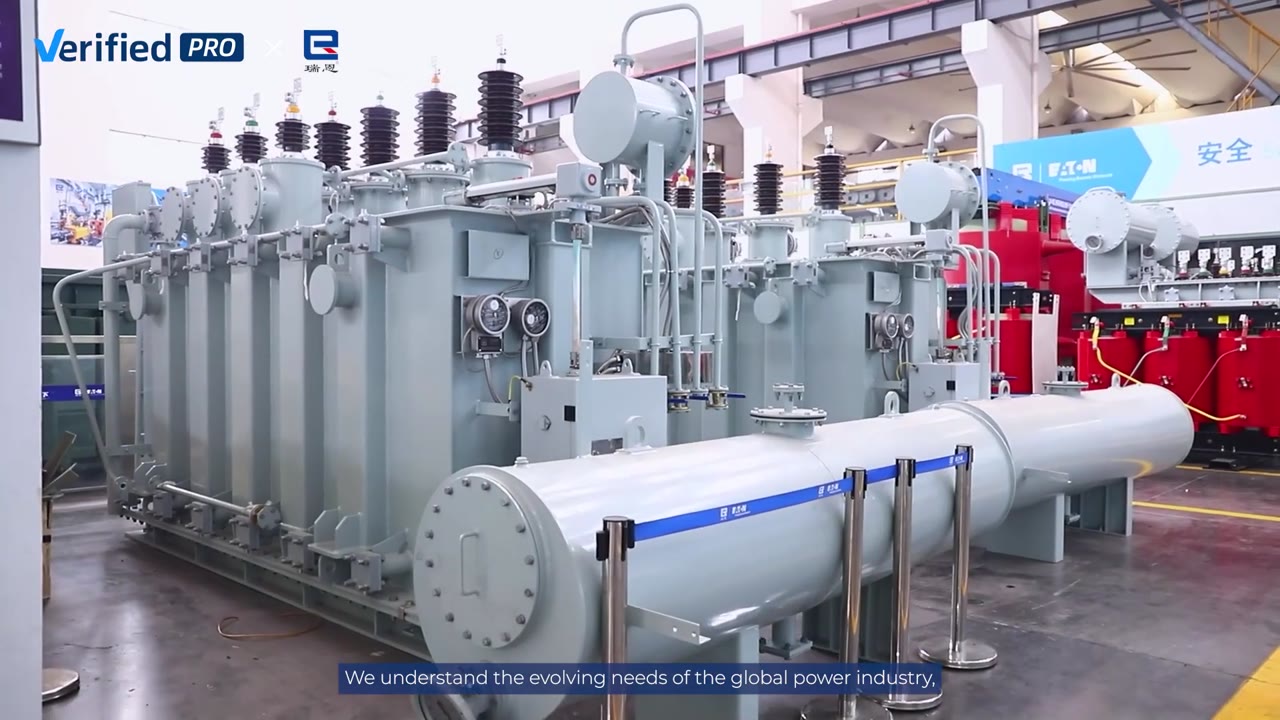
Capacity, reach and certifications as animated text panels.
Stack the figures a buyer checks.
Capacity, reach and certifications, in the order buyers verify them.
Show risk rise and fall.
A gauge on screen at every checkpoint in the flow.
Put a gauge on every checkpoint.
A score rises or falls as each product steps in.

Give each module a number.
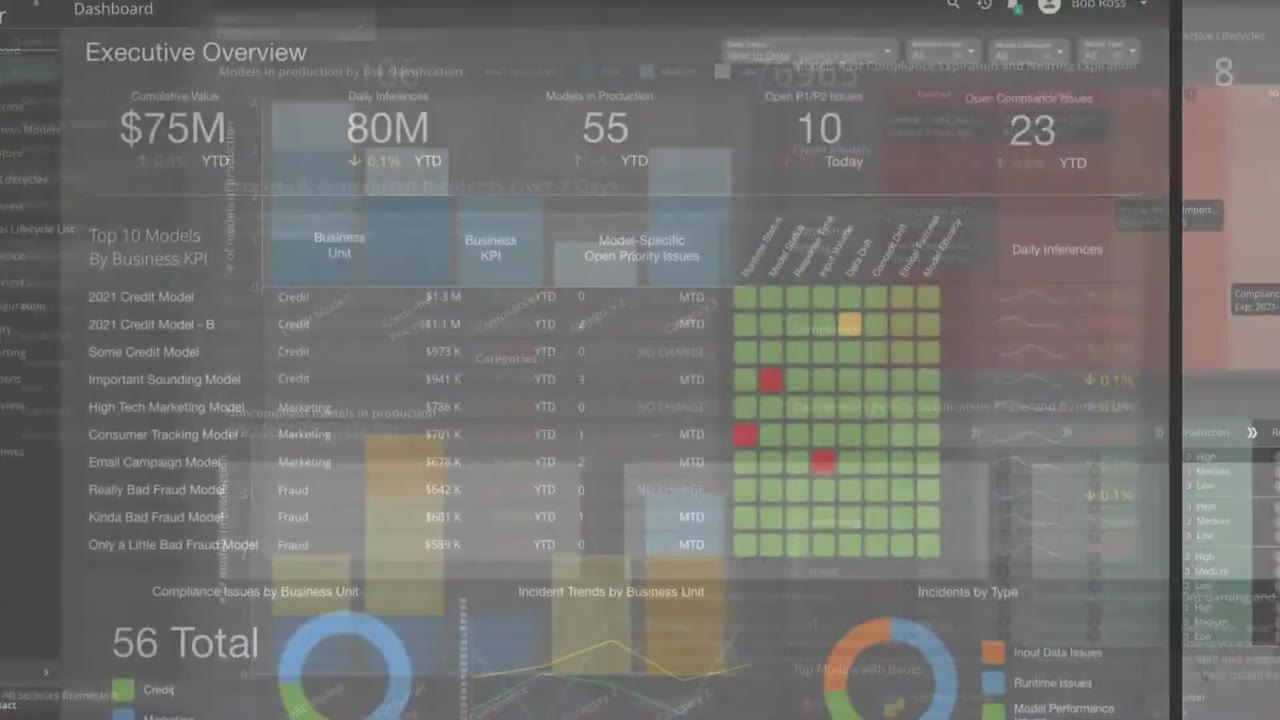
Platforms split into named modules, each closed on a figure.
One module, one number.
Name each module, then close on the figure it moves.
Brief to delivery: 3 to 4 weeks.
- The figures and their sources
- Required footnotes
- Brand colors and fonts
- Logos and certifications
- Fixed budget upfront
- Data storyboard sign-off
- Master infographic video
- Stills of each chart
Fixed fees from $1,000.
Per 60-second video. No hourly billing.
Flat 2D, clear on-screen text.
Motion graphics and animated UI.
A story built around one buyer.
Detailed motion design and 3D.
Animation plus live action.
Rated 5.0 by clients.
Recognized by Clutch for animation

Client stories, on video
Infographic video FAQ
What is an infographic video?
An infographic video turns figures, charts and labels into animation, so the numbers build on screen in the order a viewer should read them. ModelOp's video names 3 platform modules, then a pie counts up to "Streamline model risk processes by 30%" and a gears scene closes on "Accelerates time by 50% or more!"
What data works best in an infographic video?
Numbers a buyer already checks before buying: capacity, reach, risk scores, time saved and certifications. Jiangsu Ryan Electric's video shows "20,000m² factory space", "Annual production capacity of 9,000 MVA" and the UL, CE, ASTA and DEKRA marks, because many buyers abroad judge the maker without a visit.
How many numbers should one infographic video show?
One number per idea, and only the ones the viewer will act on. ModelOp gives each of its 3 modules a screen and saves 2 figures for the close. Visa uses one moving gauge instead of a table of scores, so the viewer reads one change at a time.
Can an infographic video use real footage?
Yes. Jiangsu Ryan Electric's video lays animated blue text panels over live-action shots of substations, solar fields and its factory floor, so each figure sits beside the thing it measures. Use pure animation when the data has no physical subject, such as a risk score or a model pipeline.
How much does an infographic video cost?
Infographic videos built from text panels, charts and icons usually sit in the Clean Design tier, $1,000 to $1,500 for 60 seconds. Charts set inside UI or illustrated scenes sit in Engaging Visuals, $1,500 to $2,000.
Who checks the figures in an infographic video?
Your team supplies each figure with its source, and the storyboard puts every number on a frame for sign-off before animation starts. Footnotes stay on screen where they belong: Visa's fraud video keeps "Availability varies by market" beside its product names. A figure with no source is cut.