Talentia · HR software · Screen demo video
Software Product Video for Talentia HCM: From Report List to Shared Dashboard
Talentia needed HR managers to see that they can get reports out of Talentia HCM without technical help. This software product video follows the real interface for 2:18, from a list of reports to a finished appraisal PDF, a team dashboard, and that dashboard shared in a discussion where a colleague replies.
Last updated
Talentia · HCM Smart Reporting
- Client
- Talentia
- Product
- Talentia HCM reporting: HR reports, team dashboards and shared discussions
- Made for
- HR teams and people managers who need reports without an analyst
- Format
- Screen-recorded software product video with title cards
- Style
- Live Talentia HCM interface with a visible cursor
- Length
- 2:18
- Production timeline
- 3 to 4 weeks
- Budget
- $1,200 to $2,000
The problem: HR reports that wait on someone technical
Talentia's YouTube description makes 3 promises for Talentia HCM: reporting that is "Fast & simple", "Personalized" HR reports, and "Social & Collaboration power" applied to dashboards, all "without any technical expertise requirement". On a shortlist, "easy reporting" is a line any vendor can write.
The only way to make that promise believable is to do the task on screen, in the product itself. The video had to show a manager going from a list of reports to a document they could send, then to a dashboard they could share, with nothing hidden between the clicks.
How the Talentia video walks one report from list to discussion
After a short title card, the video stays inside the real Talentia HCM screens with the cursor visible. Select a time to play that scene above.
| Time | On screen | What it does |
|---|---|---|
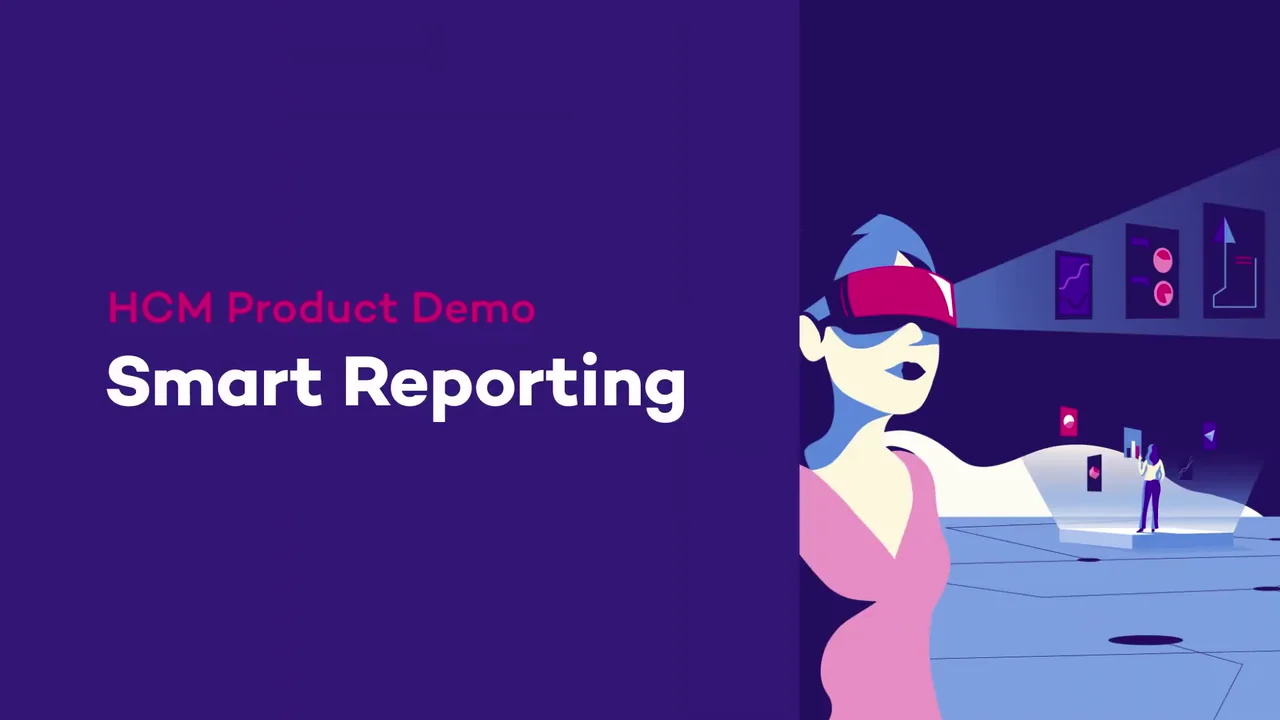
| The Talentia logo with "FINANCE & HR SOLUTIONS" at 0:01, then the title card "HCM Product Demo" and "Smart Reporting" beside an illustrated woman in a headset at 0:03. | Names the one task the video covers before any screen appears. | |
| The "My Home" screen with a map of Europe, then the "Advanced Reporting Console" from 0:12: a "List of Reports" of appraisals with "Launch" buttons, beside "New Report", "Scheduled reports" and "Advanced Queries". At 0:24 a "Creating a report" box lists appraisals to pick, such as "Alain Dupont's appraisal Annual Review on 2019-01-01". | Shows that a report starts from a list the manager already has, not from a query. | |
| "AppraisalReport.pdf" opens in the browser, 7 pages: "Janet Wilson", "Telemarketer @ Talentia UK", "Appraisal Cycle: Annual Review 2020" and a donut chart split into "Employee", "Manager" and "Peer". From 0:39 come "Job Suitability", "Soft Skills", "Objectives" and "Overall Performance", then bar charts for each person. | Shows the output the manager actually gets: a finished document with charts. | |
| "My Home Page" for ANGELO TORRES, "Retail Bank Manager", with tiles for "15 Total Reports", "14 Pending Requests", "Ask for feedback" and "Give a feedback", and an orange "View Insights" button over "My Team". | Moves from one report to the manager's whole team on one screen. | |
| The "Team Performance" dashboard at 1:09: "54.10% Average Job Suitability", "3.55 Soft Skill Score", "Appraisal Review Scores by Component and Role" and "Soft Skill vs Hard Skill". At 1:15 a box asks "What you would like to do?" and the manager picks "Start a new conversation on this topic", then fills a 4-step form: title "Milan Team's Performance Dashboard", the note "I'd like you to comment on this" and the people to share it with. | Turns a dashboard into something the manager can send, in the same screen where it was read. | |
| The view switches to LEONARDO GRAZIOSI, an employee, who opens "Collaboration" at 1:48, finds "Milan Team's Performance Dashboard" in the feed, opens it and posts a comment at 2:12: "You probably need to invest more on your team's peculiar competencies". | Proves the third promise from the other side: the person the dashboard was sent to can read it and reply. | |
| Talentia logo, "To learn more about our solutions." and "BOOK A DEMO". | Ends on one action, the same demo link the YouTube description gives. |
Storyboard: the frames that carry the Talentia software product video
Key frames from the finished video, in order. Select a time to play that moment above.
The video promises one task, not the whole HCM suite. 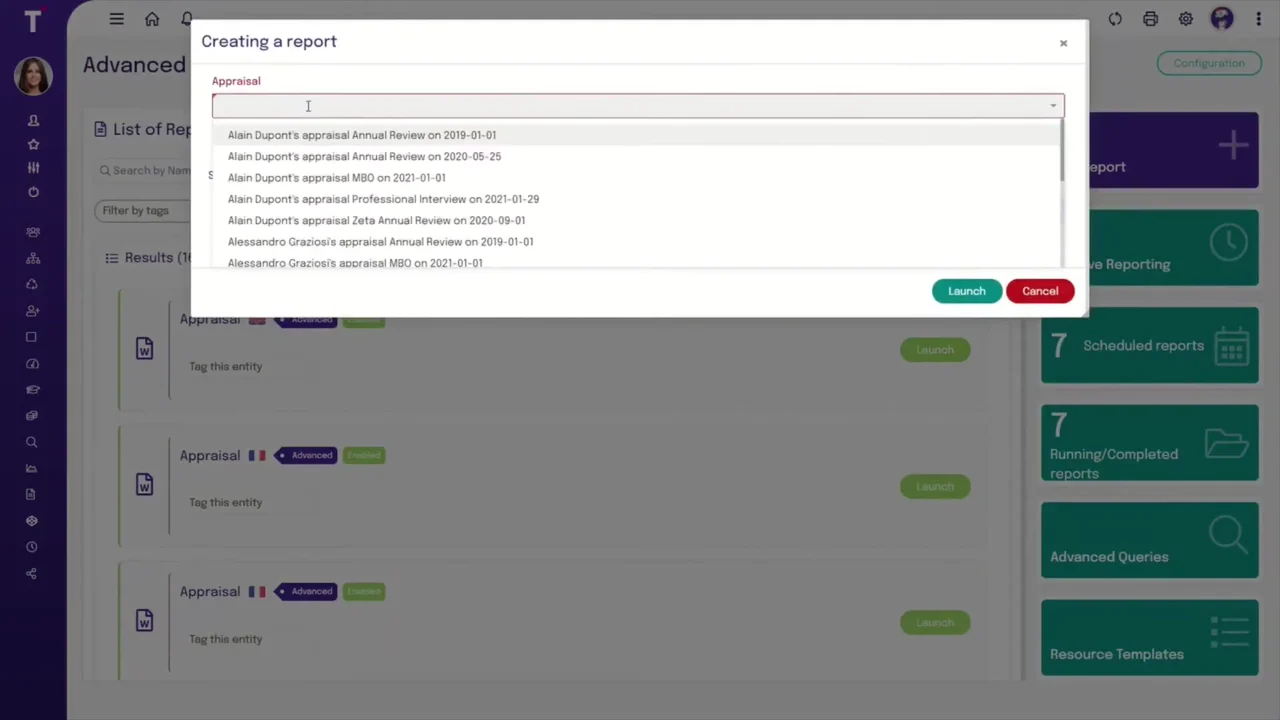
A report starts from a list of real appraisals, not a query. 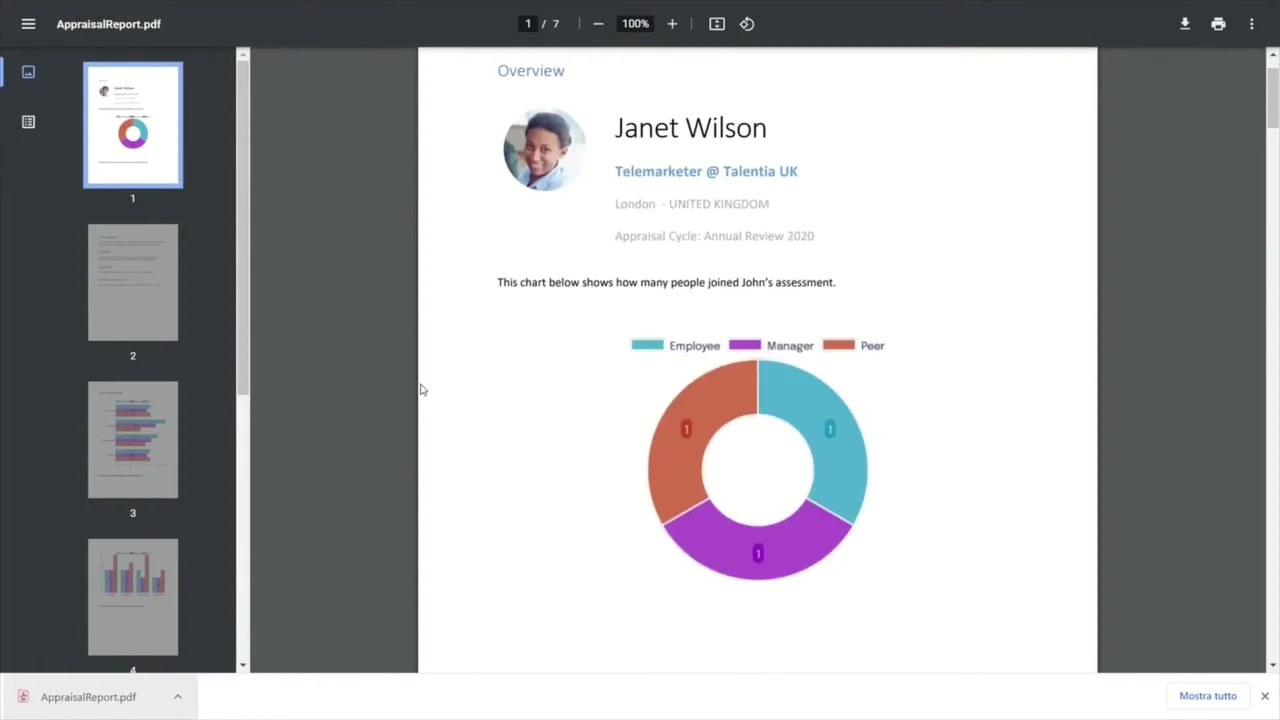
The output is a finished PDF the manager can send. 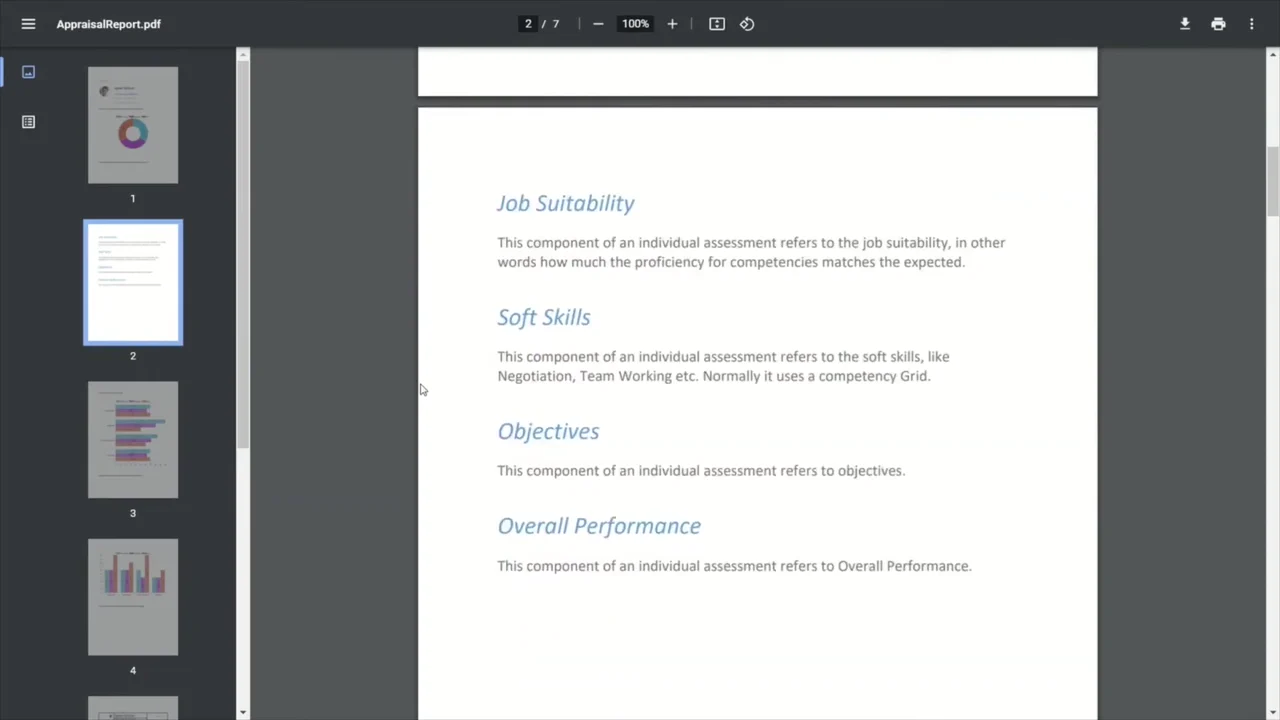
The report explains each part of the score in plain words. 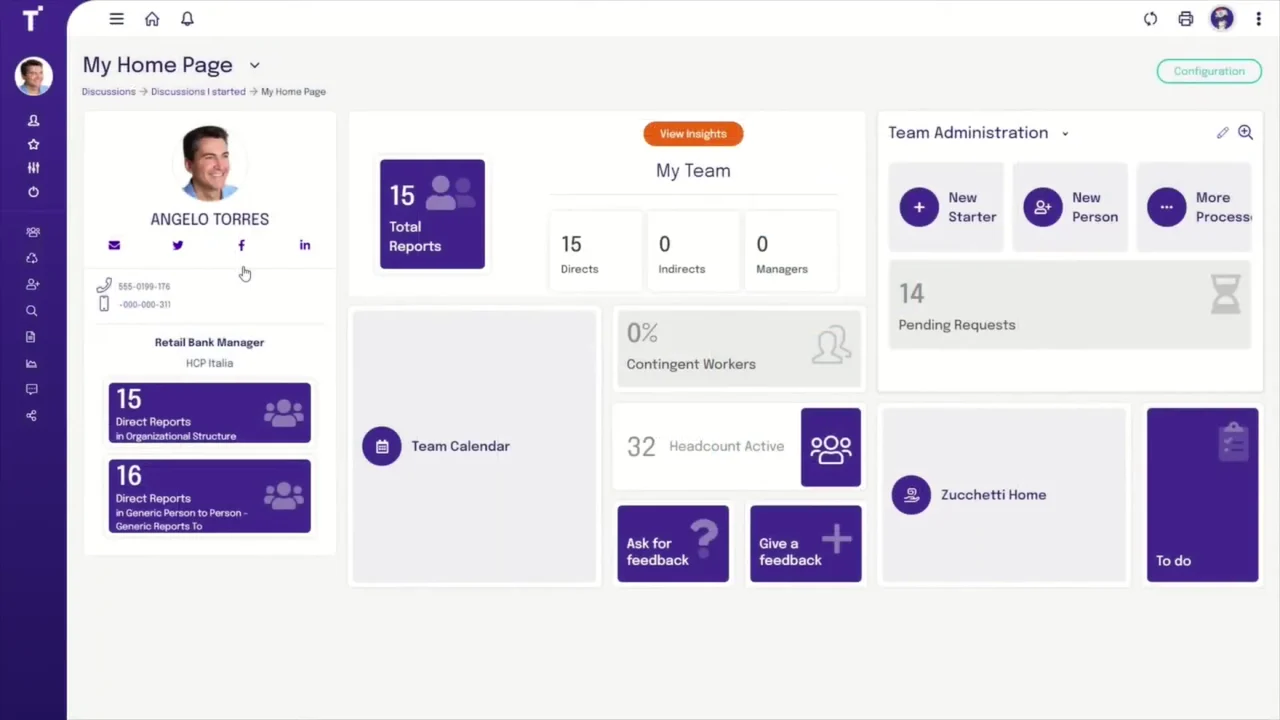
The demo account belongs to a named manager with a real role. 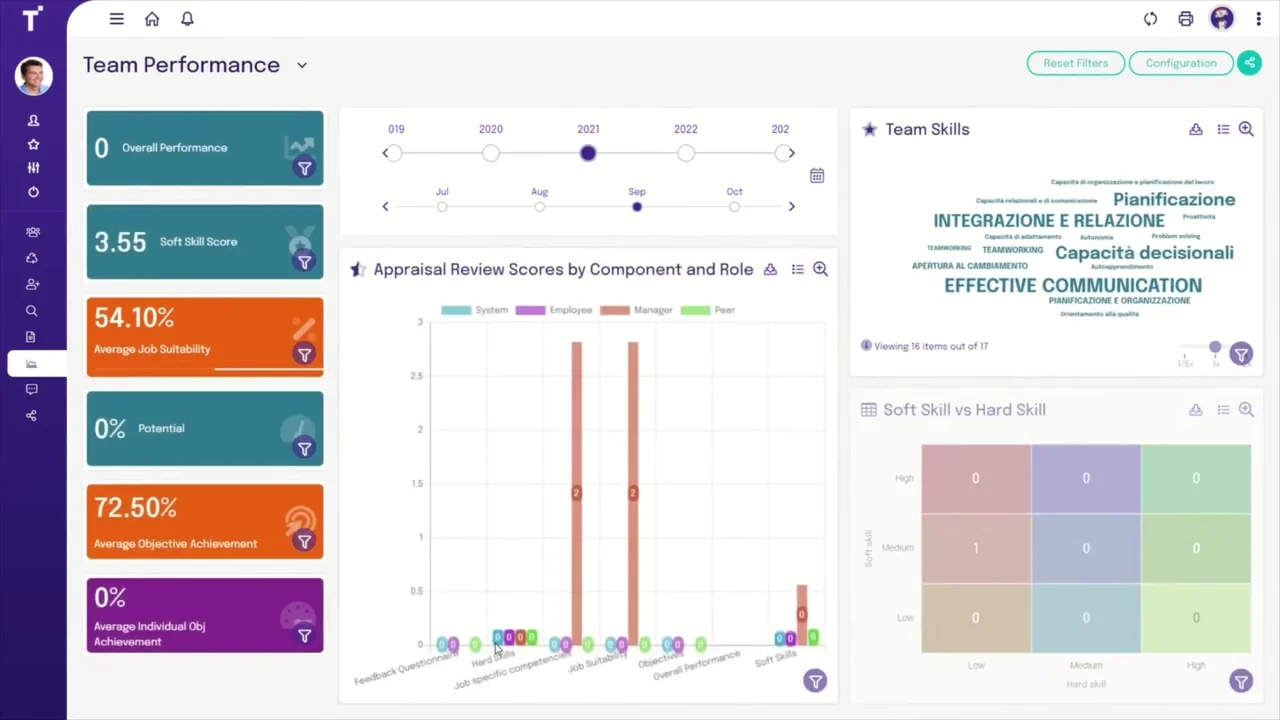
The team view turns the reports into numbers a manager can act on. 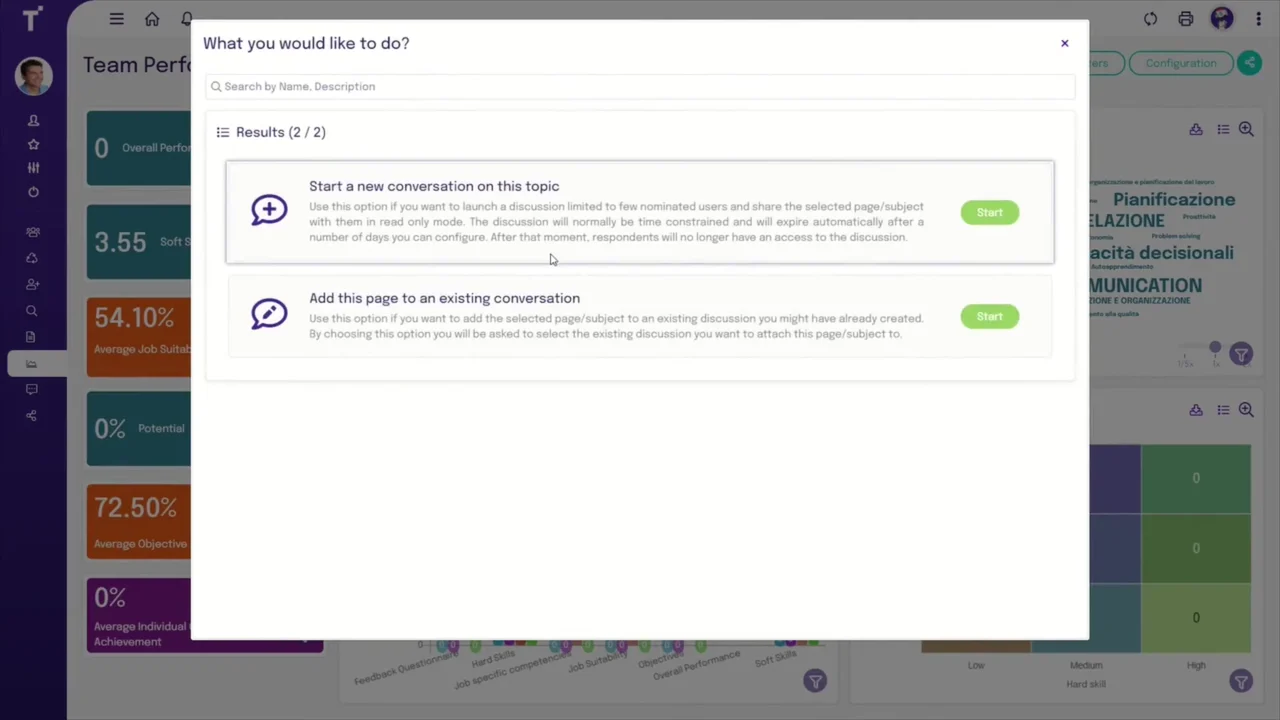
Sharing starts from the dashboard itself. 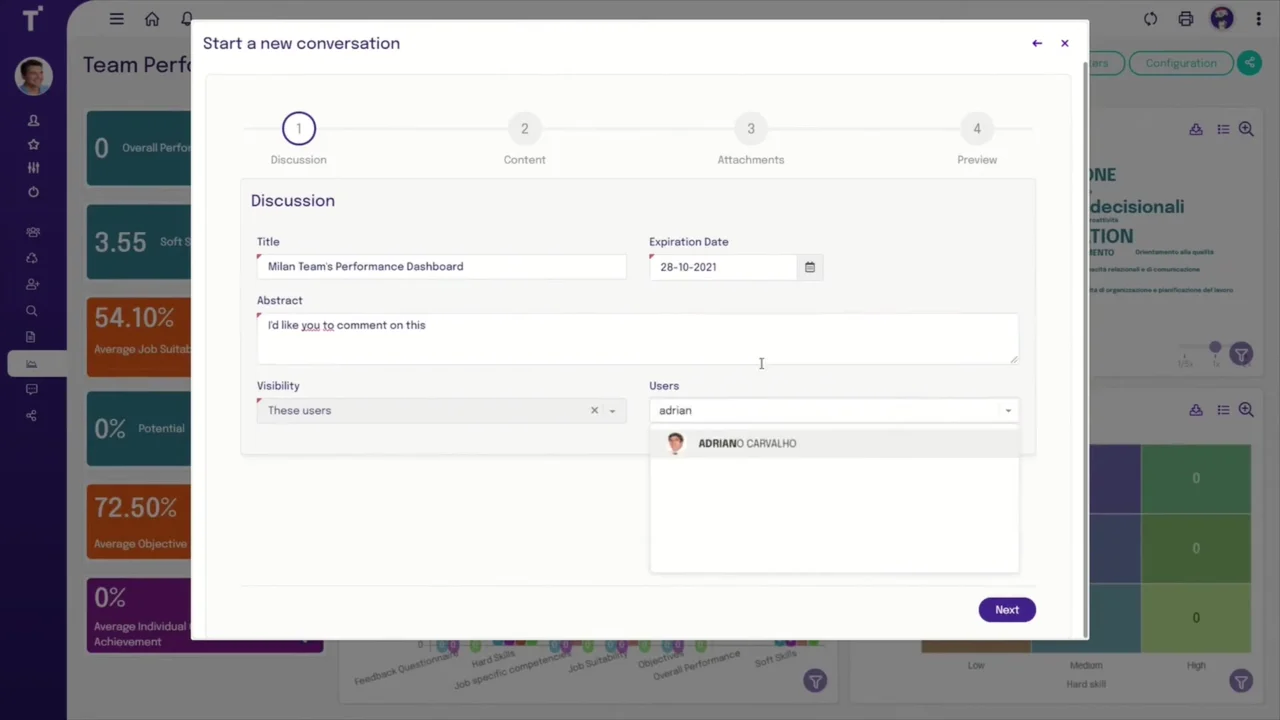
The manager names the dashboard and picks who sees it. 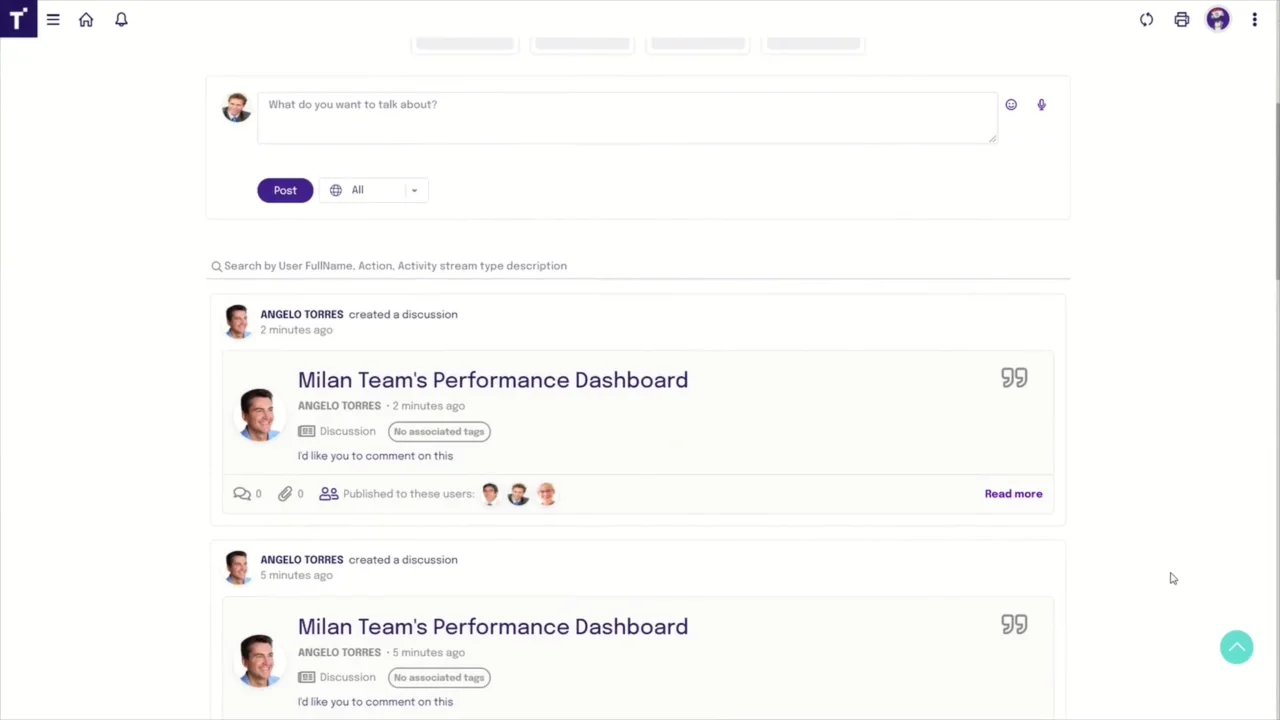
The shared dashboard lands in a colleague's feed. 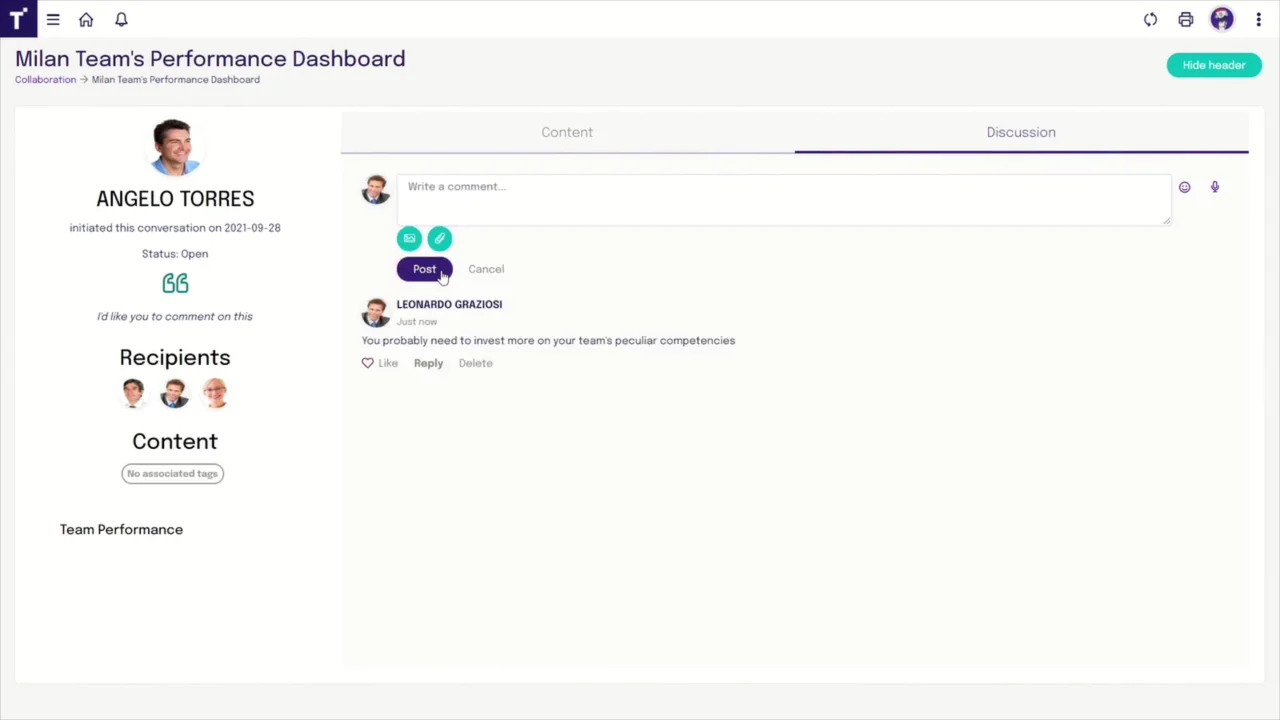
The loop closes when the colleague replies.
4 decisions behind the Talentia software product video
Decision 1
Promise one task in the title
The title card at 0:03 says "HCM Product Demo" and "Smart Reporting", not the whole HCM suite, and the video never leaves that task.
Copy it: Pick the single job your buyer doubts most and make the whole video about it. Save the suite tour for another asset.
Decision 2
Show the finished report, not only the button
From 0:31 to 0:57 the video opens "AppraisalReport.pdf" and scrolls through its 7 pages: the appraisal cycle, a donut chart, the score headings, then bar charts.
Copy it: Show the document or screen your buyer will hand to their own boss. That output is what they are buying.
Decision 3
Fill the demo with a real manager's day
At 0:57 the home page belongs to a named manager, ANGELO TORRES, with a role, "Retail Bank Manager", and counts such as "15 Total Reports" and "14 Pending Requests".
Copy it: Load your demo account with believable data for your buyer's role, so they see their own week on screen.
Decision 4
Show the person who receives the share
The manager shares the dashboard from 1:15. At 1:42 the video switches to LEONARDO GRAZIOSI, an employee, who finds it under "Collaboration" and replies at 2:12.
Copy it: When you demo a sharing feature, show both ends: the person who sends and the person who answers.
From Talentia HCM screens to a 2:18 reporting demo
- 1 task, 3 promises. The flow was built around reporting alone and the 3 promises in Talentia's copy: fast and simple, personalized, and shared.
- Screen recording. The report list, the appraisal PDF, the team home page, the performance dashboard and the collaboration feed were recorded in the live Talentia HCM interface.
- Data views. The donut and bar charts in the appraisal report and the team dashboard each get their own scene, so the viewer sees the numbers and not just the menus.
- Title cards and graphic design. The opening logo, the "Smart Reporting" card and the "BOOK A DEMO" end card were designed in Talentia's purple and magenta.
- UI animation and compositing. Recordings were cut, timed and composited so each step follows the last without dead time, including the switch from the manager's account to the employee's.
- Sound, grade and edit. Sound design, color grading and the final edit set the pace across the 6 sections.
Scope of work:
Production took 3 to 4 weeks on a budget of $1,200 to $2,000. See the SaaS video production service for how a project like this is scoped.
Questions about the Talentia software product video
What does the Talentia software product video show first?
The Talentia logo at 0:01, the title card "HCM Product Demo" and "Smart Reporting" at 0:03, and from 0:06 the Talentia HCM home screen with a map of Europe. The video names its one task before it shows any screen.
Which report does the Talentia HCM video produce?
An appraisal report. At 0:31 "AppraisalReport.pdf" opens for "Janet Wilson" with "Appraisal Cycle: Annual Review 2020" and a donut chart split into "Employee", "Manager" and "Peer", followed by pages of bar charts until 0:57.
How does the video show a manager's view of the team?
At 0:57 "My Home Page" shows ANGELO TORRES's tiles: "15 Total Reports", "14 Pending Requests", "Ask for feedback" and "Give a feedback". From 1:09 the "Team Performance" dashboard follows, with "54.10% Average Job Suitability" and a "Soft Skill vs Hard Skill" grid.
How does the Talentia video show collaboration on dashboards?
At 1:15 the manager picks "Start a new conversation on this topic" and shares the dashboard as "Milan Team's Performance Dashboard". At 2:12 an employee, LEONARDO GRAZIOSI, replies under it, which matches the "Social & Collaboration power" promise in the YouTube description.
Is the Talentia video animated or recorded?
The product is shown as a screen recording of the live interface, with the cursor visible, for example on the appraisal PDF at 0:34. Designed title cards open the video at 0:03 and close it at 2:14 with "BOOK A DEMO".
How long did the Talentia software product video take, and what did it cost?
The scope covered screen recording, UI animation, data visualization, motion graphics, graphic design, sound design, visual effects, compositing, color grading and editing. Production took 3 to 4 weeks on a budget of $1,200 to $2,000.
What Advids clients say
"Advids was truly a phenomenal partner to work with, translating our sophisticated edge routing capabilities into a beautiful, engaging visual format. We achieved incredible viewer retention among enterprise IT architects."Neha Singh, Marketing Manager at Arista Networks


Need HR or finance buyers to watch your software do one job, start to finish?
Talk to Advids