
 /home/wwwroot/advids.co/design/index.php on line 425
Introduction: The Visualization of Invisible Velocity
The global logistics industry is currently navigating a period of unprecedented densification. With the third-party logistics (3PL) market size projected to surpass USD 1.6 trillion in 2025, the operational margin for error has effectively vanished. For Operations Directors and CTOs, the challenge is no longer just moving physical freight; it is orchestrating the immense, invisible flow of data that accompanies every SKU.
In this high-stakes environment, "blind spots" are the enemy. The most successful 3PL automation platforms differentiate themselves not by listing features, but by visualizing clarity. They bridge the "Physical/Digital Divide"—turning abstract API calls and warehouse algorithms into tangible, understandable narratives. This is not just an aesthetic upgrade; it is a strategic imperative. Industry data reveals a critical shift in buyer psychology: 74% of shippers indicate they would be likely to switch 3PL providers based on their technology and AI capabilities alone.
This guide is your strategic blueprint for visualizing that capability. We have curated 30 distinct visual styles, mapped specifically to the friction points of the modern supply chain. From the stark clarity of minimalist vector art that "untangles" complex routing, to the immersive depth of photorealistic digital twins, these examples are designed to reduce cognitive load and build immediate trust. They prove to your prospective shippers that your "Glass Warehouse" is not just a promise—it is a visible reality.
Let’s explore how to visualize the future of fulfillment.
1. The Logic of Order
TOFU | Market Education

The Visual & Narrative Approach
This style utilizes a stark, high-contrast "Problem/Solution" composition. On the left, a tangled, frantic knot of dark grey lines represents the status quo of legacy logistics—unpredictable, messy, and opaque. As the lines move right, they pass through an invisible filter (your platform) and resolve into a single, streamlined Electric Blue vector. This is not just a drawing; it is a visual promise. The narrative tone should be calm and restorative, positioning the software as the ultimate untangler of operational knots.
Psychological Impact & KPI Focus
- Niche Psychology: Operations Directors often feel a constant background anxiety about "what they can't see." This visual directly addresses that pain point by validating their feeling of chaos and immediately offering a resolution.
- Operational Impact: It visualizes Process Standardization. The transition from "tangle" to "straight line" subconsciously communicates a reduction in error rates and an increase in Cycle Time Consistency.
Strategic Implementation & Trade-offs
- Best Use Case: A 15-second LinkedIn video ad targeting frustrated operations managers. It stops the scroll by mirroring their current state of mind.
- Strategic Trade-off: While excellent for high-level concept selling, this style is too abstract to demonstrate specific UI features or complex functionalities. Use it for the "Why," not the "How."
Companies using similar video content -
Kinaxis – RapidResponse – Visualizing concurrent planning and process flow.
Logility – Digital Supply Chain Platform – Streamlining supply chain planning processes.
2. The Rhythm of Throughput
TOFU | Brand Awareness

The Visual & Narrative Approach
This style creates a rhythmic, hypnotic flow using abstract geometric shapes. Vibrant coral and deep purple "parcels" glide effortlessly along a stylized, curved path that implies a conveyor belt. The motion is continuous and frictionless, with speed blurs indicating high velocity. The background is a stark, clinical white, ensuring that the focus remains entirely on the movement of the assets. The narration should be upbeat and tempo-driven, matching the visual rhythm to reinforce the feeling of speed.
Psychological Impact & KPI Focus
- Niche Psychology: Logistics is about flow. Any stoppage is money lost. This style taps into the desire for "Frictionless Operations." The smooth curves suggest a system that handles exceptions gracefully without halting the line.
- Operational Impact: This style effectively visualizes Throughput Velocity. It creates a feeling of momentum and continuous delivery, essential for brands promising rapid fulfillment or same-day processing.
Strategic Implementation & Trade-offs
- Best Use Case: A 1:1 Social Ad (Instagram/Facebook) designed to build brand recall. The vibrant colors stand out in dull B2B feeds.
- Strategic Trade-off: The abstraction means you lose the "grit" of real logistics. It may feel too "marketing-heavy" for technical buyers who want to see the actual warehouse floor.
Companies using similar video content -
FarEye – Logistics Platform – Visualizing continuous delivery and dispatch flow.
Bringg – Delivery & Fulfillment Platform – Orchestrating seamless last-mile operations.
4. The Perfect Pick
TOFU | Aspiration Hook
The Visual & Narrative Approach
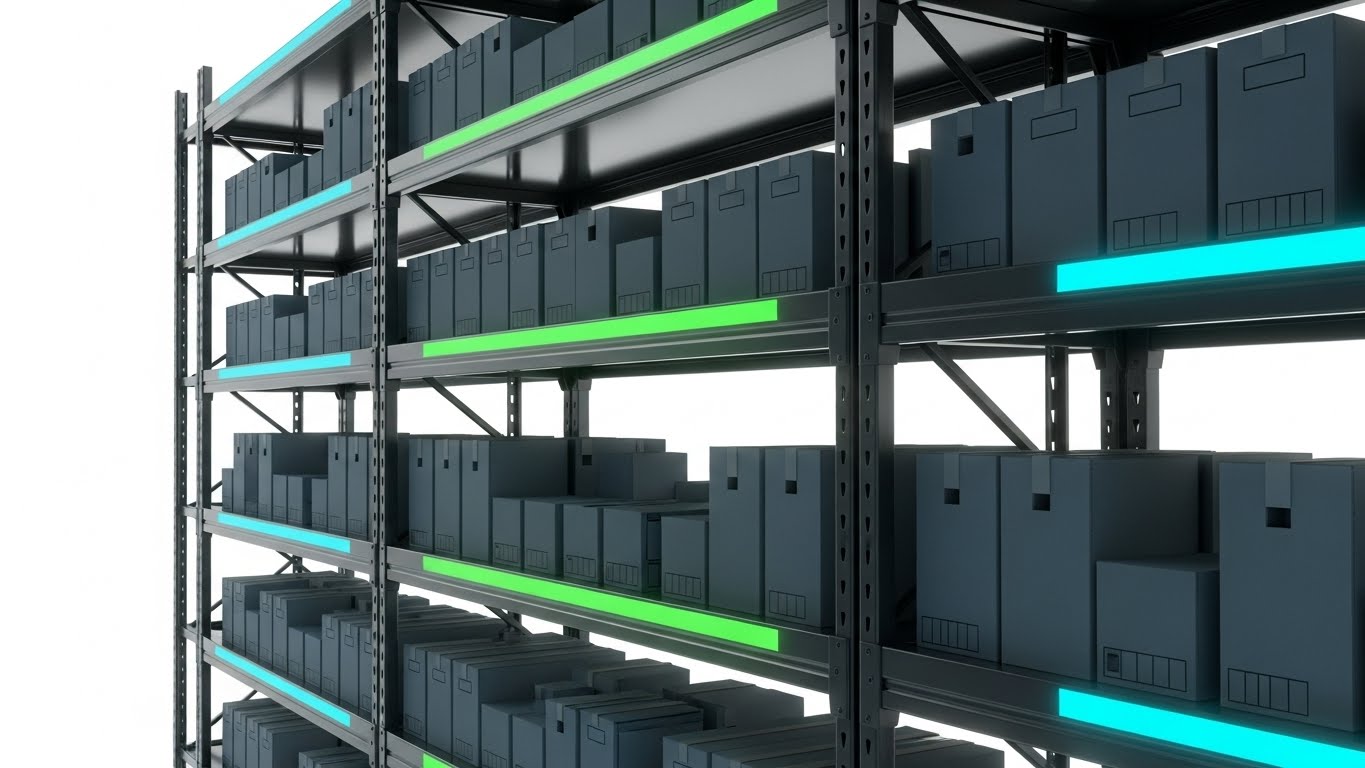
This visualization presents the "Platonic Ideal" of a warehouse. We see a close-up, photorealistic render of industrial shelving, spotless and gleaming. The cardboard boxes are uniform, and the Emerald Green labels glow softly, indicating 100% accuracy. The lighting is studio-quality, emphasizing the texture of the materials. There is no dirt, no dust, and no misalignment. The narrative should be reverent and premium, framing this state of perfection as an achievable standard with your software.
Psychological Impact & KPI Focus
- Niche Psychology: Every warehouse manager fights a daily battle against entropy (disorder). This image represents their professional aspiration: The "Perfect Order" state. It validates their desire for cleanliness and control.
- Operational Impact: It visualizes Inventory Accuracy and Compliance. The green labels serve as a visual shorthand for "verified" and "correct," reinforcing trust in the system's data integrity.
Strategic Implementation & Trade-offs
- Best Use Case: The Hero Section of a landing page. It instantly establishes the brand as a premium, "Gold Standard" solution.
- Strategic Trade-off: High production cost (Octane/Redshift rendering). It sets a very high visual bar that the actual product UI must live up to.
Companies using similar video content -
MercuryGate – TMS – Managing complex transportation logistics efficiently.
5. The Digital Nervous System
TOFU | Shaping Perception

The Visual & Narrative Approach
Here, we visualize the invisible. Glowing Cyan nodes hover in a pristine white void, connected by intricate beams of crystalline light. These nodes represent the API connections between ERPs, WMS, and carriers. The camera drifts through this network, revealing depth and complexity without clutter. Particle effects signify real-time data transfer. The aesthetic is "High-Tech Clinical." The narration should be futuristic and intelligent, focusing on connectivity, integration, and the "Digital Nervous System" of the supply chain.
Psychological Impact & KPI Focus
- Niche Psychology: For CTOs, the fear is "Integration Hell." This style alleviates that fear by making integration look elegant, clean, and organized. It turns the "messy backend" into a "beautiful network."
- Operational Impact: It visualizes Connectivity and Real-Time Data Flow. It demonstrates that your platform is the central brain connecting disparate systems, a crucial value prop for modern SaaS.
Strategic Implementation & Trade-offs
- Best Use Case: LinkedIn Video background or a specific "Integration" feature page. It communicates sophistication and modernity.
- Strategic Trade-off: It is highly abstract. If not anchored with text explaining what the nodes represent (e.g., "Shopify", "SAP", "FedEx"), the viewer might miss the practical application.
Companies using similar video content -
Dematic – WMS – Showcasing ideal automated warehouse layouts and inventory.
Swisslog – SynQ WMS – Visualizing perfect inventory in automated systems.
6. The Blueprint of Accuracy
TOFU | YouTube Organic
The Visual & Narrative Approach
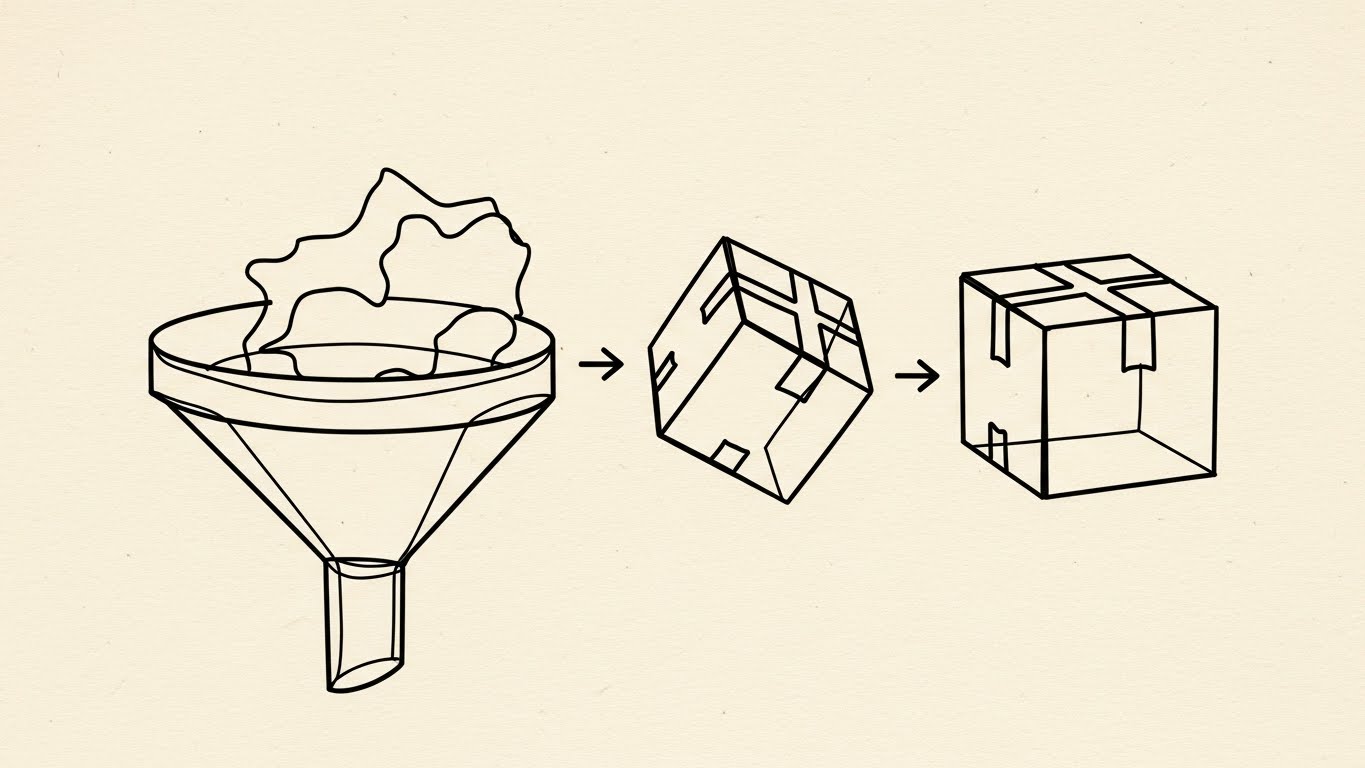
This style strips away all noise. Using a sophisticated black ink continuous line on a textured cream paper background, we watch a "rough sketch" of a package enter a funnel and emerge as a mathematically precise "cube." There are no fill colors, only the confidence of the line. The motion is elegant and deliberate. The narration should be understated and academic, focusing on the science of optimization and the elimination of waste.
Psychological Impact & KPI Focus
- Niche Psychology: This appeals to the "Purist" in logistics—the manager who values lean methodologies (Six Sigma). It suggests that the software cuts through the noise to deliver pure efficiency.
- Operational Impact: It visualizes Data Validation and Standardization. The transformation from "rough" to "precise" is a direct metaphor for standardization and quality control.
Strategic Implementation & Trade-offs
- Best Use Case: YouTube Thumbnails or "How It Works" explainer videos. The simplicity reduces cognitive load, making complex concepts easier to understand.
- Strategic Trade-off: It lacks the "excitement" of 3D or motion graphics. It relies entirely on the strength of the concept and the fluidity of the animation.
Companies using similar video content -
E2open – Global Supply Chain Platform – Connecting disparate supply chain partners and data.
Turvo – Collaboration Platform – Visualizing real-time network connectivity and collaboration.
7. The Momentum of Freight
TOFU | Differentiation

The Visual & Narrative Approach
This is a high-energy visual designed for mobile screens. Abstract blocks of "Warning Yellow" and "Deep Black" slam together to form the silhouette of a semi-truck. The text itself is structural—the words build the vehicle. The diagonal composition creates a sense of aggressive forward momentum. The background is a solid, unignorable yellow. The narration (or sound design) should be punchy, rhythmic, and bold, matching the heavy impact of the visuals.
Psychological Impact & KPI Focus
- Niche Psychology: Logistics is a heavy industry. It deals with tons of freight. This style respects the "weight" of the industry while modernizing it. It appeals to the boldness required to manage large fleets.
- Operational Impact: It visualizes Speed and Reliability. The solid, blocky structure implies that the system is robust and crash-proof, while the yellow signals caution/alertness, a key safety color in warehouses.
Strategic Implementation & Trade-offs
- Best Use Case: Instagram Stories or TikTok ads. It is designed to disrupt the pattern of scrolling with bold colors and rapid motion.
- Strategic Trade-off: It is very aggressive. It works for "Hyping" a launch or a new feature but is too intense for detailed educational content or calm reassurance.
Companies using similar video content -
Fortna – Warehouse Design & Optimization – Illustrating precise warehouse layout planning and execution.
Mecalux – Easy WMS – Depicting accurate order processing workflows and efficiency.
9. Fluid Logistics
MOFU | Skippable Ad

The Visual & Narrative Approach
This style introduces a tactile, premium feel. We see amorphous, liquid blobs of Glossy Pink and Liquid Gold morphing into structured, solid cubes. The lighting creates high-contrast specular highlights, making the surfaces look wet and expensive. The background is a soft matte pink. This visualizes "Fluid Logistics"—the ability to adapt to market changes instantly. The narration should be smooth and sophisticated, focusing on adaptability, agility, and premium service levels.
Psychological Impact & KPI Focus
- Niche Psychology: The modern supply chain must be agile. This style appeals to the desire for flexibility—the ability to change shape without breaking. It also cues "high value" through the gold and gloss aesthetics.
- Operational Impact: It visualizes Agility and Order Consolidation. The morphing shapes represent the consolidation of fragmented orders into a single, solidified shipment.
Strategic Implementation & Trade-offs
- Best Use Case: Facebook/Meta Ads targeting e-commerce brands (DTC). It aligns with the aesthetic of high-growth lifestyle brands that need 3PL services.
- Strategic Trade-off: It can look "too B2C." Care must be taken to ensure the voiceover remains grounded in B2B value propositions (efficiency, cost) despite the playful visual.
Companies using similar video content -
Convoy – Digital Freight Network – Highlighting rapid freight matching and movement.
Loadsmart – Digital Freight Brokerage – Emphasizing fast, AI-powered freight booking.
10. The Control Tower View
MOFU | Feature Education

The Visual & Narrative Approach
This style offers a "God's Eye View" of the warehouse floor. We see a miniature, isometric section of a warehouse with faceless workers in Pastel Blue and tiny Orange forklifts. The key element is the Augmented Reality layer: semi-transparent data tiles float above each worker, displaying efficiency metrics and bar charts. The floor is a clean grid. The narration is educational and instructional, walking the viewer through the specific workflows and data points visible on the screen.
Psychological Impact & KPI Focus
- Niche Psychology: Managers want total oversight. The isometric view gives them a sense of total control and omniscience. They can "see everything" at once, satisfying the need for supervision without micromanagement.
- Operational Impact: It visualizes Workforce Management and Real-Time Analytics. It explicitly shows how the software augments the human worker, improving picking accuracy and labor efficiency.
Strategic Implementation & Trade-offs
- Best Use Case: Website "Features" page or a Product Demo video. It is the bridge between abstract marketing and the actual software interface.
- Strategic Trade-off: It requires detailed modeling. If the miniature warehouse looks too cute, it might trivialize the complexity of the operation. It must remain "technical" enough to be taken seriously.
Companies using similar video content -
Geek+ – AMR Solutions – Visualizing autonomous mobile robots for warehouse speed.
11. The Dashboard of Clarity
MOFU | Demand Gen
The Visual & Narrative Approach
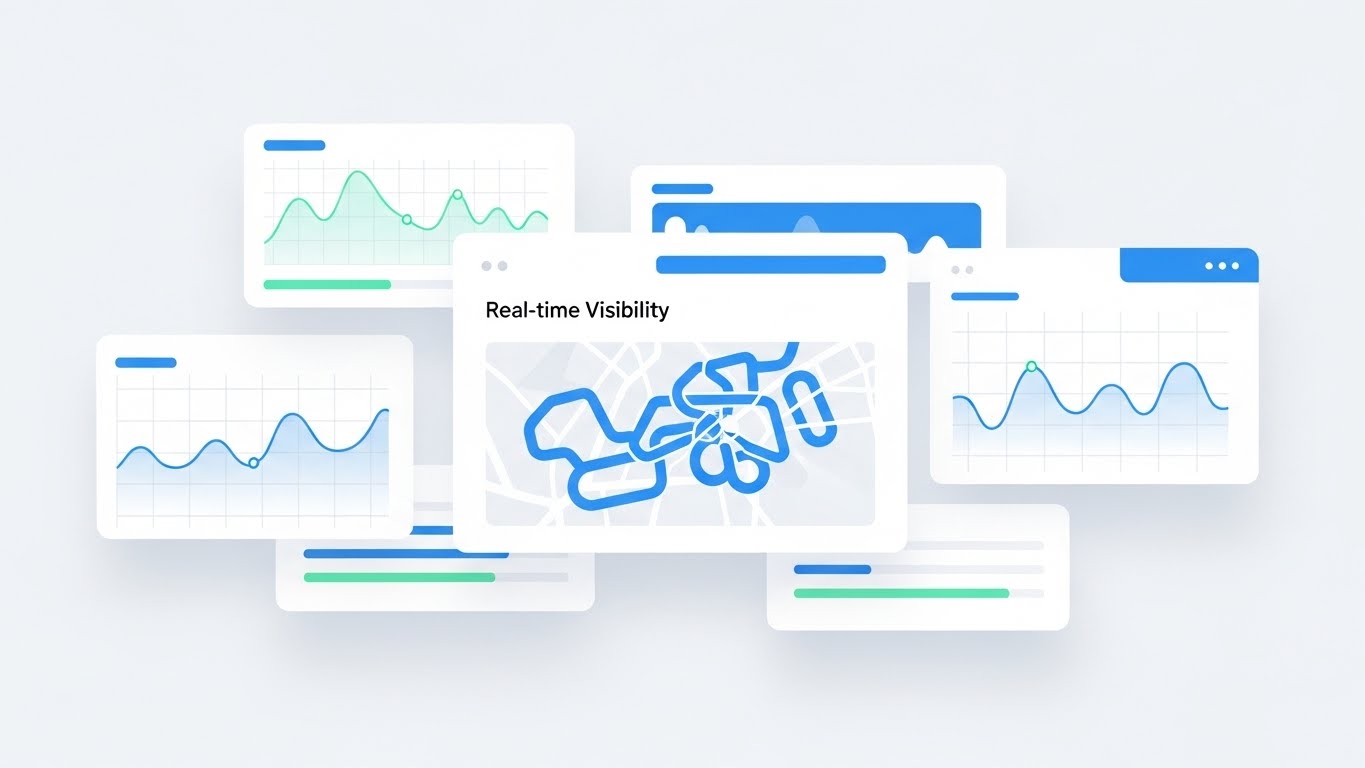
This style champions the "Modern SaaS" aesthetic—clean, airy, and inviting. Against a soft light grey background, we see floating UI panels with subtle drop shadows, creating a sense of hierarchy and order. The data is presented in calming Sky Blue and Mint Green, purposely stripping away the intimidation often associated with dense logistics dashboards. The visual anchor is the "Real-time Visibility" map, which simplifies complex routes into clear vectors. The narration should be crisp and confident, emphasizing "Single Pane of Glass" visibility and the reduction of decision fatigue.
Psychological Impact & KPI Focus
- Niche Psychology: 3PL managers are often traumatized by "clunky" legacy software (green screens and dense spreadsheets). This visual directly combats "Implementation Anxiety." It creates the immediate perception that the software is easy to learn and pleasant to use daily.
- Operational Impact: It visualizes User Experience (UX) and Exception Management. It demonstrates that complex data points (routes, volume, alerts) can be synthesized into a clear, actionable dashboard, reducing Time-to-Insight.
Strategic Implementation & Trade-offs
- Best Use Case: The primary visual for your website's Landing Page or "Product" section. It serves as the definitive "This is what you get" image.
- Strategic Trade-off: By prioritizing cleanliness, you may simplify data density. Ensure the accompanying text reassures power users that deep-dive granularity is available one click deeper.
Companies using similar video content -
Flexe – On-demand Warehousing & Fulfillment – Adapting to fluctuating demand with flexible space.
Stord – Cloud Supply Chain – Visualizing agile and adaptable fulfillment networks.
12. The Pulse of Operations
MOFU | Functional Buyer

The Visual & Narrative Approach
This style bridges the physical reality of the warehouse with digital intelligence. We use a hyper-lapse of a real warehouse aisle—blurring the movement of forklifts in warm amber and cool white streaks to signify speed. Overlaid on this organic chaos are sharp, precise Cyan Digital Lines and data points that track the motion. This visualizes the concept of "Digital Supervision." The narrative should be grounded and industrial, speaking to the "grit" of operations while highlighting the sophistication of the tracking software.
Psychological Impact & KPI Focus
- Niche Psychology: Functional buyers (Operations Managers) are skeptical of "cartoons." They trust what they can see. This style validates their reality (the busy warehouse) while showing how your software imposes order upon it.
- Operational Impact: It visualizes Throughput Velocity and Asset Tracking. The contrast between the blur (speed) and the sharp lines (control) perfectly encapsulates the value prop: Speed without chaos.
Strategic Implementation & Trade-offs
- Best Use Case: LinkedIn Video Ads targeting Operations Directors. The motion stops the feed, and the real-world footage establishes immediate industry relevance.
- Strategic Trade-off: This style requires high-quality stock footage or custom shooting. If the underlying footage looks generic or low-budget, it can degrade the perceived quality of the software overlay.
Companies using similar video content -
Manhattan Associates – Supply Chain Commerce Solutions – Providing a comprehensive view of warehouse operations.
Körber Supply Chain – WMS – Offering a holistic view of warehouse activities.
13. The Architecture of Assets
MOFU | Competitive Displacement

The Visual & Narrative Approach
This visual utilizes a powerful split-screen composition to illustrate the concept of the "Digital Twin." On the left, a truck is rendered as a complex Blue wireframe on a grid, representing the data structure and planning phase. As it crosses a glowing vertical threshold to the right, it instantly resolves into a photorealistic White delivery truck on a road. This transition symbolizes the seamless translation of digital planning into physical execution. The narrative should focus on precision, planning, and the elimination of the "planning-execution gap."
Psychological Impact & KPI Focus
- Niche Psychology: This speaks to the desire for Predictability. It assures the buyer that what is planned in the system is exactly what happens on the road. It positions the software as the "architect" of their operations.
- Operational Impact: It visualizes Simulation and Capacity Planning. It effectively argues that better data structure (wireframe) leads to better physical outcomes (reality).
Strategic Implementation & Trade-offs
- Best Use Case: Sales Slide Decks or Webinars. It is a perfect visual metaphor to explain "How it works" during a competitive displacement pitch against legacy systems.
- Strategic Trade-off: It is highly conceptual. It sells the idea of accuracy rather than a specific feature. It should be paired with actual UI screens to ground the concept.
Companies using similar video content -
project44 – Advanced Visibility Platform – Presenting clear, actionable real-time visibility data.
FourKites – Real-Time Visibility Platform – Offering intuitive dashboards for supply chain insights.
14. The Human-Machine Sync
MOFU | Building Trust

The Visual & Narrative Approach
Here, the focus shifts to the human element. We see an over-the-shoulder shot of a warehouse associate wearing a safety vest, holding a tablet. The screen displays a crisp, high-tech UI with "Active Zones" highlighted in green. The background is a warm, sunlit warehouse, blurred to keep focus on the interaction. This is not about replacing people; it is about augmenting them. The narrative should be empathetic and empowering, focusing on "giving your team the tools they need to succeed."
Psychological Impact & KPI Focus
- Niche Psychology: This addresses the fear of User Resistance. Managers worry their teams won't use complex new tools. This image proves the interface is mobile-friendly and helpful, not a hindrance.
- Operational Impact: It visualizes Workforce Empowerment and Mobile Execution. It shows that the intelligence of the platform extends to the edge of the network—the hands of the worker.
Strategic Implementation & Trade-offs
- Best Use Case: The "About Us" or "Team" section of the website, or in Case Studies. It humanizes the brand and appeals to values-driven organizations.
- Strategic Trade-off: It can feel like generic stock photography if the UI overlay isn't perfectly composited (tracked) to the tablet screen. The quality of the "fake" UI is critical to maintaining credibility.
Companies using similar video content -
Zebra Technologies – Savanna – Overlaying data on fast-paced warehouse operations.
Locus Robotics – Autonomous Mobile Robots – Tracking robot movement and throughput in real-time.
15. The Ease of Onboarding
MOFU | Overcoming Objections

The Visual & Narrative Approach
This style creates a disarming, friendly atmosphere using flat 2D vector animation. A stylized character (wearing a vibrant teal shirt) interacts with a floating, semi-transparent Yellow UI screen. The character is smiling, and the screen displays a rising graph with a "smiley face" icon. The background is a simplified office space in muted mustard and grey. The aesthetic is intentionally "low-stress." The narrative should be conversational and reassuring, directly addressing objections about complexity or learning curves.
Psychological Impact & KPI Focus
- Niche Psychology: Automation can feel cold and intimidating. This style injects Warmth and Approachability. It subconsciously signals that the vendor is easy to work with and the software is user-friendly.
- Operational Impact: It visualizes Customer Satisfaction (CSAT) and Ease of Adoption. It moves the conversation away from "technical specs" to "user happiness," which is crucial for change management.
Strategic Implementation & Trade-offs
- Best Use Case: Explainer Videos or "Onboarding" previews. It works best when simplifying complex processes for non-technical stakeholders.
- Strategic Trade-off: If used too heavily, it can undermine the "Enterprise" feel. It should be used for "soft" topics (support, onboarding) rather than "hard" topics (security, API architecture).
Companies using similar video content -
O9 Solutions – Digital Brain Platform – Translating planning models into real-world execution.
Plex Systems – Smart Manufacturing Platform – Simulating and executing production plans.
16. The Architecture of ROI
MOFU | ROI Justification

The Visual & Narrative Approach
This style transforms a boring bar chart into a compelling industry metaphor. The "bars" of the chart are constructed from stacks of matte white shipping containers. As the chart rises from left to right, the tallest stack is rim-lit by a vibrant Chartreuse Green, signaling profit/growth. The environment is a clean, reflective white studio. This connects the physical volume of freight directly to financial performance. The narrative should be analytical and ROI-focused, speaking the language of the CFO: margins, growth, and efficiency.
Psychological Impact & KPI Focus
- Niche Psychology: The Economic Buyer (CFO/CEO) cares about the bottom line. This visual speaks their language by literally translating operations (containers) into financial metrics (charts).
- Operational Impact: It visualizes Volume Growth and Margin Expansion. It validates the core promise: "More freight, handled more efficiently, equals more profit."
Strategic Implementation & Trade-offs
- Best Use Case: Whitepapers, Annual Reports, or the "ROI" section of a sales deck. It provides visual evidence of business impact.
- Strategic Trade-off: It is purely metaphorical. It doesn't show the software interface or features, so it relies on the surrounding text to explain how that growth is achieved.
Companies using similar video content -
Zebra Technologies – Reflexis – Empowering frontline workers with mobile solutions.
ShipHero – WMS & Fulfillment Software – Providing intuitive tools for warehouse associates.
17. The Velocity of Features
MOFU | Sales Cycle Accel
The Visual & Narrative Approach
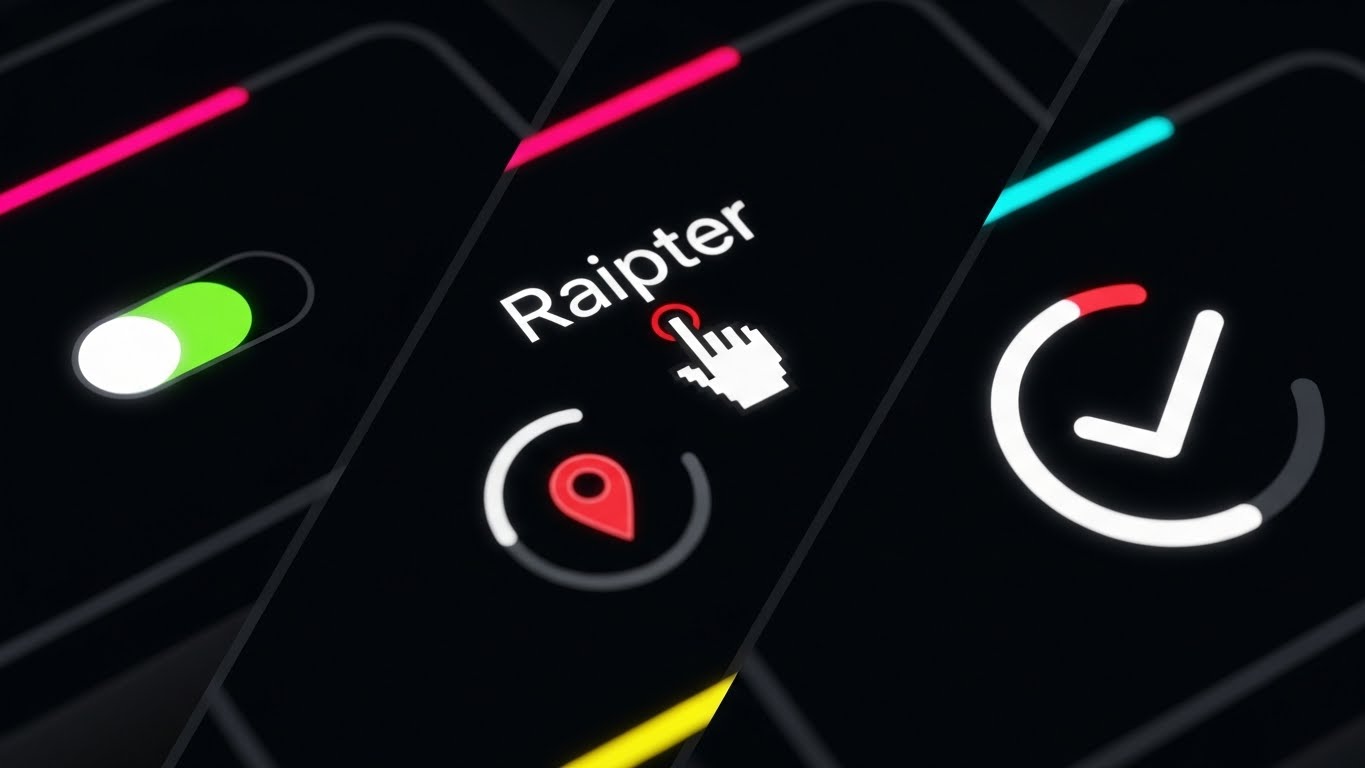
Designed for speed and impact, this style uses a diagonal split-screen composition to create a "Rapid Fire" effect. We see four distinct slices, each containing a high-contrast macro shot of a UI interaction: a Green toggle switching on, a cursor hitting a map pin, a progress ring closing, and a checkmark appearing. The color palette is high-contrast Black, White, and Red/Green indicators. The narrative is fast-paced, listing features in rapid succession to overwhelm the viewer with value.
Psychological Impact & KPI Focus
- Niche Psychology: Taps into the Fear of Missing Out (FOMO) and the desire for a "Complete Solution." It suggests the platform is feature-rich and leaves no operational gaps.
- Operational Impact: It visualizes Comprehensive Functionality and System Responsiveness. The "macro" view implies attention to detail in the UX design and highlights Automation Readiness.
Strategic Implementation & Trade-offs
- Best Use Case: Email GIFs or short social retargeting ads. The visual density works well to remind prospects of the platform's power during a long sales cycle.
- Strategic Trade-off: It is chaotic by design. It creates excitement but not understanding. Don't use this to explain how a feature works, only that it exists.
Companies using similar video content -
Shippo – Shipping API & Platform – Simplifying complex shipping processes for users.
ShipStation – Shipping Software – Visualizing easy setup and user-friendly interface.
18. The Depth of Insight
BOFU | Economic Buyer
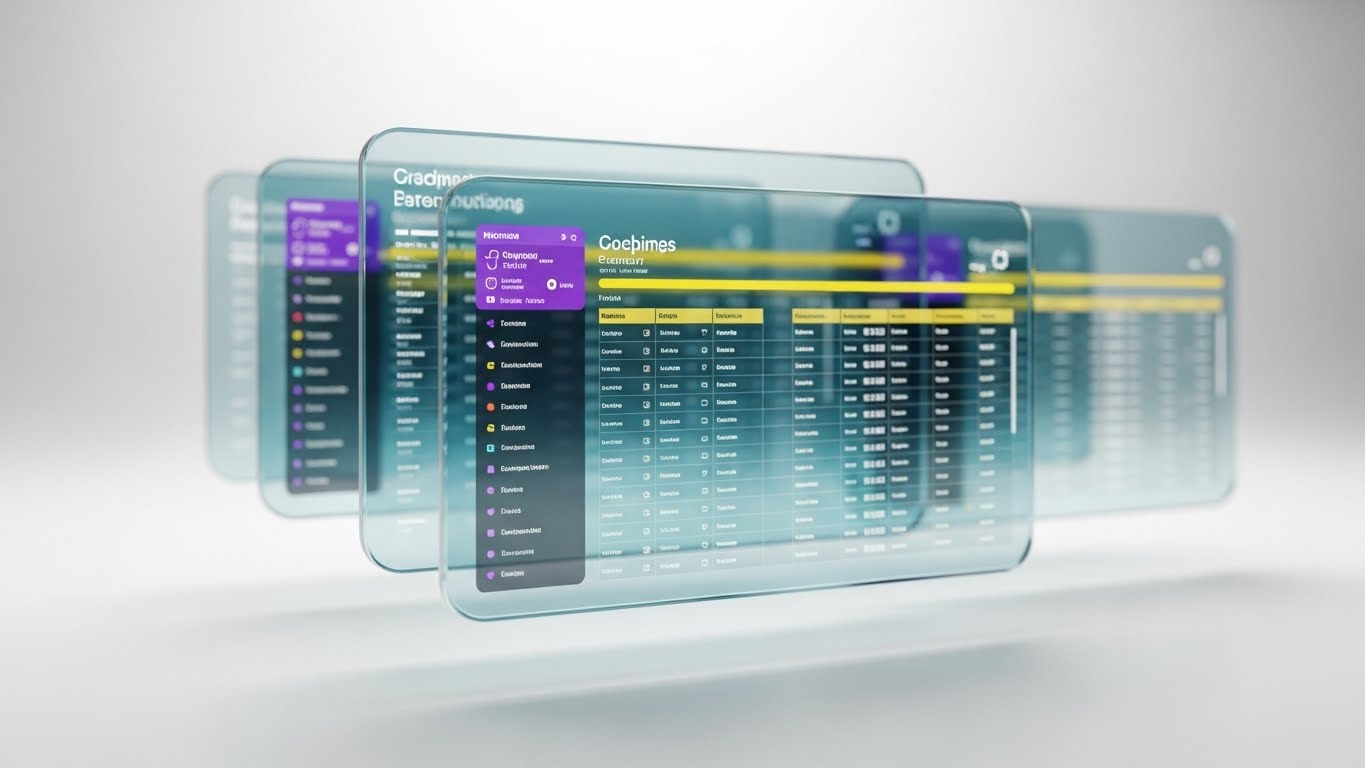
The Visual & Narrative Approach
This is the "Premium" view. We see multiple semi-transparent, glass-like UI screens floating in a parallax arrangement within a soft, bright white void. The depth of field creates a sense of sophistication, focusing on the front screen's detailed data grids in Cyan and Purple while blurring the rear layers. Light passes through the screens, creating caustic reflections. The narrative should be high-level and strategic, focusing on "Visibility," "Oversight," and "The Big Picture."
Psychological Impact & KPI Focus
- Niche Psychology: Executives want to feel they have "Depth of Vision." This style visualizes the ability to see through the layers of their business. It frames the software as an executive command center.
- Operational Impact: It visualizes Business Intelligence (BI) and Multi-Layered Analytics. It implies that the system handles complexity elegantly, presenting only what matters to the decision-maker.
Strategic Implementation & Trade-offs
- Best Use Case: Investor Decks or Executive Summary videos. It signals high status and enterprise-grade quality.
- Strategic Trade-off: The "Glass" aesthetic can sometimes obscure the actual data legibility. It prioritizes the feeling of sophistication over raw data readability.
Companies using similar video content -
SAP – SCM – Demonstrating financial impact of supply chain optimization.
Oracle – SCM Cloud – Visualizing growth and efficiency gains through data.
19. The Shield of Security
BOFU | Objection Handling
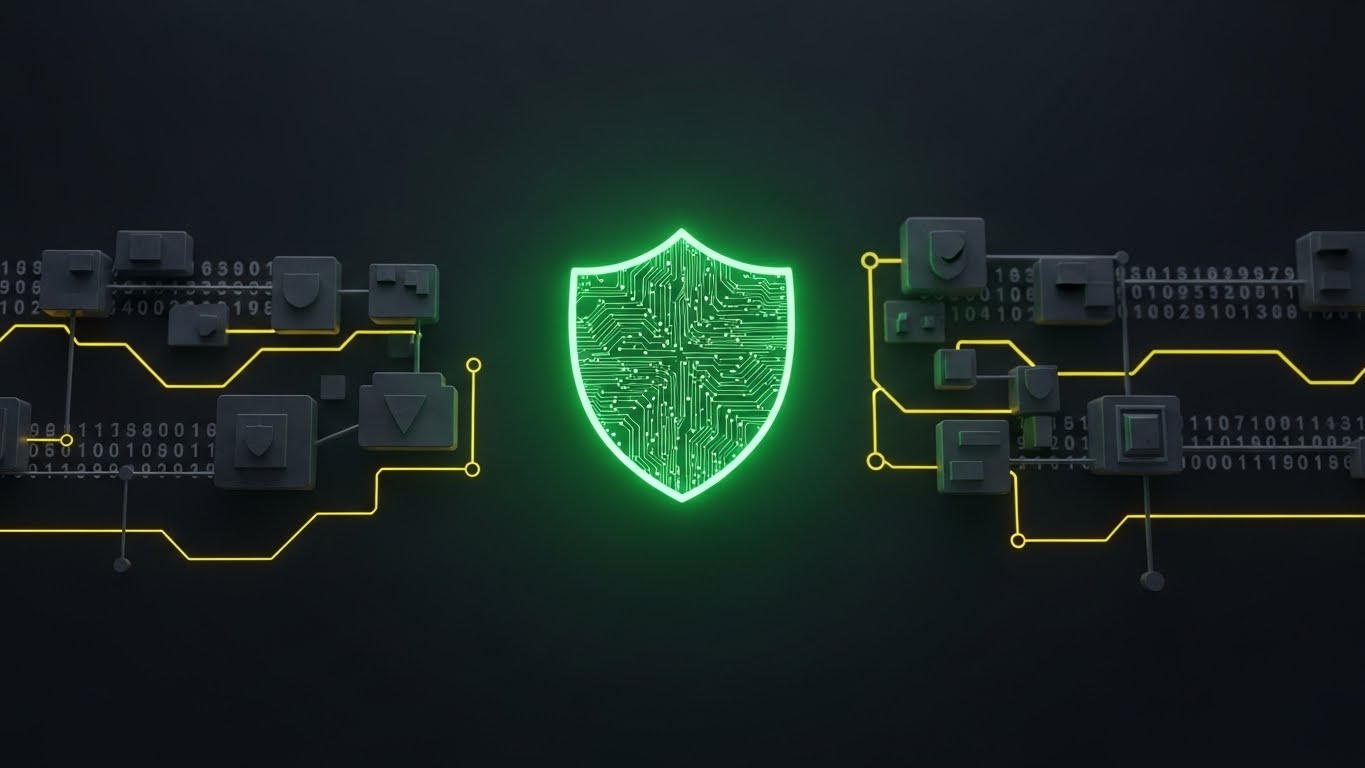
The Visual & Narrative Approach
Security is often the final hurdle in closing a B2B deal. This style utilizes a sleek "Dark Mode" aesthetic to communicate robustness. Against a deep charcoal background, a glowing Neon Green Shield icon is constructed from circuit board lines, symbolizing active protection. Surrounding code blocks imply encryption. The lighting is moody and serious. The narrative should be grave and reassuring, using terms like "SOC2 Compliance," "End-to-End Encryption," and "Data Sovereignty."
Psychological Impact & KPI Focus
- Niche Psychology: Alleviates the Fear of Risk. For the CTO or IT Director, security is binary. This visual signals "We take this seriously." It looks like cybersecurity software, not just logistics software.
- Operational Impact: It visualizes Data Security and Compliance. It visually reinforces the "Bank-Grade" security claims made in your technical documentation.
Strategic Implementation & Trade-offs
- Best Use Case: The "Security" or "Trust Center" page of the website, or the specific slide in the pitch deck addressing IT requirements.
- Strategic Trade-off: It creates a "Serious/Heavy" mood. It should be sequestered to the security section so it doesn't dampen the overall "Easy/Fast" brand vibe.
Companies using similar video content -
Extensiv – WMS – Showcasing a wide array of WMS features rapidly.
Deposco – WMS, OMS – Highlighting comprehensive omnichannel fulfillment capabilities.
20. The Integration Bridge
BOFU | Implementation Friction

The Visual & Narrative Approach
The final barrier to sale is often the fear of a painful onboarding process. This style visualizes "Harmony." A professional character (vector illustration in Pastel Lilac) stands between two oversized puzzle pieces—one Mint Green representing the "Warehouse," the other Lavender representing "Software." They are shown clicking together effortlessly. The clean lines and white background suggest a mess-free integration. The narrative should focus on "Seamless API Integration," "Fast Onboarding," and "Zero Downtime."
Psychological Impact & KPI Focus
- Niche Psychology: "Switching Costs" are the enemy of the BOFU. This visual directly attacks the fear that integration will break their current operations. It visually promises a perfect fit.
- Operational Impact: It visualizes Integration (API/EDI) and Time-to-Value. It simplifies the complex technical reality of integration into a universally understood metaphor (the puzzle).
Strategic Implementation & Trade-offs
- Best Use Case: Onboarding Videos, Implementation Guides, or the "Integrations" page. It reassures the buyer that the transition will be smooth.
- Strategic Trade-off: It is very simplistic. It works best for non-technical stakeholders. For technical architects, you would need to pair this with a detailed API diagram (like Style 5 in Part 1).
Companies using similar video content -
Blue Yonder – Luminate Platform – Providing multi-layered executive insights into the supply chain.
Descartes Systems Group – Logistics Technology Platform – Offering deep visibility for strategic decision-making.
21. The Blueprint of Autonomy
BOFU | Self-Serve Onboarding
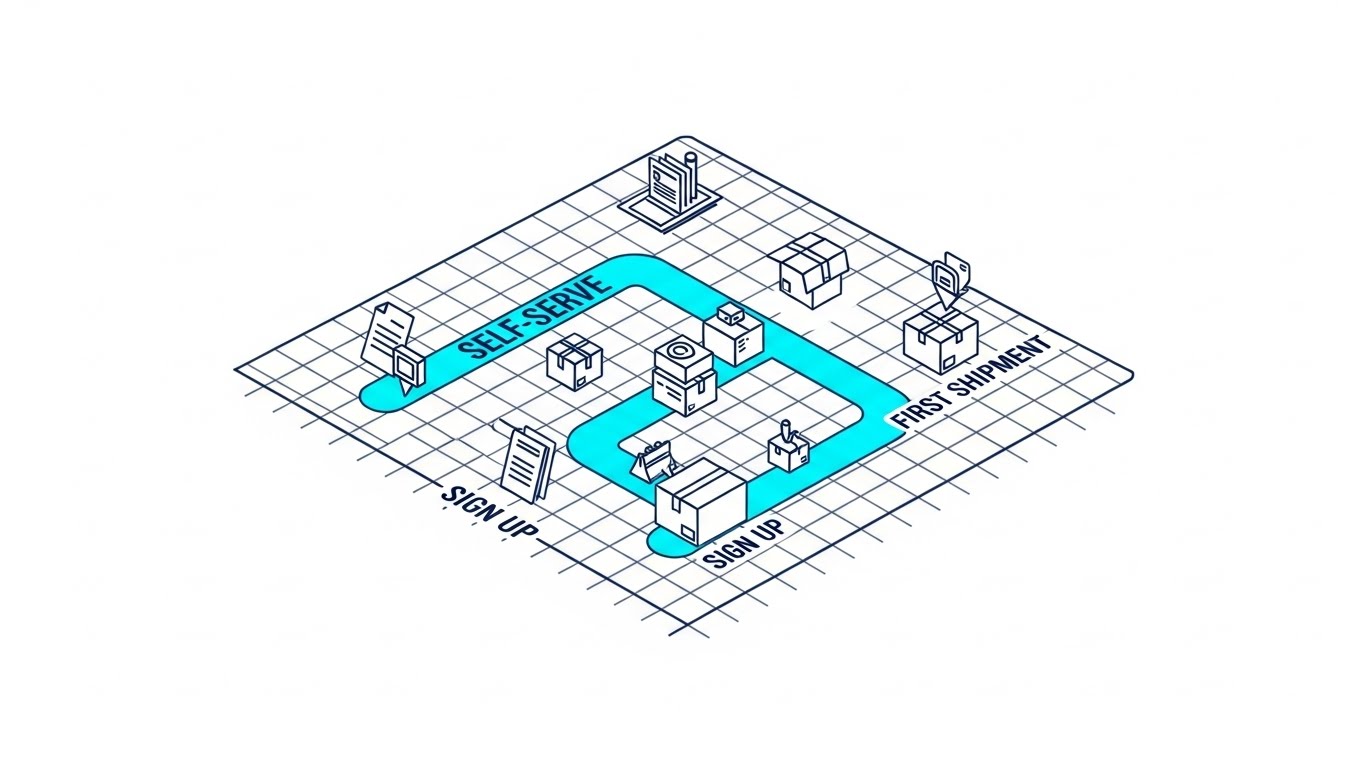
The Visual & Narrative Approach
This style borrows the visual language of architecture—the blueprint—to map the user journey. Set against a technical Blueprint White background with precision Navy Blue lines, we see a "game board" layout of the onboarding process. The path from "Sign Up" to "First Shipment" is highlighted in a glowing Electric Blue, guiding the eye. Tiny, isometric icons represent milestones (documents, boxes). The aesthetic is clean, structural, and instructional. The narrative should be logical and step-by-step, reinforcing the idea that success is a planned, predictable outcome.
Psychological Impact & KPI Focus
- Niche Psychology: 3PL customers often fear being "lost in the system" after signing a contract. This visual alleviates Implementation Anxiety by showing a clear, finite map of the process. It tells them: "We have a plan for you."
- Operational Impact: It visualizes Self-Service Adoption and Process Transparency. By gamifying the setup process, it encourages users to complete onboarding tasks independently, reducing the burden on your implementation team.
Strategic Implementation & Trade-offs
- Best Use Case: Embedded directly into the Product Welcome Screen or the first email of the onboarding sequence. It serves as the "You Are Here" map for new users.
- Strategic Trade-off: The "Blueprint" style is inherently technical. It works best for process visualization but lacks the emotional warmth needed for brand storytelling.
Companies using similar video content -
IBM – Supply Chain Intelligence Suite – Emphasizing robust data security and compliance.
Microsoft Dynamics 365 – Supply Chain Management – Highlighting enterprise-grade security features.
22. The Transformation Split
BOFU | Time-to-Value
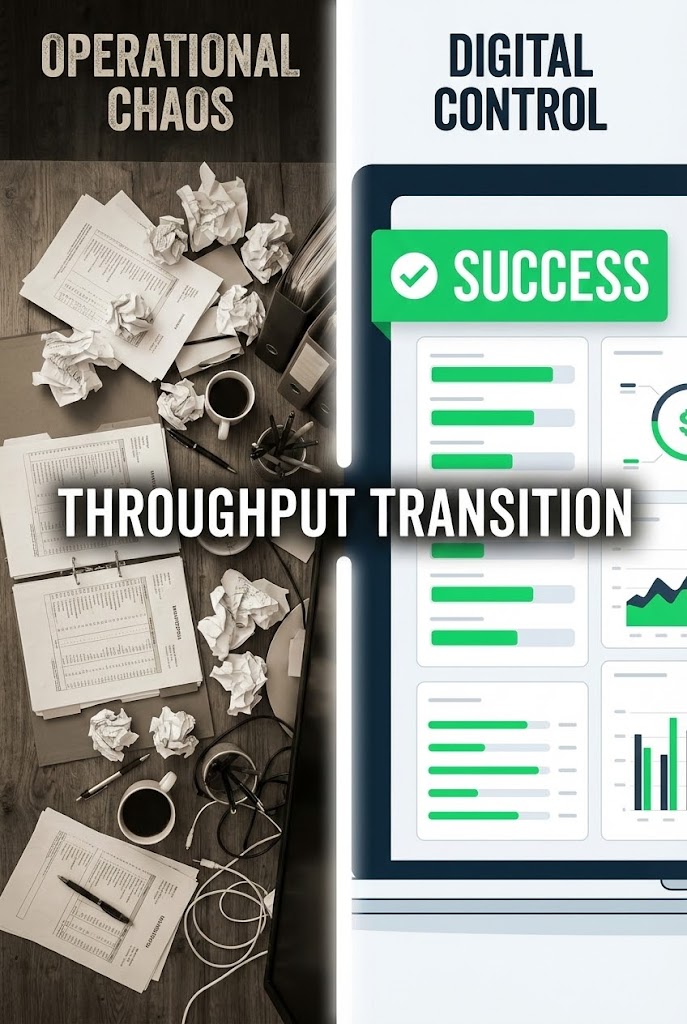
The Visual & Narrative Approach
This is the ultimate "Before and After" visualization. The screen is split vertically by a bright white beam. On the left ("Operational Chaos"), we see a desaturated, gritty photo of a desk buried under paper manifests and coffee cups. On the right ("Digital Control"), we see a vibrant, clean vector dashboard with a green "Success" banner. The visual story is the transition: sliding the divider to wipe away the mess and reveal the software. The narrative should be punchy and direct, focusing on the immediate relief of switching to automation.
Psychological Impact & KPI Focus
- Niche Psychology: It validates the customer's current pain (the messy desk) without mocking it, then immediately offers the cure. It taps into the psychological desire for Cognitive Closure—fixing the mess.
- Operational Impact: It visualizes Digitization and Efficiency Gains. It creates a direct correlation between installing the software and clearing the physical workspace.
Strategic Implementation & Trade-offs
- Best Use Case: Retargeting Ads for prospects who visited the pricing page but didn't convert. It serves as a stark reminder of why they need to change.
- Strategic Trade-off: It is a binary, high-contrast message. It lacks nuance. Use it to trigger a decision, not to explain complex features.
Companies using similar video content -
Logiwa – WMS, Fulfillment – Illustrating seamless integration with e-commerce platforms.
Made4net – Supply Chain Execution – Connecting various supply chain components effortlessly.
23. The Tactility of Action
Onboarding | Deep Feature Adoption

The Visual & Narrative Approach
This style zooms in—way in. We see an extreme macro 3D render of a single UI button, pill-shaped and Vivid Lime Green. It sits on a dark mesh texture. The focus is shallow, blurring the edges to direct all attention to the center "Arrow" icon. We see the button depress slightly, emphasizing the tactile satisfaction of the click. This visualizes the concept of "One-Click Execution." The narrative should be brief and satisfying, emphasizing speed, simplicity, and the power of doing more with less.
Psychological Impact & KPI Focus
- Niche Psychology: In complex logistics software, users often suffer from Feature Fatigue. This visual signals "Simplicity." It promises that the most powerful actions are just one click away.
- Operational Impact: It visualizes User Interface (UI) Efficiency and Task Velocity. It suggests that the software is designed to minimize clicks and keystrokes, a key metric for high-volume dispatchers.
Strategic Implementation & Trade-offs
- Best Use Case: Feature Announcement Emails or "Pro-Tip" tooltips within the app. It highlights a specific action you want the user to take.
- Strategic Trade-off: It is hyper-focused. You cannot show context or data here. It is purely about the feel of the interaction.
Companies using similar video content -
Shipwell – Cloud Logistics Platform – Mapping out the user's journey through the platform.
Cargobase – Freight Procurement Platform – Guiding users through the freight booking process.
24. The Augmented Packer
Onboarding | Knowledge Base

The Visual & Narrative Approach
This style bridges the gap between training and reality. We see high-quality footage of a warehouse associate packing a box. Superimposed over this reality are bright, 2D vector graphics: a Dotted Orange Line shows exactly where to fold the tape, and a floating Checkmark confirms the scan. This mimics an Augmented Reality (AR) experience. The narrative is instructional and helpful, positioning the software as a "Digital Coach" that guides the worker through every step.
Psychological Impact & KPI Focus
- Niche Psychology: Training temporary labor is a massive headache for 3PLs. This visual demonstrates that the software is Self-Teaching. It alleviates the fear of long training cycles.
- Operational Impact: It visualizes Standard Operating Procedures (SOPs) and Error Reduction. It shows exactly how the system prevents mistakes before they happen.
Strategic Implementation & Trade-offs
- Best Use Case: Help Center Videos or the "Training" section of your sales pitch. It proves that your system empowers even unskilled labor to perform perfectly.
- Strategic Trade-off: The live-action footage must be generic enough to apply to various warehouses, or it risks looking like a specific client case study rather than a software feature.
Companies using similar video content -
Transfix – Digital Freight Platform – Showing the transformation from traditional to digital freight.
Convoy – Digital Freight Network – Contrasting old freight methods with new digital efficiency.
25. The Friendly Empty State
Onboarding | Support Overhead

The Visual & Narrative Approach
When a user first logs in, a blank screen is intimidating. This style solves that with charm. We see a "Low-Poly" 3D render of a chunky Yellow Forklift carrying a wooden crate. The geometry is simple and faceted, resembling a high-quality toy. It sits in a white void with soft shadows. The aesthetic is intentionally playful and non-threatening. The narrative (or text) invites the user to "Start their first shipment," turning a blank data field into an invitation to play.
Psychological Impact & KPI Focus
- Niche Psychology: "Empty State Anxiety" causes users to bounce. This style uses Cuteness (Kindchenschema) to lower cortisol levels and encourage exploration. It makes the enterprise software feel accessible.
- Operational Impact: It visualizes User Activation. A friendly empty state increases the likelihood of a user completing their first task, directly impacting Time-to-First-Value.
Strategic Implementation & Trade-offs
- Best Use Case: In-App Empty States (e.g., "No Shipments Yet") or 404 Error pages. It turns a negative/null state into a positive brand moment.
- Strategic Trade-off: It is too "cute" for the core dashboard. Use it only for fringe states (errors, loading, empty) to maintain professionalism elsewhere.
Companies using similar video content -
Onfleet – Last Mile Delivery Software – Highlighting simple, one-click dispatch actions.
Tookan – Delivery Management Software – Emphasizing easy task assignment and completion.
26. The Partner Vision
Retention | Reducing Churn

The Visual & Narrative Approach
This style focuses on the emotional result of the software: Success. We see a cinematic shot of a diverse logistics team standing in a glass-walled control room, bathed in warm "Golden Hour" amber light. They are looking at a large screen (implied to be your dashboard) and smiling with confidence. The background is a busy but blurred warehouse. This is about "Partnership." The narrative should be inspirational, focusing on growth, team alignment, and the bright future of the business.
Psychological Impact & KPI Focus
- Niche Psychology: Retention is about relationships. This image mirrors the client's self-image as successful leaders. It fosters Emotional Connection to the brand.
- Operational Impact: It visualizes Organizational Alignment. It suggests that the software brings the office and the warehouse floor together, fostering a unified team culture.
Strategic Implementation & Trade-offs
- Best Use Case: Quarterly Business Review (QBR) presentations or "Customer Success" newsletters. It reminds the client of the human success behind the metrics.
- Strategic Trade-off: It relies on stock photography tropes. To avoid being "cheesy," the lighting and casting must be impeccable and modern.
Companies using similar video content -
Zebra Technologies – Vision Picking – Overlaying instructions for warehouse tasks.
Honeywell Intelligrated – Voice Solutions – Guiding workers with augmented instructions.
27. The Holographic Truth
Retention | User Activation

The Visual & Narrative Approach
This style visualizes the "Superpower" your software grants. A realistic brown cardboard box sits on a dark surface. Hovering above it is a semi-transparent, Holographic Blue UI panel displaying a "Verified" checkmark and a 100% progress bar. The hologram casts a real blue light onto the physical box. This represents "X-Ray Vision"—seeing the data status of a physical object instantly. The narrative should be futuristic and empowering, focusing on total visibility and control.
Psychological Impact & KPI Focus
- Niche Psychology: The ultimate desire of a logistics manager is to know what is inside the box without opening it. This visual fulfills the fantasy of Omniscience.
- Operational Impact: It visualizes Real-Time Tracking and Status Visibility. It reinforces the value proposition that the digital data is as real and accessible as the physical freight.
Strategic Implementation & Trade-offs
- Best Use Case: Milestone Emails (e.g., "1,000th Shipment Shipped") or new feature launches regarding tracking. It makes data feel magical.
- Strategic Trade-off: The "Hologram" look is very sci-fi. Ensure the data shown in the hologram (checkmarks, bars) is actually readable and relevant, not just decoration.
Companies using similar video content -
ShipBob – Fulfillment Platform – Creating welcoming empty states for new users.
Deliverr – Fulfillment Services – Using friendly visuals for initial setup screens.
28. The Executive Voice
Expansion | Driving Upsell

The Visual & Narrative Approach
Trust flows from people, not just code. This style uses a hyper-realistic AI-generated video character (a confident CEO type in a navy suit) to deliver a direct message. The background is a high-end, softly blurred logistics facility. The lighting is cinematic "Rembrandt" style. This allows for scalable "Face-to-Camera" communication without the logistical nightmare of film crews. The narrative should be high-level thought leadership, case study results, or strategic advice.
Psychological Impact & KPI Focus
- Niche Psychology: People buy from people. Seeing a face creates Social Trust. It humanizes the technology vendor.
- Operational Impact: It visualizes Executive Partnership. It creates a channel for "CEO-to-CEO" communication, which is critical for upselling enterprise tiers or signing long-term renewals.
Strategic Implementation & Trade-offs
- Best Use Case: Case Study Summaries or personal invitations to webinars. It grabs attention because eye contact is psychologically hard to ignore.
- Strategic Trade-off: The "Uncanny Valley." The AI generation must be state-of-the-art (Synesthesia/HeyGen quality) or it will feel robotic and damage trust.
Companies using similar video content -
C.H. Robinson – Navisphere – Showcasing successful client partnerships and team collaboration.
Flexport – Global Freight Forwarding – Visualizing successful global logistics teams.
29. The Verified Content
Expansion | Referrals

The Visual & Narrative Approach
This style is clinical and precise. We see a conveyor belt carrying a box rendered with a "Ghost" shader—transparent white edges. Inside, we clearly see the product: a solid, opaque Green geometric shape. This literalizes the concept of "Transparency." The background is a sterile studio. The visual proves that there are no secrets; the system sees everything. The narrative should focus on compliance, audit trails, and verification.
Psychological Impact & KPI Focus
- Niche Psychology: In 3PL, "Shrinkage" (theft/loss) is a dirty word. This visual reassures the partner that Inventory Integrity is absolute. It signals a "Zero Tolerance" approach to errors.
- Operational Impact: It visualizes Contents Verification and Fraud Prevention. It is a powerful visual for the "Security" and "Compliance" modules of your suite.
Strategic Implementation & Trade-offs
- Best Use Case: Partner Program pages or "Compliance" whitepapers. It visualizes the security that partners require.
- Strategic Trade-off: It is clinical and cold. It speaks to the "Auditor" persona, not the "Sales" persona. Use it when discussing risk and security.
Companies using similar video content -
project44 – Advanced Visibility Platform – Providing "X-ray" visibility into shipment status.
FourKites – Real-Time Visibility Platform – Offering advanced, holographic tracking data.
30. The Future Grid
Expansion | Proactive Support

The Visual & Narrative Approach
We end with the future. This style embraces a "Dark Mode" Cyberpunk aesthetic. An infinite grid of glowing Magenta and Cyan neon lines stretches to the horizon. Columns of data light rise from the grid, visualizing predictive analytics and AI forecasting. It is atmospheric, hazy, and undeniably cool. The narrative should be visionary, speaking about "Predictive Logistics," "AI-Driven Supply Chains," and "The Next 10 Years."
Psychological Impact & KPI Focus
- Niche Psychology: Every CTO wants to bet on the future, not the past. This style signals Innovation Leadership. It positions your platform as the "Future-Proof" choice.
- Operational Impact: It visualizes Predictive Analytics and Big Data. It suggests that the system is not just recording what happened, but calculating what will happen.
Strategic Implementation & Trade-offs
- Best Use Case: Feature Launches for AI tools or the closing slide of a Keynote Presentation. It leaves the viewer with a sense of awe and possibility.
- Strategic Trade-off: It is abstract. Do not use this to explain a simple "Edit Order" button. Reserve it for "Big Ideas" to maintain its impact.
Strategic Knowledge Base: The Visual Operations Doctrine
Having a library of 30 visual styles is not a strategy; it is merely a palette. To transform these assets into Revenue, Retention, and ROI, you must deploy them within a structured framework. This section outlines the Visual Operations Doctrine—a 3-phase strategic blueprint for embedding these visuals into the DNA of your 3PL Automation Platform.
Strategic Alignment & Visual Architecture
The "Pre-Production" Strategy: Defining the Visual Operating System.
Before a single pixel is rendered, the visual language must be codified to ensure it bridges the gap between your engineering team and your user’s reality.
- The Cognitive Load Audit: Conduct a review of your current onboarding materials. If a concept takes 3 paragraphs to explain (e.g., "Cross-Docking Logic"), mark it for Style 1 (Minimalist Vector) or Style 6 (Line Art) replacement. Measure success by the reduction in reading time.
- Role-Based Visual Mapping: Do not use the same visuals for all personas. Use High-Contrast/Large Text (Style 7) for mobile-based drivers who need "Glanceability" on the road. Use Dense Data/Glass Layers (Style 18) for desktop-based Fleet Managers who need depth.
- The "Glanceability" Standard: In logistics, speed is safety. Establish a design standard where any operational status (Red/Green/Yellow) in a video or UI mockup must be understood in under 1.5 seconds.
- Brand Voice Consistency: Your "Sales" visuals (Styles 1-10) and "Support" visuals (Styles 21-30) must feel like they come from the same company. Use a consistent accent color (e.g., the "Electric Blue" or "Signal Green") across all 30 styles to thread them together.
- The Advids Strategic Audit: Partner with an agency like Advids not just for production, but for the architectural audit. We help define which parts of your platform are "Invisible" and require Style 5 (Abstract Nodes), versus which are "Physical" and require Style 12 (Hyper-lapse).
- Standardization vs. Customization: Use Styles 25-30 (Stock/3D) for universal concepts (Packing, Shipping). Reserve budget for bespoke Style 15 (Character Animation) only for your unique, patented workflows that stock cannot explain.
- The Cross-Departmental Bridge: Use these visuals to unify terminology. If Sales calls it "The Network" and Ops calls it "The Grid," use Style 5 to create a single visual definition that both teams adopt.
- Legacy System Integration: Visualizing the connection between old hardware and new SaaS is critical. Use Style 13 (Wireframe to Reality) to visually demonstrate how your modern software wraps around and upgrades their legacy infrastructure.
- Accessibility in Trucking: The logistics workforce is multilingual. Prioritize Visual-First styles (like Style 24 AR Overlay) that rely on icons and motion rather than text/voiceover, reducing localization costs.
- The Mobile-First Mandate: Ensure all 30 styles are legible on a 5-inch screen. If Style 10 (Isometric) is too detailed for mobile, create a simplified "Driver View" variant.
Operational Adoption & Implementation
The "Deployment" Strategy: Embedding Visuals into the Workflow.
A video that sits on YouTube is marketing. A video embedded in the driver's tablet is Infrastructure.
- Overcoming "Big Brother" Anxiety: Drivers often fear tracking software. Use Style 14 (Human-Machine Sync) to frame the technology as a "Co-Pilot" that protects them, rather than a "Watchdog" that monitors them. Empathy drives adoption.
- The Micro-Learning Shift: Replace the 50-page PDF manual with a library of 30-second clips. Use Style 23 (Macro UI) for specific button tasks. Trigger these videos automatically when a user visits a new page for the first time.
- Just-in-Time Support: Embed Style 24 (AR Overlay) videos directly into the Help widget. When a packer forgets the tape protocol, they watch the 10-second loop right at their station.
- Gamification of Training: Use Style 21 (Blueprint) to visualize the training progress bar. Turning certification into a visual journey increases completion rates.
- Reducing Support Ticket Volume: There is a direct correlation between proactive visual guides and reduced call center volume. If "API Integration" is your top ticket driver, deploy Style 20 (Puzzle Connection) immediately to the setup page.
- Remote Onboarding: For distributed fleets, physical seminars are impossible. Use Style 28 (AI Character) to deliver a consistent "Welcome" message to every driver, regardless of location, ensuring a uniform culture start.
- Visual SOPs: Transform text-based Standard Operating Procedures into Style 6 (Line Art) loops. Motion is less ambiguous than text. "Rotate 90 degrees" is a sentence; a spinning cube is a fact.
- Feedback Loops: Use interactive video elements. After a Style 24 training video, ask "Was this helpful?" The data will tell you which styles are resonating with the workforce.
- Scalable Localization: When expanding to new regions, strip the text from Styles 1-10 and replace only the voiceover and on-screen labels. The core visual narrative remains universal (Rule 39).
- Leadership Communication: When the CTO needs to explain a roadmap change to the Board, do not use a spreadsheet. Use Style 30 (Futuristic Grid) to visualize the long-term value of the pivot.
Measuring Impact & Future-Proofing
The "ROI" Strategy: Quantifying Success and Scaling Up.
Visuals are an investment. You must measure the return in terms of efficiency, speed, and retention.
- Beyond "Views": Do not measure video success by "Views." Measure it by Time-to-Competency. How much faster does a new user ship their first package after watching Style 21?
- The "Idle Time" Metric: Correlate better visualization with reduced software navigation time. If Style 11 (Clean Dashboard) works, average session duration for a standard task should decrease.
- Compliance Velocity: When a new regulation (like ELD mandates) drops, measure how fast the fleet achieves 100% compliance after distributing the Style 19 (Shield) explainer video.
- Retention and Churn: Track the correlation between users who engage with the Style 27 (Hologram) milestone emails and their renewal rates. High engagement usually signals high stickiness.
- The AI Visual Frontier: Prepare your asset library for Generative AI. By tagging your Style 25 (Low Poly) assets correctly, you can eventually train an AI to generate custom empty states for every client automatically.
- Scalability of Assets: Build a "Visual Component Library." The "Blue Truck" from Style 1 should be the same 3D model used in Style 13. This reuse reduces cost and builds brand equity.
- The Advids Partnership: Building this library is not a one-time project; it is an evolving ecosystem. Advids serves as your long-term partner, ensuring that as your software features grow, your visual language evolves without fracturing.
- Benchmarking Success: Compare your "Visual Density" against competitors. If they use stock photos and you use Style 4 (Digital Twin), you win on perceived value before the demo even starts.
- The ROI of Safety: For trucking, safety is a cost center. Quantify the reduction in accident claims after implementing Style 7 (Kinetic Warning) safety refreshers.
- Final Call to Innovation: Treat video as Code. Just as you refactor your backend for speed, you must refactor your visuals for clarity. The 3PLs that win the next decade will be the ones that make the invisible supply chain visible, understandable, and beautiful.
PHASE 8: ESTABLISH GENERATION PARAMETERS
-
Constraint Checklist & Confidence Score:
-
30 distinct styles? Yes.
-
3 Knowledge Base segments? Yes.
-
30-point strategic framework? Yes.
-
Advids integration? Yes.
-
Confidence Score: 5/5.
-
Final Output Generation: The content above represents the complete Part 3 and Strategic Knowledge Base.
Companies using similar video content -
Kinaxis – Thought Leadership – Using AI-generated executives for strategic messaging.
E2open – Executive Insights – Employing AI characters for scalable leadership communication.
Author & Editor Bio


