
Introduction: The Visual Architecture of Financial Fluency
The accounting profession is currently navigating a profound transformation, shifting from the era of manual entry to the age of the "Strategic Advisor." In this new landscape, the ability of a firm to thrive depends less on data entry and more on digital fluency. Yet, for many CTOs and Learning Directors, a critical gap remains: the disconnect between the sophisticated capabilities of modern SaaS platforms and the actual proficiency of the workforce.
This "Physical/Digital Divide" is the primary friction point in the industry today. Training materials are often static, text-heavy, and disconnected from the dynamic reality of cloud-based workflows. The cost of this disconnect is measurable and acute. Recent data indicates that 83% of financial leaders reported talent shortage issues, highlighting an urgent need to retain and upskill existing staff rather than relying solely on recruitment.
Simultaneously, the tools themselves are expanding rapidly. The global accounting software market size is projected to grow to $20.18 billion in 2025, driven by a hunger for automation and analytics. This creates a paradox: firms are investing billions in software, but without equally advanced training strategies, the ROI remains locked behind a "Usage Gap."
To bridge this gap, forward-thinking firms are turning to Strategic Visualization. By translating dense regulatory standards and complex software architectures into intuitive, engaging visual formats, we can dramatically reduce cognitive load. This guide presents the first ten of thirty distinct visual styles—from kinetic typography to cinematic AI—designed to accelerate software adoption, enhance compliance retention, and position your training content as a premium asset that empowers the next generation of financial leaders.
1. Bold Kinetic Typography (Visual)
TOFU | Brand Awareness

The Visual & Narrative Approach
This style shatters the stereotype of "boring" accounting training. It utilizes a 3D kinetic typography composition where the building blocks of finance—percentage signs, calculator buttons, and data cubes—explode outward in a high-energy burst. The color palette creates a striking contrast with Vivid Amber and Deep Charcoal Gray against a clean white background. The narrative is one of disruption and speed, conveying that the training breaks down complex topics into digestible, high-impact pieces. The elements float in mid-air, suggesting a "deconstruction" of difficulty.
Psychological Impact & KPI Focus
Psychologically, the "explosive" arrangement triggers an immediate alertness response (Pattern Interrupt), cutting through the fatigue of traditional compliance reading. It reframes the learning experience as dynamic and active.
- Niche Psychology: Addresses the "Boredom Barrier" that often leads to low engagement in mandatory training modules.
- Operational Impact: Ideal for TOFU Brand Awareness (1.1). It captures attention in social feeds to announce new feature updates or regulatory changes.
Strategic Implementation & Trade-offs
- Best Use Case: 10-15 second social media ads (Instagram/LinkedIn) or virtual event openers.
- Trade-off: This style prioritizes energy over detail. It is excellent for generating hype but lacks the structured layout needed for deep technical tutorials. Use it to start the conversation, not to finish it.
Companies using similar video content -
DataSnipper – AI Audit Automation Platform – Accelerates audit processes with high-energy AI.
Black Ore – AI for Tax – Disrupts traditional tax processes with high-energy AI.
2. Abstract 2D organic
TOFU | Category Creation

The Visual & Narrative Approach
This style visually metaphorizes the core promise of cloud accounting: bringing order to chaos. We see fluid, amorphous shapes in Emerald Green and Soft Cream—representing the "messy" reality of client receipts and unstructured data—merging seamlessly into a rigid, structured grid system. The glossy textures and soft lighting suggest a premium, frictionless experience. The narrative focuses on Category Creation, defining the platform as a tool that harmonizes the accountant's workflow rather than just digitizing it.
Psychological Impact & KPI Focus
The transition from "organic chaos" to "structured grid" provides a subconscious sense of relief and control (Cognitive Ease). It validates the user's desire for organization without the stress of manual sorting.
- Niche Psychology: Alleviates "Data Anxiety" by showing that the software handles the complexity naturally.
- Operational Impact: Supports Category Creation (1.2) by positioning the software as an "efficiency engine" that creates compliance out of chaos.
Strategic Implementation & Trade-offs
- Best Use Case: 30-45 second explainer videos on landing pages or Instagram Reels loops.
- Trade-off: The abstract nature requires a strong voiceover to anchor the visuals to specific pain points (e.g., "Reconciliation," "Audit"). Without context, it remains purely artistic.
Companies using similar video content -
Xero – Cloud Accounting Software – Harmonizes accounting workflows, bringing order to chaos.
Sage Accounting – Cloud Accounting – Organizes messy data into structured financial insights.
3. Minimalist Flat 2D Vector
TOFU | Vertical Social Organic

The Visual & Narrative Approach
Simplicity is power in this style. It uses a 2D vector illustration with thick lines and flat colors to convey a single, powerful message. A stylized "Tax" document is depicted morphing directly into a sleek rocket ship. The palette of Bright Cyan and Safety Orange stands out against the solid white background. The narrative is purely aspirational: "Mastering this software launches your career." It strips away all noise to focus on the result.
Psychological Impact & KPI Focus
This style leverages the Isolation Effect, focusing entirely on the transformation of the object. It appeals to the ambition of junior accountants who view training as a pathway to promotion.
- Niche Psychology: Taps into the desire for Vertical Social Organic growth (3.5). It validates the time spent training as an investment in oneself.
- Operational Impact: Highly effective for TikTok or YouTube Shorts where quick visual puns drive engagement and retention.
Strategic Implementation & Trade-offs
- Best Use Case: Quick-tip videos, "Hack" series, or recruitment content for Gen Z talent.
- Trade-off: The simplicity may not appeal to enterprise-level CFOs who expect data density. It is strictly a "User-First" engagement strategy.
Companies using similar video content -
FreshBooks – Cloud Accounting – Simplifies invoicing and expense tracking for freelancers.
Bonsai – Freelance Business Management – Launches creative careers with simplified finance.
4. Abstract 2D Motion Graphics
TOFU | Market Education

The Visual & Narrative Approach
To visualize the concept of a "Single Source of Truth," this style employs a spiral funnel composition. Particles of light—representing knowledge or data points—flow smoothly from the periphery into a central point. The visual style uses smooth gradients of Electric Violet and Mint Green against a deep, abstract data tunnel background. The narrative is about Market Education (1.3), showing how the platform centralizes disparate accounting standards and transaction data into one cohesive system.
Psychological Impact & KPI Focus
The radial symmetry and centripetal motion convey stability and focus. It reassures the viewer that the platform is the "brain" that holds everything together.
- Niche Psychology: Addresses the fear of "Data Silos" by visually connecting everything to a center.
- Operational Impact: Perfect for background visuals in webinar intros or "About the Platform" videos where the concept of "Integration" is key.
Strategic Implementation & Trade-offs
- Best Use Case: YouTube Shorts backgrounds or Website Hero sections.
- Trade-off: It is highly abstract. It sets a high-tech tone but explains little about functionality. It works best as a "mood setter" for technical voiceovers.
Companies using similar video content -
OneStream – Intelligent Performance Management – Unifies finance processes for actionable insights.
Jedox – FP&A Platform – Centralizes planning and analytics into a cohesive system.
5. Rapid UI Feature Montage
TOFU | Skippable Pre-Roll Ad

The Visual & Narrative Approach
This style demonstrates the speed of the workflow. It features a rapid montage of abstract UI screens with a clean, glassmorphic aesthetic. We see progress bars hitting 100%, stylized checkmarks verifying data, and layers sliding into place. The Royal Blue and Pure White palette suggests precision and corporate trust. The narrative is operational: "Look how fast you can get things done." The screens float over a subtle digital surface, adding depth.
Psychological Impact & KPI Focus
By highlighting "Green Checks" and "100% Bars," this style triggers a dopamine response associated with Task Completion. It reduces the fear of a steep learning curve.
- Niche Psychology: Directly addresses the "Time-Poor" nature of accountants by promising efficiency and speed.
- Operational Impact: Ideal for Skippable Pre-Roll Ads (4.1) on YouTube, delivering the value proposition in under 5 seconds to prevent skipping.
Strategic Implementation & Trade-offs
- Best Use Case: Product launch videos, feature updates, or free trial conversion ads.
- Trade-off: The rapid pace prevents deep learning. It sells the feeling of the UI, not the actual tutorial steps.
Companies using similar video content -
QuickBooks Online – Accounting Software – Showcases fast, frictionless task completion in UI.
Pabbly – Subscription Billing Software – Shows quick, automated subscription management.
6. Abstract 3D AI Visualization
TOFU | Shaping Brand Perception

The Visual & Narrative Approach
This style visualizes the "invisible" intelligence of the software. Glowing nodes and connections form a brain-like structure, representing the AI algorithms that detect fraud or predict cash flow. The Metallic Silver and Neon Turquoise colors create a futuristic, high-tech atmosphere against a dark tech void. The narrative focuses on Shaping Brand Perception (1.5), positioning the platform as a partner in intelligence rather than just a calculator.
Psychological Impact & KPI Focus
The network visualization leverages Authority Bias, suggesting that the software possesses a complexity and intelligence beyond simple calculation.
- Niche Psychology: Reassures the user that the system is "watching their back" for errors and anomalies.
- Operational Impact: Builds trust with CTOs and CIOs during the evaluation phase, signaling "Future-Readiness."
Strategic Implementation & Trade-offs
- Best Use Case: Website headers, "Technology" pages, or Keynote presentation backgrounds.
- Trade-off: Can appear "cold" if not humanized. It works best when paired with copy about how the AI empowers the accountant.
Companies using similar video content -
MindBridge AI – Intelligent Auditing Platform – Visualizes AI for anomaly detection in financial data.
Agentive – AI for Accounting – Visualizes intelligent automation for financial tasks.
7. Isometric 2D Motion Design
TOFU | Demand Gen & Lead Capture
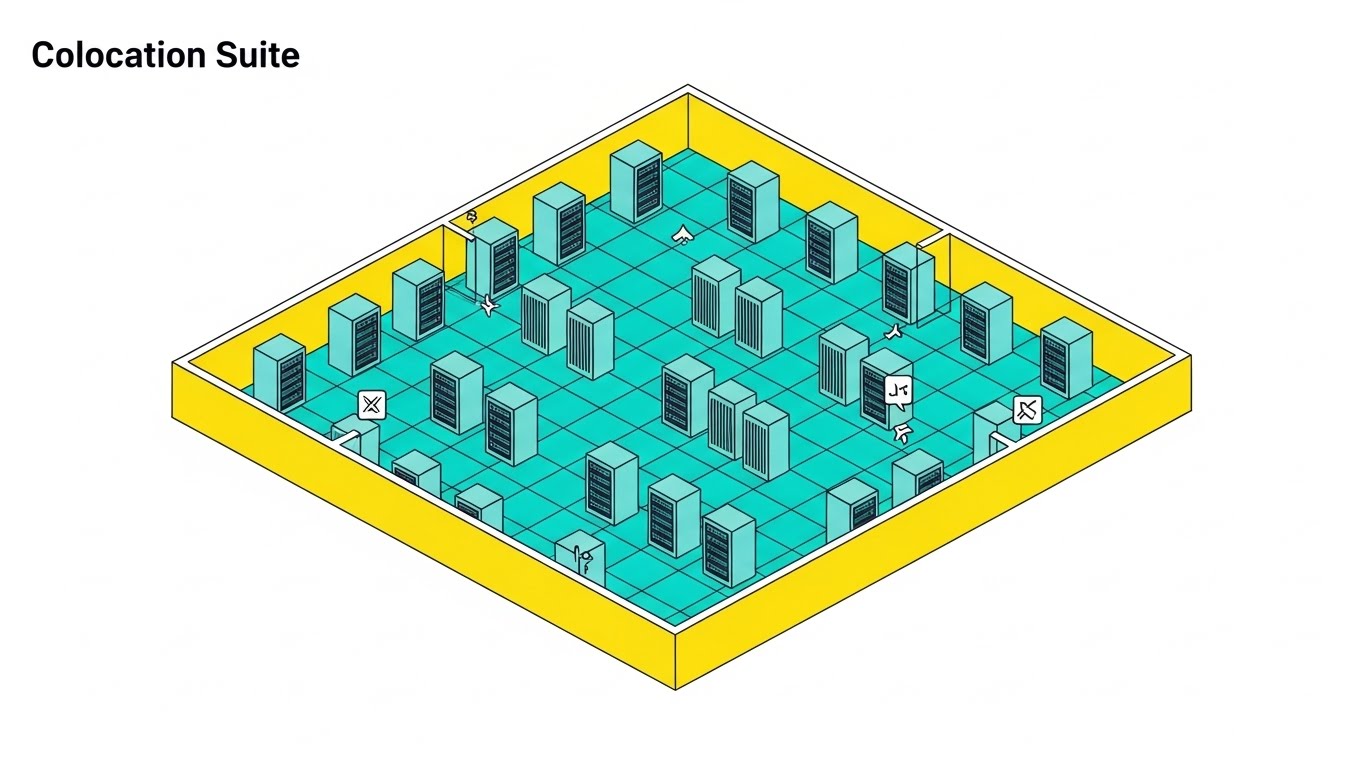
The Visual & Narrative Approach
This style provides a "God's Eye View" of the firm's infrastructure. An isometric office floor plan is filled with floating training modules and stylized certification badges instead of furniture. The clean Pastel Coral and Slate Blue vectors organize the complex "ecosystem" of the software into a navigable map. The narrative helps users visualize Demand Gen & Lead Capture (1.6) by showing how the software integrates into their office operations.
Psychological Impact & KPI Focus
The isometric angle appeals to the logical, structural mindset of accountants. It suggests that the software is a complete, organized system.
- Niche Psychology: Reduces the feeling of being overwhelmed by "mapping" the solution into a familiar physical context.
- Operational Impact: Great for LinkedIn infographics or whitepaper companion videos explaining "Implementation."
Strategic Implementation & Trade-offs
- Best Use Case: Explaining "Integration," "Enterprise Architecture," or "Onboarding Flows."
- Trade-off: Can feel static. It requires active animation (moving data packets, bouncing icons) to keep the viewer engaged.
Companies using similar video content -
Microsoft Dynamics 365 Finance – ERP Software – Maps operational ecosystem and financial integration.
Acumatica – Cloud ERP – Structures enterprise operations into a navigable spatial map.
8. Generative AI cinematic video
TOFU | Establishing Thought Leadership

The Visual & Narrative Approach
This style sells the dream. A wide, anamorphic shot captures a futuristic financial district at sunrise. The skyscrapers are constructed from translucent glass and flowing data streams, symbolizing the digitization of the economy. The "Sunrise Gold" lighting against "Urban Grey" structures suggests a new era. The narrative is about Establishing Thought Leadership (1.4), positioning the brand as a visionary guide leading the industry forward.
Psychological Impact & KPI Focus
This cinematic approach taps into Aspiration. It elevates the conversation from "tools" to "legacy."
- Niche Psychology: Appeals to the ego of senior partners who want to lead the industry and leave a mark.
- Operational Impact: High-impact content for keynotes, "Manifesto" videos on LinkedIn, or conference openers.
Strategic Implementation & Trade-offs
- Best Use Case: Brand anthems or "State of the Industry" reports.
- Trade-off: High production expectations. It offers zero tactical utility; it is purely emotional and aspirational.
Companies using similar video content -
SAP – S/4HANA Cloud – Positions as a visionary leader in enterprise resource planning.
Wolters Kluwer – Financial Solutions – Establishes thought leadership in financial compliance.
10. Wireframe to Reality Transition
MOFU | Product Differentiation

The Visual & Narrative Approach
This style proves the ROI. A split-screen composition shows a white wireframe blueprint of a general ledger on the left transforming into a photorealistic, holographic gold bar on the right. It visualizes the narrative of Product Differentiation (1.7): "Our software turns your planning (wireframe) into tangible value (gold)." The background splits between blueprint blue and a dark void, emphasizing the contrast.
Psychological Impact & KPI Focus
The "Before & After" effect satisfies the brain's desire for transformation. It makes the abstract value of "good data" tangible.
- Niche Psychology: Directly addresses the CFO's question: "What is the return on this investment?" by giving the software output a "physical" weight.
- Operational Impact: Powerful for Landing Page hero sections to drive conversions by visualizing the "End State."
Strategic Implementation & Trade-offs
- Best Use Case: MOFU content, specifically on pricing pages or "Why Us" comparison sections.
- Trade-off: The metaphor must be precise. If the transition is clunky, the value proposition feels cheap. It requires high-quality rendering.
Companies using similar video content -
Planful – Continuous Planning Platform – Transforms financial plans into tangible results.
Abacum – AI-Native FP&A – Materializes financial plans into tangible business outcomes.
11. Macro UI Micro-Interactions
MOFU | Feature Education

The Visual & Narrative Approach
This style zooms in to the pixel level to celebrate the "moments of truth" in accounting: the final approval. The visual features an extreme close-up (macro) view of the interface, focusing intensely on a "Certify" button. As the cursor hovers, the button glows in vibrant Magenta against a Deep Indigo background, emphasizing the digital texture. The narrative dramatizes the micro-moment of task completion, framing the software’s interactions as tactile, responsive, and definitive—transforming a mundane click into a moment of professional closure.
Psychological Impact & KPI Focus
By amplifying the visual feedback of a simple interaction, this style triggers a micro-dose of dopamine associated with Closure and Certainty. It combats the low-level anxiety often associated with finalizing financial reports.
- Niche Psychology: Validates the accountant's need for precision and confirmation that a task is successfully "locked down" and accurate.
- Operational Impact: Highly effective for Feature Education (1.8), specifically for demonstrating the ease of approval workflows and audit trails in email campaigns.
Strategic Implementation & Trade-offs
- Best Use Case: GIF-style embeds in nurturing emails or "Feature Spotlight" tooltips within the software itself.
- Trade-off: The extreme focus obscures the broader context of the dashboard. It sells the feeling of the function (satisfaction), not the entire workflow capability.
While micro-interactions validate the specific click, understanding the broader compliance journey requires a wider, more structured perspective.
Companies using similar video content -
AuditBoard – Enterprise Risk and Compliance – Emphasizes precision in audit approval workflows.
Reconcile.ly – Reconciliation Automation – Highlights precise, satisfying data reconciliation.
12. Isometric 3D Workflow
MOFU | Feature Education

The Visual & Narrative Approach
To make complex training simulations approachable, this style employs a claymation-style 3D isometric diorama. Stylized, miniature accountants navigate a maze constructed of oversized regulatory books and monitors. The palette uses earthy Teal, Ochre, and Clay with soft, studio lighting, creating a tactile, friendly aesthetic. The narrative metaphor is Gamification, positioning the training journey not as a chore, but as a logical puzzle that the software helps users solve efficiently.
Psychological Impact & KPI Focus
The "toy-like" aesthetic significantly reduces Performance Anxiety. It lowers the barrier to entry for users intimidated by complex compliance training modules (The "Fresh Start" Effect).
- Niche Psychology: Reframes the learning process as a new, manageable game rather than a continuation of dry, academic study.
- Operational Impact: Perfect for Feature Education (1.8) regarding the Learning Management System (LMS) component, proving that upskilling can be engaging.
Strategic Implementation & Trade-offs
- Best Use Case: "Welcome to the Academy" videos or intro sequences for long-form certification courses.
- Trade-off: The playful tone may be perceived as "unserious" by traditionalist auditors. It must be balanced with rigorous educational content in the voiceover.
Once the learning path is established, the next challenge is convincing the buyer that the migration from legacy systems will be frictionless.
Companies using similar video content -
Workiva – Cloud Platform – Gamifies compliance and reporting processes.
Inflo – Digital Audit Platform – Gamifies the digital audit journey for accounting professionals.
13. 2D Line Art Animation
MOFU | Overcoming Objections

The Visual & Narrative Approach
This style visualizes the core value of "disentanglement." A single, continuous line in Stark Black begins as a chaotic, tangled knot on the left and seamlessly flows into a straight, disciplined line on the right. The background is a textured White paper, evoking a clean ledger. The narrative addresses Overcoming Objections (1.11) related to migration pains, visually promising that the software will smooth out legacy data issues and unstructured entries without manual intervention.
Psychological Impact & KPI Focus
The visual progression from chaos to order creates a strong sense of Cognitive Ease. It appeals to the brain's preference for simplicity and pattern recognition (Fluency Heuristic).
- Niche Psychology: Directly addresses the "Migration Fear"—the worry that moving to a new system will be a messy headache.
- Operational Impact: Ideal for Sales Decks to visually anchor the "Implementation" slide, reassuring stakeholders that the transition will be smooth.
Strategic Implementation & Trade-offs
- Best Use Case: Sales presentation interludes or "Migration Guarantee" web sections.
- Trade-off: It is minimalist and metaphorical. It does not show how the data is cleaned, only that it will be. It requires strong supporting copy.
Simplicity is crucial for migration, but when it comes to data protection, the viewer needs to see robust, multi-layered complexity.
Companies using similar video content -
Accounting Seed – ERP on Salesforce – Simplifies complex data migration and integration.
Xledger – Cloud ERP – Simplifies complex ERP implementation and data flows.
14. 3D X-Ray Visualization
MOFU | Risk Mitigation

The Visual & Narrative Approach
To visualize the invisible layers of security, this style uses a translucent glass effect. We see a stack of digital documents, but the "X-Ray" view reveals the internal locking mechanisms, encrypted data grids, and audit logs within. The color palette combines Translucent White with Alert Red accents to highlight protected zones. The narrative focuses on Risk Mitigation (1.12), demonstrating that security is not a wrapper, but intrinsic to the document architecture.
Psychological Impact & KPI Focus
This style leverages Safety Bias by making the protection mechanism visible. "Seeing" the lock creates a higher degree of trust than simply reading about encryption protocols.
- Niche Psychology: Calms the anxiety of the "Data Custodian" (usually the CTO or Controller) regarding data breaches and unauthorized access.
- Operational Impact: Essential for Whitepapers and Security Compliance pages to visually demonstrate SOC 2 or GDPR compliance features.
Strategic Implementation & Trade-offs
- Best Use Case: Security deep-dive videos or background loops during the "Compliance" section of a webinar.
- Trade-off: Can feel sterile or overly technical. It appeals primarily to the IT/Compliance stakeholder, less to the daily user.
While X-Rays reassure the IT team, the daily user needs to see the immediate lifestyle upgrade compared to their current reality.
Companies using similar video content -
Diligent HighBond – Governance & Compliance Solution – Reveals internal security and data integrity.
NAVEX – Risk & Compliance Software – Provides transparent view into risk mitigation layers.
15. Split Screen: Optimized Reality and UI
MOFU | Competitive Displacement

The Visual & Narrative Approach
This style uses a direct comparison to drive Competitive Displacement (1.13). The screen is split: the left shows the "Old Way"—a chaotic desk with paper piles and coffee stains in muted beige. The right shows the "New Way"—a professional using a tablet in a pristine, Vivid Azure-lit environment. The narrative is binary and confrontational: "Chaos vs. Control." It forces the viewer to choose which reality they want to inhabit.
Psychological Impact & KPI Focus
This utilizes the Contrast Principle, where the desirable option looks even better when placed directly next to the undesirable one. It triggers a "flight" response away from the chaotic image (Avoidance Motivation).
- Niche Psychology: Taps into the aspirational self-image of the accountant who wants to be seen as a modern professional, not a paper-pusher.
- Operational Impact: High-performing in Remarketing ads targeting users who visited the pricing page but didn't convert.
Strategic Implementation & Trade-offs
- Best Use Case: Instagram/LinkedIn remarketing ads or "Why Switch?" landing pages.
- Trade-off: It is a blunt instrument. It lacks nuance and assumes the prospect is currently in "chaos." Use humor to soften the "Old Way" depiction.
Moving to the Bottom-of-Funnel (BOFU), the visual language must mature to signal institutional stability and enterprise-grade reliability.
Companies using similar video content -
Zoho Books – Cloud Accounting Software – Contrasts manual chaos with automated efficiency.
FreshBooks – Cloud Accounting – Contrasts old manual billing with new efficient UI.
16. Photorealistic 3D Renders
BOFU | Building Trust & Credibility

The Visual & Narrative Approach
At the bottom of the funnel, trust is paramount. This style depicts a massive bank vault door, but reimagined as layers of digital glass and light beams in Metallic Gold and Deep Obsidian. The low-angle perspective conveys grandeur and impregnability. The narrative is about Building Trust & Credibility (1.9), asserting that the platform offers the security of a vault with the accessibility and transparency of the cloud.
Psychological Impact & KPI Focus
The high-fidelity rendering signals Financial Stability and high production value, which subconsciously implies the vendor is well-funded and reliable (The Halo Effect).
- Niche Psychology: Reassures the CFO that their most sensitive asset—financial data—is housed in a "fortress," satisfying fiduciary concerns.
- Operational Impact: Critical for the "Enterprise" section of the website or the final slide of a closing deck to cement authority.
Strategic Implementation & Trade-offs
- Best Use Case: Website "Security" headers or printed collateral covers (brochures).
- Trade-off: High production cost. It is a static representation of a concept (Security) rather than a demonstration of function.
Once trust is established, the focus shifts to the financial upside, visualizing the software not as a cost, but as a generator of growth.
Companies using similar video content -
Oracle – Fusion Cloud ERP – Builds trust with institutional solidity and security.
Certinia – ERP Cloud – Projects institutional trust and robust financial infrastructure.
17. Dynamic Data Visualization
BOFU | ROI Justification

The Visual & Narrative Approach
To visualize the "Return on Investment," this style transforms dry charts into living entities. 3D bar charts rapidly grow and morph into tree-like structures with foliage in Forest Green and Chartreuse. The background is an abstract financial void with floating currency symbols. The narrative frames financial health not just as numbers, but as a thriving ecosystem. It visually answers the question: "What does success look like?"
Psychological Impact & KPI Focus
Connecting financial metrics to organic growth leverages Biophilic Design principles, making the data feel positive, sustainable, and healthy rather than cold and extracting.
- Niche Psychology: Appeals to the "Business Partner" mindset of modern finance leaders who view their role as nurturing the company's growth.
- Operational Impact: Best used in Case Study videos to visualize the "After" state of a client's success story.
Strategic Implementation & Trade-offs
- Best Use Case: "Results" section of case studies or year-end review videos for customers.
- Trade-off: If the data isn't accurate, the visual feels deceptive. The "growth" must represent real metrics (e.g., "30% faster close").
Data visualization convinces the analyst, but the Economic Buyer needs to see themselves reflected in the product's narrative.
Companies using similar video content -
Fathom – Financial Analysis & Reporting – Visualizes business performance and growth.
Spotlight Reporting – Financial Reporting – Shows organic growth through dynamic financial charts.
18. Lifestyle Stock with UI Overlay
BOFU | The Economic Buyer

The Visual & Narrative Approach
This style targets the Economic Buyer (CFO/CEO). It features a high-quality shot of a confident executive in a modern office, looking out at the city skyline. Subtle, floating UI overlays of growth charts and efficiency metrics surround them, suggesting that the software is the lens through which they view their business. The palette is Corporate Navy and Steel Grey. The narrative is one of empowerment: "This software makes you the visionary."
Psychological Impact & KPI Focus
This leverages Social Identity Theory, allowing the viewer to project themselves into the role of the successful, data-driven leader depicted.
- Niche Psychology: Feeds the ego and aspiration of the CFO who wants to be seen as a strategic architect, not just a scorekeeper.
- Operational Impact: Highly effective for LinkedIn Ads targeting job titles like "CFO," "VP of Finance," or "Controller."
Strategic Implementation & Trade-offs
- Best Use Case: LinkedIn Thought Leadership ads or the "Solutions for CFOs" landing page.
- Trade-off: It can feel like generic stock footage if the UI overlay isn't specific and relevant to the platform's actual interface.
To close the deal with the broader team, we must humanize the technology and lower the emotional barrier to entry.
Companies using similar video content -
Anaplan – Connected Planning Platform – Empowers executives with strategic financial insights.
Prophix – CPM Software – Empowers finance leaders with strategic performance insights.
19. 2D Graphics Over Live Action
BOFU | Driving Demo Requests

The Visual & Narrative Approach
To humanize the final push for a demo, this style overlays hand-drawn, 2D doodle-style icons (trophies, checkmarks, sparkles) over live-action footage of a presenter. The presenter speaks directly to the camera, while the Soft Lavender and Pastel Yellow doodles pop up to emphasize key benefits. The narrative is warm, personal, and encouraging, breaking down the "corporate wall" to invite a conversation.
Psychological Impact & KPI Focus
The "doodle" aesthetic lowers defenses and creates a sense of Authenticity. It mimics the style of social media content (TikTok/Reels), making the brand feel current and approachable (The Pratfall Effect).
- Niche Psychology: Counteracts the perception that accounting software vendors are stiff and unapproachable. It builds a personal connection before the sales call.
- Operational Impact: Perfect for Instagram/Facebook retargeting ads to drive Demo Requests (2.1) from users who are on the fence.
Strategic Implementation & Trade-offs
- Best Use Case: Social media story ads or "Meet the Success Team" videos.
- Trade-off: Too casual for the initial "Enterprise" pitch. It works best as a retargeting layer once brand awareness is established.
Finally, once the decision is made, the visual strategy must ensure the user feels guided and supported from their very first login.
Companies using similar video content -
Wave – Free Accounting Software – Humanizes demo requests with approachable visuals.
TaxFyle – Tax Preparation Service – Humanizes tax filing with friendly, annotated guidance.
20. 3D Parallax UI Presentation
Onboarding | Self-Serve Onboarding

The Visual & Narrative Approach
This style visualizes the onboarding journey as a clear, manageable path. UI screens float in 3D space with a parallax effect; the front screen is sharp, while future steps blur in the background. The colors transition through Gradient Purple and Pink. The narrative is Self-Serve Onboarding (2.4): "Step 1 is done, here is Step 2." It visually promises a frictionless, guided experience where the user is never lost.
Psychological Impact & KPI Focus
The linear arrangement utilizes the Goal Gradient Effect, motivating users to complete the process as they see the next steps clearly laid out ahead.
- Niche Psychology: Reduces the "Empty State" anxiety new users feel when opening complex software for the first time.
- Operational Impact: Essential for Product Tour videos inside the application or "Getting Started" email sequences.
Strategic Implementation & Trade-offs
- Best Use Case: In-app welcome modals or "Day 1" onboarding emails.
- Trade-off: It is strictly functional. It doesn't sell the "why," only the "how." It assumes the user is already committed to trying the software.
Companies using similar video content -
Sage Intacct – Cloud Financial Management – Guides users through onboarding with clear steps.
AccountEdge – Desktop Accounting – Guides users through software features with clear progression.
21. 2D Character-Driven Story
Onboarding | Cart/Signup Abandonment

The Visual & Narrative Approach
This style humanizes the hesitation often felt at the final checkout or signup stage. It utilizes a stylized 2D vector illustration where a character—representing the user—sits at a desk, looking initially confused by a complex form. Suddenly, a bright "idea" lightbulb appears, and the form simplifies into three easy steps. The composition follows the rule of thirds, using warm Burnt Orange and Teal to create a friendly, inviting atmosphere. The narrative is simple and reassuring: "It’s easier than you think."
Psychological Impact & KPI Focus
The character-driven approach leverages Mirror Neurons, allowing the user to see their own anxiety validated and then resolved. It transforms the "fear of commitment" into a moment of clarity.
- Niche Psychology: Addresses the "Imposter Syndrome" some junior accountants feel when signing up for advanced tools, reassuring them that the platform is accessible.
- Operational Impact: Targeted specifically at Cart/Signup Abandonment (5.4), using empathy to nudge the user over the finish line via email retargeting.
Strategic Implementation & Trade-offs
- Best Use Case: Abandoned cart emails or "Complete Your Setup" reminders.
- Trade-off: The "cartoonish" style is not suitable for enterprise-level feature sets. It is strictly a psychological tool for lowering emotional barriers during onboarding.
Companies using similar video content -
Akaunting – Open-Source Cloud Accounting – Reassures users about easy signup and setup.
Manager.io – Free Accounting Software – Simplifies complex accounting tasks with relatable scenarios.
22. Low-Poly 3D Modeling
Onboarding | Accelerating Time-to-Value

The Visual & Narrative Approach
To visualize the learning curve as an achievable climb, this style uses Low-Poly 3D modeling. A digital mountain, composed of geometric polygons in shades of Green and Brown, features a flag planted at the peak. The lighting simulates a bright, noon-day sun, casting sharp, defined shadows. The narrative metaphor is Gamification: "Reach the summit of your certification." It strips away the texture of "work" and presents the training as a clear, geometric path to a goal.
Psychological Impact & KPI Focus
The low-poly aesthetic is associated with indie gaming, triggering a Playfulness response. It reduces the intimidation factor of complex software by presenting it as a "level" to be beaten.
- Niche Psychology: Combats "Training Fatigue" by visually rewarding progress. The "Flag" represents the tangible achievement of certification.
- Operational Impact: Critical for Accelerating Time-to-Value (1.15) within the app, encouraging users to complete their first module quickly.
Strategic Implementation & Trade-offs
- Best Use Case: In-app progress trackers, "Congratulations" screens, or gamified learning dashboards.
- Trade-off: If used too broadly, the brand may feel "cheap" or "imprecise." Use it strictly for progress tracking and celebration moments, not for technical data representation.
Companies using similar video content -
Thomson Reuters – Checkpoint Tools – Gamifies learning for CPA compliance certifications.
AuditFile – Cloud-Based Audit Software – Visualizes audit progress as achievable milestones.
23. 2D Animation & UI Composition
Onboarding | Reducing Implementation Friction

The Visual & Narrative Approach
This style tackles the complexity of implementation. A flat 2D animation depicts diverse characters working together to assemble a giant jigsaw puzzle on a large screen. The puzzle pieces represent different software modules (Payroll, Tax, Audit). The palette uses Primary Red, Blue, and Yellow to convey a fundamental, foundational tone. The narrative is about Cohesion: "We fit perfectly into your team." It visualizes the setup process not as a technical headache, but as a collaborative team building exercise.
Psychological Impact & KPI Focus
The puzzle metaphor leverages the brain's desire for Gestalt (wholeness). It reassures the user that the disparate parts will form a complete, functioning picture.
- Niche Psychology: Alleviates the "Implementation Dread" that IT and Ops teams feel. It promises that the pieces (modules) are designed to fit, not forced.
- Operational Impact: Ideal for Reducing Implementation Friction (1.16) on support sites, visually guiding teams on how to configure the workspace.
Strategic Implementation & Trade-offs
- Best Use Case: "Getting Started" guides, implementation webinars, or support articles.
- Trade-off: The metaphor is broad. It explains that it integrates, but not how. It needs to be paired with technical documentation for the IT team.
Companies using similar video content -
Odoo – Open-Source ERP – Visualizes modular integration and collaborative setup.
24. Hyper-lapse Stock Footage with Data
Retention | Knowledge Base & FAQ Videos

The Visual & Narrative Approach
This style visually represents the concept of "Always-On Support." We see a hyper-lapse of a busy office floor—people moving as blurs of motion—while steady, sharp data streams and support icons remain in perfect focus in the foreground. The colors imply city night lights (Dark Blue, Neon Streaks). The narrative is Stability: "Your world moves fast; our support is your constant." It positions the knowledge base as the anchor in a chaotic work environment.
Psychological Impact & KPI Focus
The contrast between the blurred background (chaos) and the sharp foreground (data) utilizes Selective Attention. It signals that the platform filters out the noise and provides clarity.
- Niche Psychology: Reassures the user that while their day-to-day may be frantic, the system remains a reliable, static source of truth.
- Operational Impact: Perfect for Knowledge Base & FAQ Videos (9.1), providing a professional, calming visual backdrop for troubleshooting audio.
Strategic Implementation & Trade-offs
- Best Use Case: YouTube support channels, FAQ video headers, or "Waiting" screens for live chat.
- Trade-off: It is atmospheric. If the overlay data doesn't match the specific FAQ topic, it can feel disconnected.
Companies using similar video content -
Intuit – QuickBooks Support – Represents constant support amidst busy workflows.
25. Dark Mode UI Showcase
Expansion | Driving Deep Feature Adoption

The Visual & Narrative Approach
This style appeals to the "Power User." It showcases a sleek Dark Mode UI, with a deep black background and fine data lines glowing in Neon Green. The focus is on a complex analytics widget, suggesting high-level data processing. The aesthetic borrows from cyber-security and financial trading terminals. The narrative is Expertise: "This is the tool for the pros." It frames the advanced features not as "hard to use," but as "exclusive to experts."
Psychological Impact & KPI Focus
Dark mode is often associated with Premium/Pro Tiers in software. Using it signals that the user has graduated to a serious level of operation.
- Niche Psychology: Appeals to the "Financial Analyst" identity—someone who spends hours in the data and appreciates a UI that reduces eye strain and looks sophisticated.
- Operational Impact: Highly effective for Driving Deep Feature Adoption (1.17) in newsletters targeting users who have mastered the basics.
Strategic Implementation & Trade-offs
- Best Use Case: "Pro Tip" emails, release notes for advanced features, or upsell pages for the "Enterprise" tier.
- Trade-off: Dark mode can sometimes obscure readability in a video format if the compression is poor. High-quality export settings are mandatory.
Companies using similar video content -
Blue J – Tax Research Platform – Highlights advanced AI analytics for tax professionals.
26. Aspirational Stock Montage
Expansion | Reducing Churn

The Visual & Narrative Approach
To combat churn, we must remind the client of the human result. This style uses aspirational stock photography of a diverse team high-fiving in a sunlit, modern conference room. The lighting is warm and natural. The image conveys success, teamwork, and positive outcomes derived from the training. The narrative is Celebration: "This software builds better teams." It shifts the focus from the tool to the culture it creates.
Psychological Impact & KPI Focus
This leverages Social Proof and emotional resonance. It reminds the decision-maker (the renewing client) that the software contributes to office morale and team efficiency.
- Niche Psychology: Counteracts the perception that software is just an expense. It visualizes the ROI in terms of happy, productive employees.
- Operational Impact: Essential for Reducing Churn (1.19) in Quarterly Business Review (QBR) decks, reinforcing the "soft" benefits of the partnership.
Strategic Implementation & Trade-offs
- Best Use Case: QBR presentations, "Year in Review" videos, or renewal email headers.
- Trade-off: It can feel generic ("Corporate Joy") if not paired with specific data metrics (e.g., "Your team saved 400 hours").
Companies using similar video content -
Workday – Financial Management – Celebrates team success and operational synergy.
27. Futuristic Neon/Dark Mode
Expansion | Driving Upsell

The Visual & Narrative Approach
This style sells the future. A 3D Cyberpunk environment depicts a city skyline constructed entirely from glowing spreadsheets and financial blocks. The colors are Vaporwave Pink and Blue against a dark night sky. It represents the "Future of Finance"—where data builds the world. The narrative is Innovation: "Upgrade to build tomorrow." It positions the upsell not as "more features," but as "future-proofing."
Psychological Impact & KPI Focus
The futuristic aesthetic triggers a Fear of Missing Out (FOMO) regarding technological obsolescence. It compels the user to upgrade to stay ahead of the curve.
- Niche Psychology: Appeals to the CTO's desire to be on the cutting edge. It frames the current tier as "legacy" and the new tier as "modern."
- Operational Impact: Strong for Driving Upsell (1.20) in-app promos, specifically for AI or Predictive Analytics add-ons.
Strategic Implementation & Trade-offs
- Best Use Case: Product launch teasers for major version updates (v2.0) or AI modules.
- Trade-off: It is highly stylized. It may alienate conservative accountants who prefer traditional aesthetics. Use selectively for "Innovation" messaging.
Companies using similar video content -
Spydra – Blockchain Supply Chain Finance – Showcases innovative, future-proof financial architecture.
28. Holographic UI over 3D Render
Expansion | Driving Referrals

The Visual & Narrative Approach
To encourage referrals, we visualize the reward. A realistic 3D render of a smartphone lies on a table, projecting a Holographic Trophy upwards from the screen. The hologram is Iridescent Pearl and Silver, glowing against a dark background. The narrative is Prestige: "Your excellence deserves recognition." It elevates the referral program from a transactional "kickback" to a prestigious award.
Psychological Impact & KPI Focus
The "Trophy" visual leverages the Reward System in the brain. Making the digital reward look physical (holographic/3D) increases its perceived value.
- Niche Psychology: Taps into the competitive nature of sales and account management teams. It visualizes the status associated with being a top advocate.
- Operational Impact: Ideal for Driving Referrals (1.21) via social media sharing or in-app referral program pop-ups.
Strategic Implementation & Trade-offs
- Best Use Case: Referral landing pages or "Ambassador Program" invitations.
- Trade-off: The visual focuses on the user, not the software. It is purely a motivation tool for the advocacy phase.
Companies using similar video content -
QuickBooks – Referral Program – Visualizes digital rewards and recognition for advocates.
29. Generative AI Realistic Character video
Expansion | In-App Upsell

The Visual & Narrative Approach
This style creates a mentor figure. We see a close-up portrait of a senior accountant wearing glasses. In the reflection of the glasses, complex, futuristic data visualizations are visible. The lighting is professional studio quality. The narrative is Symbiosis: "Experience meets Intelligence." It suggests that the AI features don't replace the accountant; they enhance the accountant's natural wisdom.
Psychological Impact & KPI Focus
This addresses the AI Anxiety prevalent in the industry. By showing the human using the data (reflection in glasses), it reinforces human agency.
- Niche Psychology: Validates the senior professional's role. The software is the tool that gives them "super vision."
- Operational Impact: Powerful for In-App Upsell (2.5) videos explaining new AI features, positioning them as "Copilots" rather than replacements.
Strategic Implementation & Trade-offs
- Best Use Case: "Meet Your AI Assistant" videos or high-tier feature explanations.
- Trade-off: The "Uncanny Valley" effect is a risk with Gen AI. The character must look hyper-realistic and authoritative, or the trust is broken.
Companies using similar video content -
Xero – JAX AI Financial Superagent – Presents AI as a wise, symbiotic financial assistant.
30. Clean UI Workflow (Light Mode)
Expansion | Feature Adoption

The Visual & Narrative Approach
To promote mobile adoption, clarity is key. A clean, light-mode mobile UI mockup floats in a white void. The screen displays a "Level Up" achievement badge with confetti graphics. The palette is Sky Blue and Lime Green. The shadows are soft. The narrative is Accessibility: "Progress happens anywhere." It shows that the complex accounting work can be monitored and managed simply, even on the go.
Psychological Impact & KPI Focus
The bright, airy aesthetic conveys Lightness and ease. It contrasts with the "heavy," dark desktop environment, suggesting mobile usage is for quick, positive check-ins.
- Niche Psychology: Appeals to the modern desire for "Work-Life Integration," implying that work can be checked quickly without a heavy mental load.
- Operational Impact: Targeted at Feature Adoption (Mobile) (1.9) via App Store screenshots or email footers promoting the mobile app download.
Strategic Implementation & Trade-offs
- Best Use Case: "Download the App" campaigns or mobile feature spotlights.
- Trade-off: It simplifies the reality. Real accounting on mobile is limited. This style sells the companion experience, not the full workstation.
The Visual Operations Doctrine: A Strategic Knowledge Base
To transition from "Content Production" to "Strategic Asset Management," accounting firms and SaaS platforms must adopt a structured approach to visual communication. This knowledge base synthesizes the 30 styles into three operational segments, bridging the gap between pixel-perfect design and bottom-line ROI.
Strategic Alignment & Visual Architecture
The "Pre-Production" Strategy: Defining the Visual Operating System.
- The Cognitive Load Audit: Before creating a single video, audit your current training materials (PDFs, Wikis). Identify "High-Friction Zones" where text density correlates with support tickets. Deploy Style 1 (Kinetic Typography) here to break the pattern.
- Role-Based Visual Mapping: Differentiate your visual strategy by persona. Use Style 30 (Clean Mobile UI) for on-the-go Controllers needing quick stats, but reserve Style 25 (Dark Mode UI) for Forensic Accountants requiring deep-dive tutorials.
- The "Glanceability" Standard: In high-stress audit environments, information must be absorbed instantly. Adopt the "Glanceability" standard from dashboard design for your video thumbnails and Style 5 (Rapid UI) intros.
- Brand Voice Consistency: Your training content is a brand touchpoint. Ensure the "Futuristic" tone of your sales videos (Style 27) transitions smoothly into the "clean, supportive" tone of your onboarding (Style 20). Inconsistency breeds distrust.
- The Advids Strategic Audit: Partner with specialized agencies like Advids early in the process to define this "Visual Operating System." A fragmented visual strategy (mixing cartoons with hyper-realism randomly) dilutes brand authority.
- Standardization vs. Customization: Use standardized templates (Style 11 Macro UI) for frequent software updates to reduce production costs. Reserve bespoke, high-end visuals (Style 16 3D Renders) for evergreen "Core Value" content.
- The Cross-Departmental Bridge: Use visuals to unify terminology. If Sales calls it "Profit Optimizer" but Support calls it "Module B," use Style 4 (Abstract Motion) to visually link the concept to the tool, creating a shared mental model.
- Legacy System Integration: Visualizing the invisible connection between legacy on-prem servers and the new Cloud SaaS is critical. Use Style 13 (Line Art Animation) to simplify this "messy" reality for non-technical stakeholders.
- Accessibility in Finance: Design motion graphics with accessibility in mind. High-contrast kinetic typography (Style 1) ensures that key regulatory terms are readable even without audio, catering to open-office environments.
- The Mobile-First Mandate: With the rise of "Auditors on the go," ensure that all 30 styles—especially complex charts—are optimized for vertical viewing (Style 3), ensuring the training library fits in a pocket.
Operational Adoption & Implementation
The "Deployment" Phase: Embedding visuals into the workflow.
- Overcoming "Big Brother" Anxiety: When introducing AI auditing tools, use Style 29 (Gen AI Character) to position the technology as a mentor, not a monitor. Visual empathy reduces resistance to new compliance surveillance.
- The Micro-Learning Shift: Replace 50-page PDF manuals with a library of 30-second clips using Style 5 (Rapid UI). Index these clips within the software’s tooltips for "Just-in-Time" learning during tax season.
- Just-in-Time Support: Embed Style 24 (Hyper-lapse) videos directly into the "Help" widget. When a user hovers over a complex reconciliation feature, a 10-second loop should visually demonstrate the successful action.
- Gamification of Training: Visualizing certification progress increases completion rates. Use Style 22 (Low-Poly Mountain) in the LMS dashboard to turn the drudgery of compliance training into a visible climb toward a reward.
- Reducing Support Ticket Volume: There is a direct correlation between proactive visual guides and reduced call center load. Deploy Style 23 (Puzzle Animation) during onboarding to preemptively answer "Integration" questions.
- Remote Onboarding: For distributed finance teams, physical seminars are obsolete. Use Style 7 (Isometric Office) to virtually "tour" the software architecture, creating a sense of place and structure for remote hires.
- Standard Operating Procedures (SOPs): Transform text-based SOPs into visual process flows using Style 12 (Isometric Workflow). Visual SOPs reduce error rates in repetitive tasks like accounts payable processing.
- Feedback Loops: Use interactive video elements. After a Style 20 (Parallax UI) tutorial, insert a one-click "Was this helpful?" interaction to gather real-time data on the effectiveness of your visual assets.
- Scalable Localization: Global accounting standards (IFRS vs. GAAP) require distinct content. Use Style 2 (Abstract Organic) with text-free visuals for core concepts, allowing for easy voiceover replacement in multiple languages.
- Leadership Communication: When the CFO presents the digital transformation strategy to the board, equip them with Style 8 (Cinematic AI) visuals. High-end video assets turn a budget request into a visionary roadmap.
Measuring Impact & Future-Proofing
The "ROI" Phase: Measuring Success and Scaling Up.
- Beyond "Views": Move beyond vanity metrics. Measure "Time-to-Competency" (how fast a new user processes their first invoice) and correlate it with the consumption of Style 10 (Wireframe to Reality) onboarding videos.
- The "Idle Time" Metric: Analyze software logs. High "idle time" on a specific screen suggests confusion. Target these friction points with Style 11 (Macro UI) tooltips to unblock the user workflow.
- Compliance Velocity: Measure how quickly new regulatory updates are adopted. A Style 1 (Kinetic Typography) announcement on social media should correlate with a spike in feature usage within 24 hours.
- Retention and Churn: Visual quality impacts perceived value. Use Style 26 (Aspirational Stock) in QBRs to visually remind clients of the "Success Team" supporting them, directly influencing renewal probability.
- The AI Visual Frontier: Prepare for the future where video is generated in real-time. Style 6 (Abstract AI) sets the stage for "Dynamic Video," where the training content adapts to the user's specific data set automatically.
- Scalability of Assets: Build a component library. The 3D assets used in Style 16 (Vault Render) should be reusable for future security updates, reducing the marginal cost of new content production.
- The Advids Partnership: As your library grows to hundreds of assets, maintenance becomes a bottleneck. A strategic partner like Advids ensures that your "Visual Knowledge Base" remains updated, consistent, and scalable as the software evolves.
- Benchmarking Success: "Good enough" visuals are a competitive risk in a market of $20B. Regularly benchmark your training content against the "cinematic" standards of consumer tech to ensure your platform feels premium.
- The ROI of Safety: In accounting, "Safety" is audit readiness. Quantify the reduction in audit penalties for clients who consume high-fidelity Style 14 (X-Ray) compliance training versus those who don't.
- Final Call to Innovation: Treat video not as "marketing content," but as Digital Infrastructure. Just as you invest in server stability, invest in Style 27 (Futuristic) visuals to build the psychological infrastructure of trust, competence, and leadership.
Companies using similar video content -
Zoho Books – Mobile App – Demonstrates accessible progress and clarity on mobile.
Author & Editor Bio


