
Introduction: Bridging the "Mud to Cloud" Divide
In the high-stakes world of modern agribusiness, data is as critical as the soil itself. Yet, a profound disconnect remains between the physical reality of the farm—mud, diesel, and unpredictable weather—and the pristine digital environments designed to manage them. For SaaS founders and marketing directors, the challenge is not just capturing data; it is visualizing it in a way that builds immediate trust with a skeptical, pragmatic audience.
The opportunity for high-quality visualization is immense. The global digital agriculture market size is estimated at USD 25.24 billion in 2025, signaling a massive rush toward modernization. However, adoption remains a critical hurdle. Farmers often view new platforms with healthy skepticism, fearing "vaporware" that fails in the field. To win, your visual communication must be instant and indisputable. Research confirms that precision agriculture technologies are projected to increase crop yields by up to 20%, but this value is lost if the user cannot "see" the efficiency.
This guide acts as a strategic framework for Agricultural ERP and SaaS platforms to communicate that value. By moving beyond generic stock footage and embracing specific, expert-curated styles, you can demonstrate to investors and farm managers alike that your solution doesn't just display data—it masters it. From "Digital Twins" that overlay neon analytics on real soil to "Kinetic Typography" that builds the logic of your ecosystem, these 30 visual examples define the new gold standard for AgTech communication.
1. Bold Kinetic Typography
TOFU | Brand Awareness

The Visual & Narrative Approach
This style abandons traditional imagery to focus purely on the energy of construction. Massive, block-like shapes—constructed from abstract geometric elements like leaves and gears—slam together in a rhythmic, percussion-driven sequence. These aren't just shapes; they represent the foundational modules of an ERP (Finance, Operations, HR) interlocking to form a solid, immovable structure. The motion is aggressive and upward, utilizing a high-contrast Vivid Lime Green and Electric White palette against Deep Charcoal.
Psychological Impact & KPI Focus
- Niche Psychology: Agribusiness owners respect durability and structure. This style leverages "Cognitive Ease" by simplifying a complex software ecosystem into tangible, building-block metaphors. It signals that the platform is a solid foundation for their business.
- Operational Impact: Directly addresses Ad Recall Lift. It creates a "pattern interrupt" in social feeds, stopping the scroll with high-contrast visuals that promise stability and integration without needing to read complex charts.
Strategic Implementation & Trade-offs
- Best Use: 15-second social ads (LinkedIn/Instagram) for product launches.
- Trade-off: It conveys power, not process. It builds the feeling of the brand but explains none of the function.
Companies using similar video content -
SAP Agriculture – SAP S/4HANA – Enterprise ERP for large-scale operations.
Oracle NetSuite – NetSuite ERP – Cloud ERP for comprehensive agribusiness management.
2. Abstract 2D Motion Graphics
TOFU | Market Education

The Visual & Narrative Approach
The screen begins in a state of beautiful but overwhelming clutter—thousands of Cyan, Magenta, and Yellow particles swirling unpredictably, representing the raw, unstructured data of a farm. As the video progresses, an invisible magnetic force pulls these particles into a rigid, serene grid structure. The chaotic noise transforms into a harmonious melody. The narrative arc is simple: "From Entropy to Order."
Psychological Impact & KPI Focus
- Niche Psychology: The primary anxiety of the target persona is "Data Overload." They are drowning in spreadsheets. This visual provides a "Psychological Salve" by visualizing the relief of organization. It promises that the software will tame the chaos.
- Operational Impact: Targets Market Education. It explains the value of an ERP (centralization) without getting bogged down in UI screenshots.
Strategic Implementation & Trade-offs
- Best Use: YouTube Explainer Intros (0:00 - 0:30).
- Trade-off: It is highly metaphorical. Skeptical audiences (the "muddy boots" crowd) may find it too abstract if not immediately followed by a shot of the actual interface.
Companies using similar video content -
Agrivi – Agrivi Farm Management – Organizes farm data for efficient operations.
FarmERP – FarmERP Platform – Manages crops, weather, and financials.
3. AI Generated Mixed Media Video
TOFU | Shaping Brand Perception

The Visual & Narrative Approach
This style bridges the physical-digital divide. We see macro, high-texture footage of crumbled Earthen Brown soil—you can almost smell the earth. Slowly, a glowing, Digital Neon Blue grid rises out of the dirt, contouring perfectly to the uneven terrain. Nodes light up where seeds are planted. It visually defines the concept of the "Digital Twin"—showing that the digital data is an intrinsic layer of the farm.
Psychological Impact & KPI Focus
- Niche Psychology: This builds immense credibility. It tells the grower, "We understand that your business happens in the soil, not just in the cloud." It respects the physical reality of farming while elevating it with technology.
- Operational Impact: Drives Brand Perception. It positions the brand as sophisticated and grounded, bridging the gap between traditional agronomy and futuristic tech.
Strategic Implementation & Trade-offs
- Best Use: Instagram Reels / High-Impact Landing Page Heroes.
- Trade-off: High production difficulty. The tracking of the digital elements onto the physical footage must be flawless; otherwise, it looks fake and breaks trust.
Companies using similar video content -
Climate FieldView – Climate FieldView Platform – Hyper-local weather and agronomic insights.
Taranis – Taranis Platform – AI-driven precision agriculture intelligence.
4. Abstract 3D AI Visualization
TOFU | Category Creation

The Visual & Narrative Approach
A central, pulsating "Digital Brain" made of translucent Silver and Slate Gray glass hovers in a dark void. It is the hub. Radiating outwards are fiber-optic strands connecting to miniature, floating glass artifacts: a tractor, a silo, a drone. When the central brain glows Emerald Green, the signal travels instantly to the edges. This visualizes "Centralized Command & Control."
Psychological Impact & KPI Focus
- Niche Psychology: Corporate farms often suffer from siloed departments. This visual appeals to the "Control Freak" aspect of the persona (in a positive way). It visualizes total omniscience and interconnectedness.
- Operational Impact: Supports Category Creation. It frames the software not just as a tool, but as the infrastructure upon which the entire business runs.
Strategic Implementation & Trade-offs
- Best Use: Website Header Backgrounds.
- Trade-off: Can feel cold or overly "Enterprise." It lacks the human touch, so it should be paired with warm, benefit-driven copy.
Companies using similar video content -
IBM Corporation – IBM Food Trust – Blockchain for food supply chain transparency.
Hexagon AB – HxGN AgrOn – Geospatial solutions for agriculture.
5. 2D Graphics Over Live Action
TOFU | Vertical Social Organic
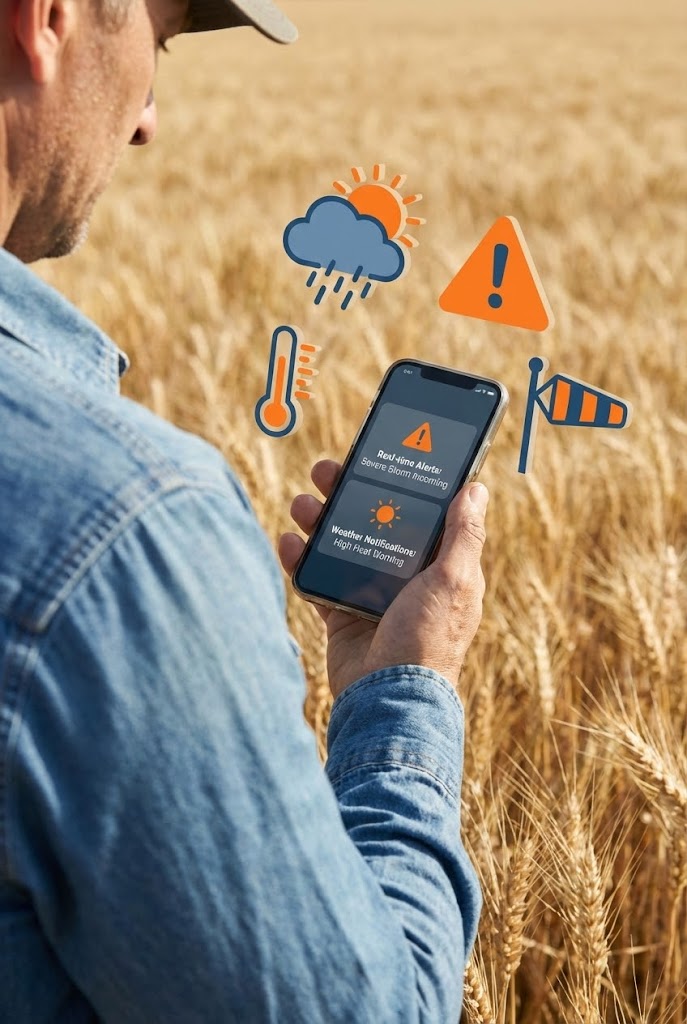
The Visual & Narrative Approach
We return to the human element. An over-the-shoulder shot of a farmer in a denim shirt, standing in a golden wheat field, looking at a smartphone. Suddenly, stylized 2D vector icons (Safety Orange warnings, Denim Blue weather clouds) pop out of the screen and float in the air above the crop. This Augmented Reality (AR) style visualizes the invisible data layer revealed by the software.
Psychological Impact & KPI Focus
- Niche Psychology: This addresses "Usability Anxiety." Farmers fear software that requires a desktop computer. This visual proves the solution is Mobile-First and useful at the point of action.
- Operational Impact: Perfect for Vertical Social (TikTok/Shorts). It is relatable, fast-paced, and explicitly demonstrates the "Field-to-Phone" value proposition.
Strategic Implementation & Trade-offs
- Best Use: Product Feature Highlights (Mobile App) on social media.
- Trade-off: The live-action footage must be authentic. If the farmer looks like a model, the audience will disconnect.
Companies using similar video content -
SafetyCulture – SafetyCulture Platform – Mobile inspections and issue flagging for farms.
Croptracker – Croptracker App – Manages fruit/vegetable harvest, packing, compliance.
6. Rapid UI Feature Montage
TOFU | Skippable Pre-Roll Ad
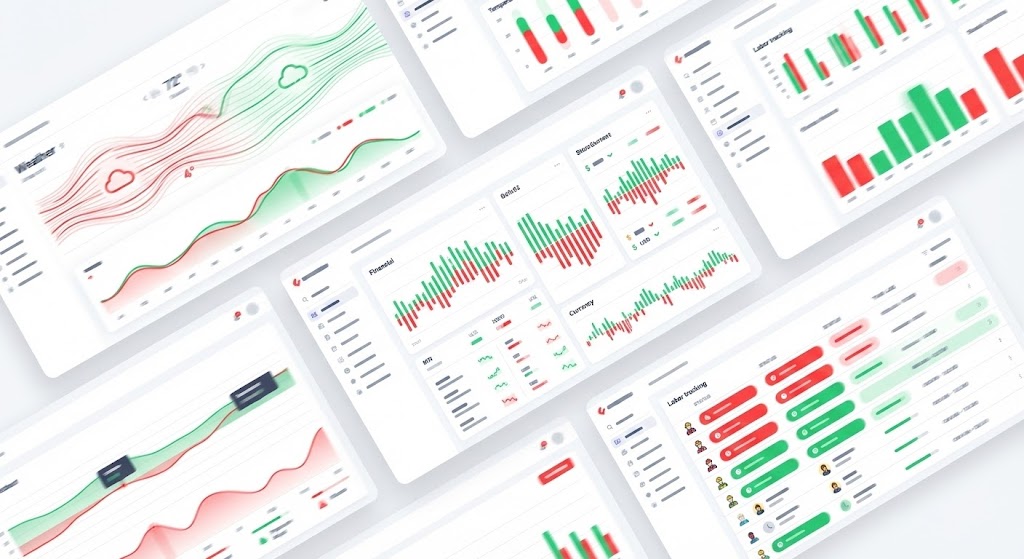
The Visual & Narrative Approach
Speed is the variable here. The camera zooms and pans aggressively across high-fidelity UI screens. We see flashes of Stark White dashboards with Alert Red variances and Success Green financial indicators. We don't read the text; we feel the volume of data being processed. It’s a "Feature Blitz" that creates an impression of comprehensive coverage.
Psychological Impact & KPI Focus
- Niche Psychology: Agribusinesses have complex requirements. This style uses "Data Density" to reassure the buyer that the platform is robust enough for enterprise-grade operations. It suggests, "We can handle your complexity."
- Operational Impact: Skippable Pre-Roll Ads. You have 5 seconds to capture attention; the density and motion keep the eye moving and establish value before the "Skip" button appears.
Strategic Implementation & Trade-offs
- Best Use: Retargeting Ads.
- Trade-off: Zero educational value. Do not use this to teach how to use a feature, only that the feature exists.
Companies using similar video content -
FarmBrite – Farmbrite Software – All-in-one farm management for efficiency.
Agvance – Agvance ERP – Connects accounting, agronomy, grain, energy.
7. Wireframe to Reality Transition
MOFU | Product/Solution Differentiation
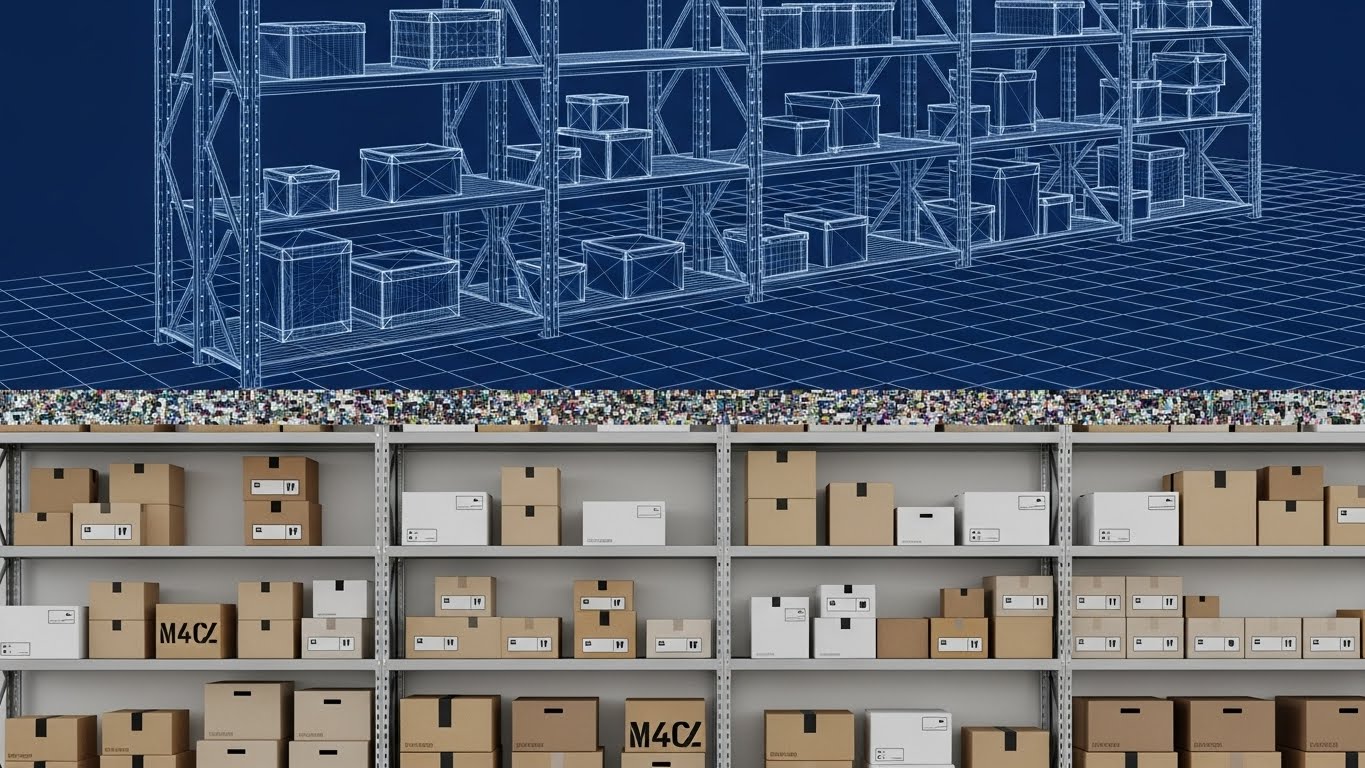
The Visual & Narrative Approach
A static or slow-moving split-screen. On the left, a Blueprint Blue wireframe of a tractor or shelf sits on grid paper. On the right, the exact same object in photorealistic, Real Red rendering. A sharp vertical line divides them. As the line wipes across, the blueprint becomes reality. This visualizes the concept of "Plan vs. Actual."
Psychological Impact & KPI Focus
- Niche Psychology: Operations managers are obsessed with the delta between what was planned and what happened. This style visually validates the software's ability to align engineering precision with the messy reality of the farm.
- Operational Impact: Product Differentiation. It positions the software as a tool for accuracy and fidelity, separating it from "guesstimation" tools.
Strategic Implementation & Trade-offs
- Best Use: LinkedIn Static Carousel or Slide.
- Trade-off: It is static or slow. It creates a moment of reflection, not excitement.
Companies using similar video content -
Trimble Ag Software – Trimble Ag Software – Integrates precision ag tools with field data.
AGCO Corporation – AGCO Connect – Connects farm machinery with data platforms.
8. Isometric 2D Motion Design
MOFU | Competitive Displacement

The Visual & Narrative Approach
A "God's Eye View" of the farm at a 45-degree angle. Initially, elements are scattered—trucks stuck in mud, silos overflowing. Then, the scene wipes to a "Post-Implementation" state: the farm is organized into a neat grid. Colors are soft Pastel Greens and Blues. The style is clean, shadowless, and clinical. It visualizes the "Before and After" of digital transformation.
Psychological Impact & KPI Focus
- Niche Psychology: This leverages the "Cleanliness Effect." Farming is dirty; software is clean. By stripping away the dirt and using vector art, we allow the viewer to focus purely on the process and flow of operations.
- Operational Impact: Competitive Displacement. It subtly suggests that the competitor's manual process is "messy," while your automated process is "clean."
Strategic Implementation & Trade-offs
- Best Use: Blog Post Headers / Whitepaper Illustrations.
- Trade-off: Can feel "cheap" if the illustration style is too generic.
Companies using similar video content -
xFarm – xFarm Platform – Streamlines agricultural operations with digital tools.
AgSquared – AgSquared Software – Plans, tracks, and manages farm operations.
9. Isometric 3D Workflow
MOFU | Driving Demo Requests
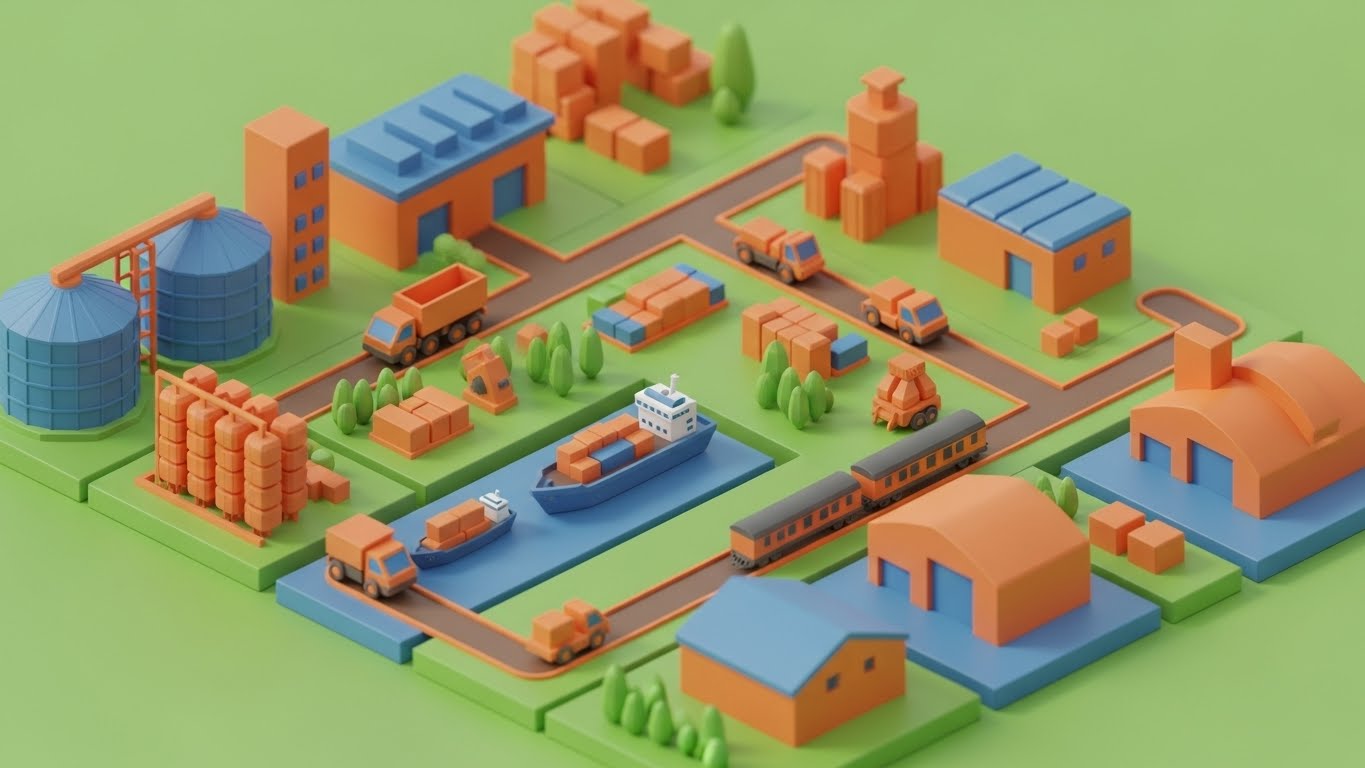
The Visual & Narrative Approach
Rendered in 3D "Claymorphism." The objects (trucks, ships, silos) look like high-end toys or game pieces moving on a global board. The lighting is soft and global. This style "Gamifies" the supply chain, making the terrifying complexity of global logistics look like a manageable, playable board game.
Psychological Impact & KPI Focus
- Niche Psychology: Supply chain managers deal with high stress. This visual style reduces Cognitive Load by presenting their job as a manageable system. It implies that the software gives them the power to move these assets around as easily as toy pieces.
- Operational Impact: Driving Demo Requests. It makes the software look "fun" and "easy" to use, lowering the barrier to entry for a trial.
Strategic Implementation & Trade-offs
- Best Use: Landing Page "How it Works" Sections.
- Trade-off: The "toys" must still look professional (e.g., correct tractor models) to avoid trivializing the industry.
Companies using similar video content -
SourceTrace Systems – SourceTrace ESE™ Agri – Mobile solutions for sustainable agriculture supply chains.
DeHaat – DeHaat Platform – AI-enabled supply chain and production solutions.
10. Dynamic Data Visualization
MOFU | Feature Education
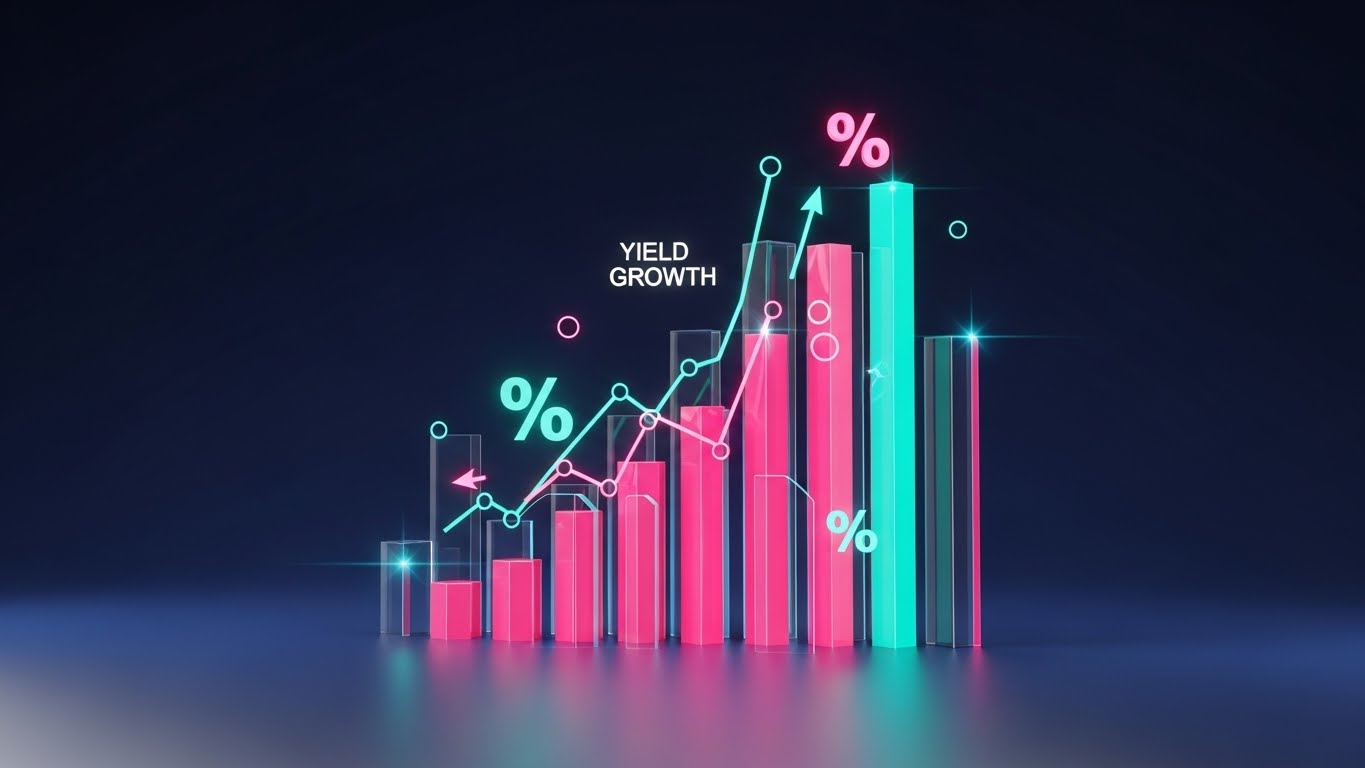
The Visual & Narrative Approach
This is the "Money Shot." Against a Deep Navy background, 3D glass bar charts in Neon Pink and Bright Teal rise from the floor like a futuristic city. They don't just appear; they grow, visualizing yield data over time. Percentage symbols and data nodes orbit the bars.
Psychological Impact & KPI Focus
- Niche Psychology: This speaks to the CFO and Investor persona. It focuses purely on the ROI—Yield, Profit, Growth. The sophisticated aesthetic mirrors the look of Fintech tools, signaling that this AgTech platform is financially rigorous.
- Operational Impact: Feature Education (Reporting). It demonstrates the quality of the reporting module—the part of the software the boss sees.
Strategic Implementation & Trade-offs
- Best Use: Investor Pitch Decks / End of Demo Videos.
- Trade-off: It is abstract. It shows the result of the data, not the source.
Companies using similar video content -
Granular – Granular Insights – Data-driven insights for farm profitability.
Farmers Edge Inc. – FarmCommand – Precision agriculture data science platform.
11. Clean UI Workflow (Light Mode)
MOFU | Feature Education
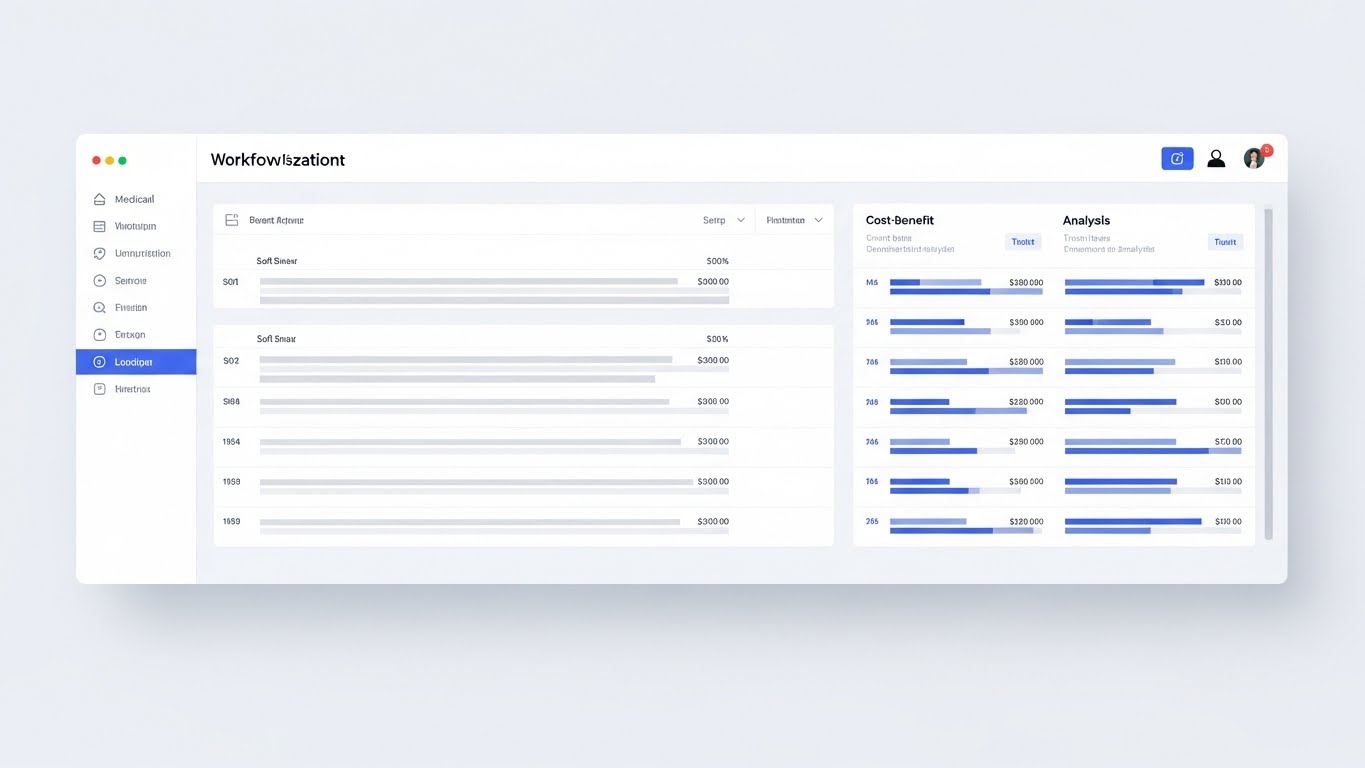
The Visual & Narrative Approach
We strip away the cinematic drama to focus on the absolute truth of the numbers. The aesthetic is "Medical White"—pristine, clinical, and distraction-free. The camera performs a slow, flat-lay pan over the interface. Typography is minimal; the focus is entirely on the Soft Grey financial ledgers and Trust Blue cost-benefit analysis columns. It visualizes the farm not as a biological entity, but as a balanced financial equation.
Psychological Impact & KPI Focus
- Niche Psychology: The CFO or Farm Owner is often terrified of the "financial black hole" of operations. This clinical style leverages "Processing Fluency." By presenting the data in a familiar, spreadsheet-like (but beautiful) format, it reassures the buyer that the platform handles complex agronomic accounting with banking-grade precision.
- Operational Impact: Targets Feature Education. It validates the software’s specific ability to handle Input Costs, Depreciation, and Compliance Reporting, moving the conversation from "Field" to "Finance."
Strategic Implementation & Trade-offs
- Best Use: Pricing Pages / "Office Mode" Feature Demos.
- Trade-off: It is emotionally dry. It builds confidence in competence but generates zero excitement. Use it only when the user is ready to talk numbers.
Companies using similar video content -
FarmRaise – FarmRaise Tracks – Effortless farm accounting and financial management.
Agrimaster – Agrimaster Software – Specialized farm financial management tool.
12. Minimalist Flat 2D Vector
MOFU | Feature Education
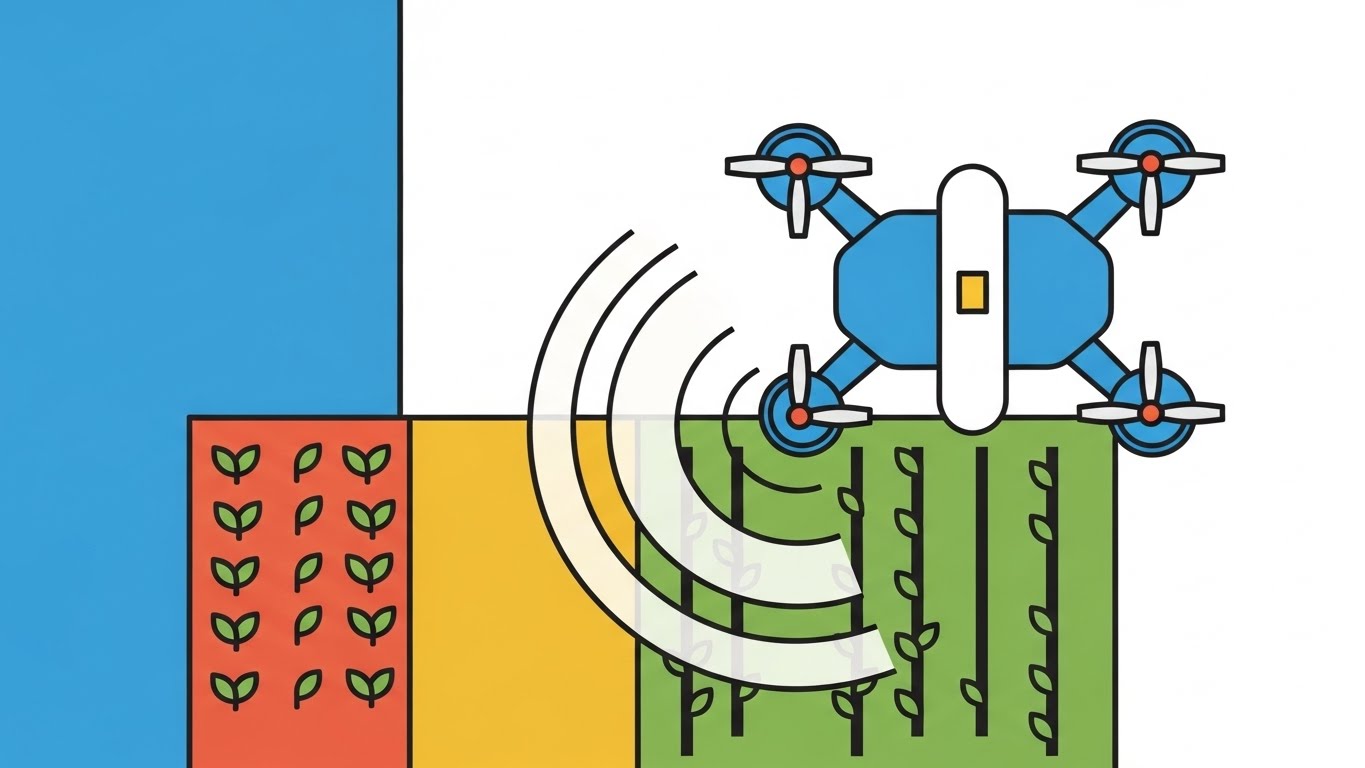
The Visual & Narrative Approach
This style abstracts the complexity of remote sensing into simple geometry. We see a top-down view of the farm rendered in iconographic blocks of Terracotta (soil) and Sage (crops). A thick monoline drone icon floats above, emitting a "scanning wave" of concentric Cream-colored circles. As the wave passes, the blocks toggle color, indicating "Analysis Complete." It is a visual shorthand for "We see everything."
Psychological Impact & KPI Focus
- Niche Psychology: Advanced technology like photogrammetry can feel overwhelming to implement. This style uses "Visual Reduction" to make the technology appear accessible and "Plug-and-Play." It tells the user that they don't need to be a GIS expert to benefit from aerial intelligence.
- Operational Impact: Perfect for Social Media Carousels. The bold, high-contrast shapes read clearly on small mobile screens, effectively explaining the concept of the integration without needing complex real-world footage.
Strategic Implementation & Trade-offs
- Best Use: Instagram/LinkedIn "How it Works" posts.
- Trade-off: Lacks nuance. It cannot demonstrate the actual fidelity of the data, only the process of collecting it.
Companies using similar video content -
PIX4Dfields – PIX4Dfields Software – Drone software for agriculture mapping and insights.
Drone Ag – Skippy Scout – Faster crop scouting by drone.
13. 2D Line Art Animation
MOFU | ROI Justification

The Visual & Narrative Approach
An exercise in elegance. A single, fluid line drawn in Gold Metallic ink travels across a textured White Paper background. The line never breaks. It begins by tracing the shape of a seedling, morphs fluidly into a mature stalk, then a gear, and finally resolves into a stylized Dollar Sign ($). It creates a seamless visual narrative: "Biology -> Operations -> Profit."
Psychological Impact & KPI Focus
- Niche Psychology: Agribusiness is a value chain. This style appeals to the Strategic Thinker who views the farm as a system of conversion. It visually reinforces the promise that the software eliminates friction, ensuring that every seed planted results in captured value.
- Operational Impact: ROI Justification. It is an ideal visual metaphor for Whitepapers or Executive Summaries, providing a sophisticated break from dense text while reinforcing the "Profitability" message.
Strategic Implementation & Trade-offs
- Best Use: Investor Pitch Decks / Annual Report Videos.
- Trade-off: Purely conceptual. It proves the philosophy of the software but demonstrates none of the functionality.
Companies using similar video content -
AgriOpenData – AgriOpenData Platform – Blockchain for traceability and certification.
Proagrica – Proagrica Solutions – Integrated network for agricultural insights.
14. Futuristic Neon/Dark Mode
MOFU | Risk Mitigation

The Visual & Narrative Approach
The scene shifts to a defensive stance. We look up at a towering digital shield constructed of glowing Laser Green energy grids. Behind it sits a dark server rack on a reflective floor, set against a deep Cyberpunk Purple void. "Attacks" (red pixels) hit the shield and are instantly neutralized. This is the visual language of cybersecurity, designed to communicate military-grade protection.
Psychological Impact & KPI Focus
- Niche Psychology: Data Sovereignty is a top-tier anxiety. Farmers fear that conglomerates will steal their yield data to manipulate prices. This visual provides a "Psychological Fortress." It reassures the IT Director or Owner that the platform is a vault, not a sieve.
- Operational Impact: Risk Mitigation. It visually answers the question, "Is my data safe?" without needing a technical lecture on encryption protocols.
Strategic Implementation & Trade-offs
- Best Use: "Security & Compliance" Landing Pages.
- Trade-off: Can look "scary." It emphasizes the threat to highlight the solution. It must be balanced with copy that is reassuring, not alarmist.
Companies using similar video content -
CS-VUE – CS-VUE Platform – Compliance software for agriculture and forestry.
KPA – KPA Flex – Agriculture safety management software.
15. Low-Poly 3D Modeling
MOFU | Building Trust

The Visual & Narrative Approach
We render the farm as a charming, miniature world. Faceted, blocky shapes in vibrant Polygon Purple, Orange, and Green depict tractors, sheep, and silos. The lighting is bright and sunny with sharp shadows. It looks like a high-end simulation game. By reducing the chaotic reality of the farm to a clean, geometric model, we make the entire operation feel manageable and contained.
Psychological Impact & KPI Focus
- Niche Psychology: This style counters "Implementation Overwhelm." An ERP implementation feels heavy; this visual feels light. By "Gamifying" the environment, we suggest that managing the farm via the software is as intuitive and organized as playing a game.
- Operational Impact: Building Trust. It disarms the user, making the brand feel approachable, modern, and easy to do business with.
Strategic Implementation & Trade-offs
- Best Use: Social Media (Facebook) / Onboarding Welcome Videos.
- Trade-off: It sacrifices realism. It is not suitable for showing specific crop details or agronomic precision (e.g., disease detection).
Companies using similar video content -
LiteFarm – LiteFarm Software – Free and open-source farm management.
Agricolus – Agricolus Platform – Precision farming platform for crop optimization.
16. Generative AI Realistic Character Video
BOFU | The Economic Buyer

The Visual & Narrative Approach
We leave the field and enter the boardroom. A professional man in his 50s with silver hair, wearing a suit, stands in a glass-walled office. He is looking intently at a tablet displaying complex abstract charts. The background is blurred in Cool Steel and Navy tones. He is not driving a tractor; he is steering the business. The visual language is "Fortune 500."
Psychological Impact & KPI Focus
- Niche Psychology: This targets "Authority Mirroring" for the Economic Buyer (CEO/Owner). They view themselves as businessmen first, farmers second. This visual validates that identity. It confirms that the software is a tool for high-level decision-making, not just operational data entry.
- Operational Impact: Closing the Deal. It visualizes the desired end-state of the buyer: calm, informed, strategic control over the enterprise.
Strategic Implementation & Trade-offs
- Best Use: LinkedIn Ads / Account-Based Marketing (ABM) for Enterprise.
- Trade-off: The "Uncanny Valley." AI characters must be flawless. If the eyes or hands look unnatural, it damages credibility.
Companies using similar video content -
FBN (Farmers Business Network) – FBN Platform – Data-driven insights and financial solutions.
Bayer AG – Climate Corporation – Digital farming solutions for decision-making.
17. Lifestyle Stock with UI Overlay
BOFU | The Functional Buyer
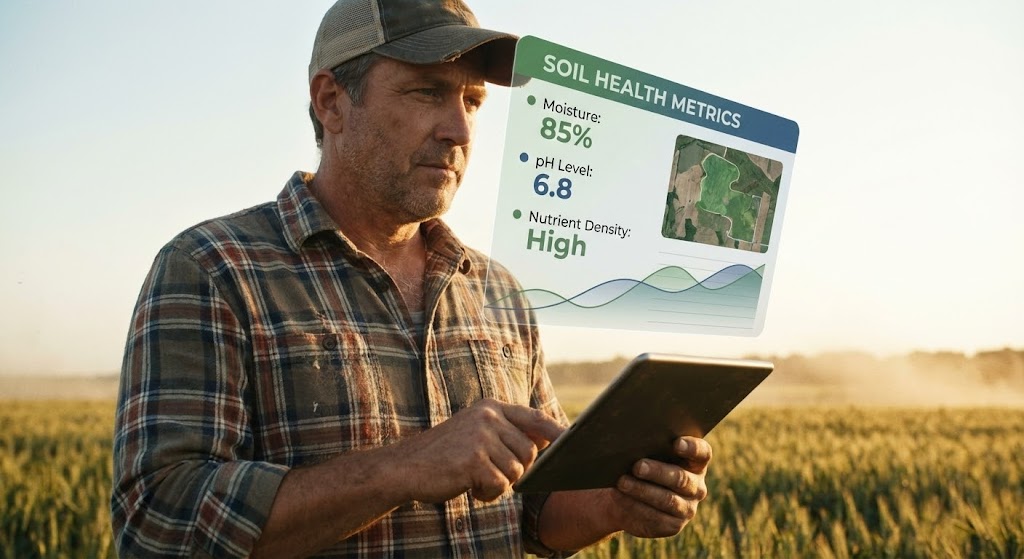
The Visual & Narrative Approach
A return to the soil. We use authentic cinematic footage of a farm manager in a plaid shirt and cap, standing in a wheat field during the Golden Hour. A semi-transparent UI element floats in the air, aligned with his line of sight. It displays "Soil Health Metrics" in Foliage Green and Denim Blue. The digital data is integrated seamlessly into the physical world.
Psychological Impact & KPI Focus
- Niche Psychology: The Functional Buyer (Farm Manager) worries that software will disconnect them from the land. This visual reassures them that the tool Augments their intuition rather than replacing it. It gives them "X-Ray Vision" to see what is happening beneath the soil.
- Operational Impact: User Activation. It demonstrates the practical, daily utility of the mobile app, encouraging adoption by field staff.
Strategic Implementation & Trade-offs
- Best Use: Website Hero Sections / Product Solution Pages.
- Trade-off: Authenticity is key. The model must look like a real farmer, and the UI tracking must be locked perfectly to the footage.
Companies using similar video content -
John Deere Operations Center – Operations Center – Digital backbone for farm management.
Fieldin – Fieldin Control Center – Smart farm control for specialty crops.
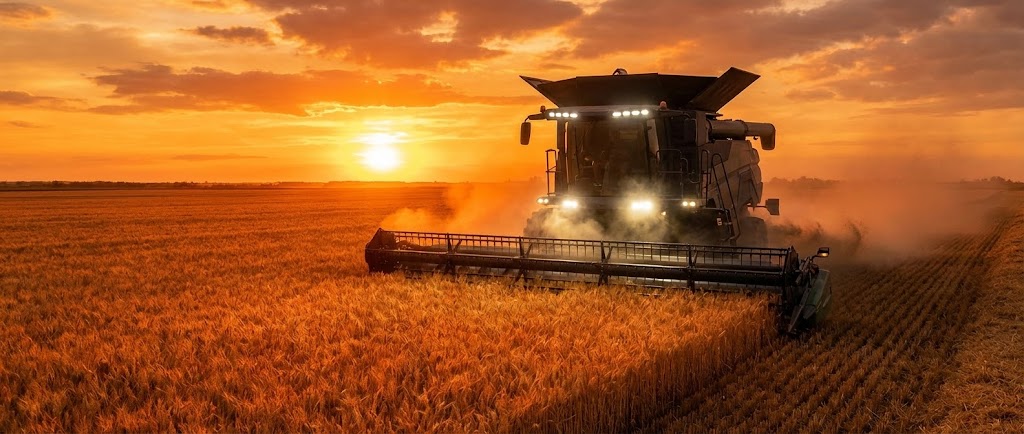
18. Generative AI Cinematic Video
BOFU | ABM Awareness
The Visual & Narrative Approach
This is pure, epic scale. A wide, panoramic shot shows a massive combine harvester cutting through a field at sunset. The lighting is dramatic, with warm Sunset Orange flares and deep Silhouette Blacks. Dust swirls in the machine's headlights. There is no text, no UI—just the raw power of industrial agriculture. It conveys dominance and capacity.
Psychological Impact & KPI Focus
- Niche Psychology: Large enterprise farms pride themselves on the sheer scale of their operations. This style taps into "Industrial Pride." It matches the scale of the software to the scale of their machinery, implicitly stating, "We are big enough to handle your operation."
- Operational Impact: Account-Based Marketing (ABM). It is designed to impress the Global 500 agribusinesses by mirroring their own high-budget branding.
Strategic Implementation & Trade-offs
- Best Use: Trade Show Booths / Premium Video Ads.
- Trade-off: It is purely atmospheric. It builds brand affinity but educates the user on zero features.
Companies using similar video content -
CNH Industrial N.V. – Case IH AFS Connect – Agricultural machinery and digital solutions.
Kubota Corporation – KubotaNOW – Agricultural machinery and connected services.
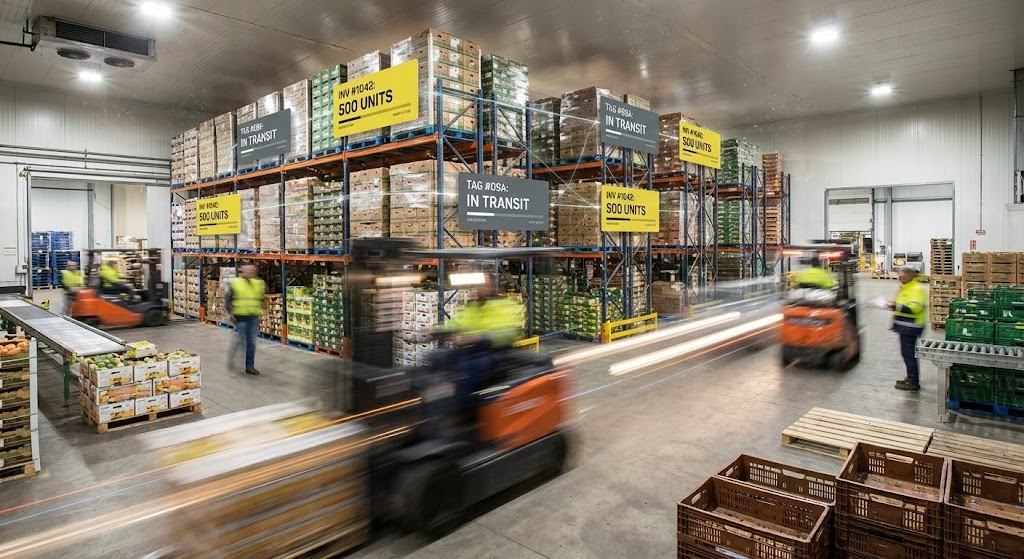
19. Hyper-lapse Stock Footage with Data
BOFU | Trial/Freemium User Activation
The Visual & Narrative Approach
We move to the warehouse. The camera is static, but the scene is a blur of hyper-lapse motion. Forklifts and workers zip by. Superimposed on this chaos are motion-tracked "Data Tags" in Hazard Yellow and Industrial Grey floating above the moving pallets, updating inventory counts in real-time. It visualizes the invisible digital thread tracking the physical speed of the supply chain.
Psychological Impact & KPI Focus
- Niche Psychology: Supply chain managers hate bottlenecks and "lost" inventory. This visual offers "Omniscience." It proves that the system captures data at the speed of reality, alleviating the fear of lag or data latency in high-throughput environments.
- Operational Impact: Trial Activation. It vividly demonstrates the value of the "Real-Time Inventory" module, encouraging users to sign up to gain this level of visibility.
Strategic Implementation & Trade-offs
- Best Use: YouTube Pre-Roll Ads / Logistics Feature Pages.
- Trade-off: Can be visually overwhelming. The data tags must be large and legible to be read against the busy background.
Companies using similar video content -
Plex Smart Manufacturing Platform – Plex MES – Cloud MES for food and beverage processing.
Infor CloudSuite Food & Beverage – Infor CloudSuite – ERP for manufacturing and processing.
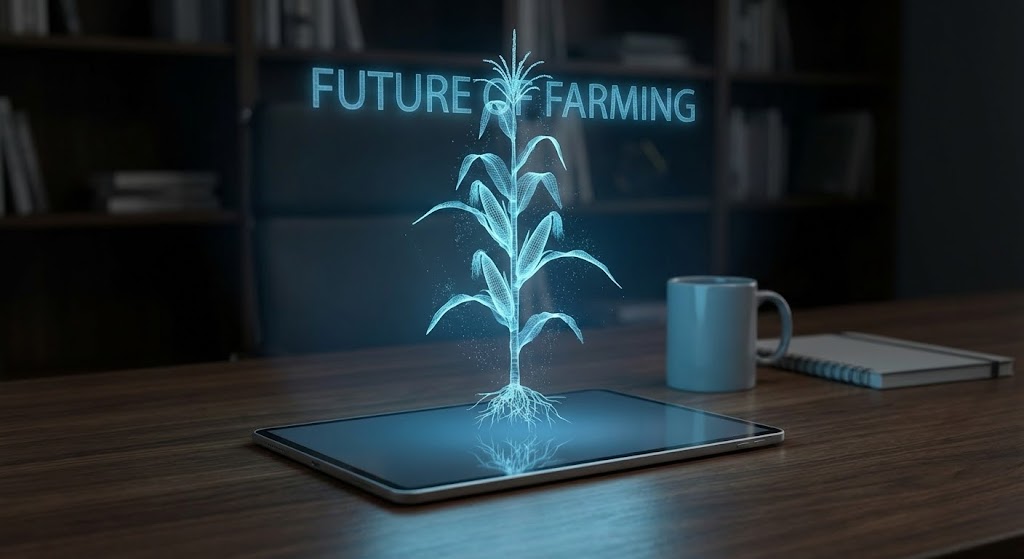
20. Holographic UI over 3D Render
BOFU | Accelerating Time-to-Value
The Visual & Narrative Approach
A sleek tablet lies on a dark wooden executive desk. Projecting upwards from the screen is a rotating 3D hologram of a corn stalk, rendered in translucent Hologram Blue light. It looks like a scene from a sci-fi movie. This style visualizes the concept of the "Digital Twin"—the ability to analyze the crop's genetic and biological status without stepping foot in the field.
Psychological Impact & KPI Focus
- Niche Psychology: This appeals to the Innovator persona. It frames the software not just as a management tool, but as a scientific instrument. It signals "Deep Tech" capabilities, justifying a premium price point for advanced R&D modules.
- Operational Impact: Accelerating Time-to-Value. It visually promises that the software reveals hidden insights (root health, genetic potential) immediately.
Strategic Implementation & Trade-offs
- Best Use: Product Launch Keynotes / "Future Vision" Pages.
- Trade-off: It is aspirational. If the software is just a 2D dashboard, this can be seen as "Vaporware." It must be clearly framed as a visualization of data depth, not literal interface.
Companies using similar video content -
Prospera Technologies – Prospera AI – AI for crop health and yield optimization.
SeeTree – SeeTree Platform – Tree health and production intelligence.
21. 3D X-Ray Visualization
BOFU | Reducing Implementation Friction

The Visual & Narrative Approach
This style creates a powerful sense of transparency. We see a photorealistic tractor or piece of heavy machinery rendered with a semi-transparent, "ghosted" outer shell in Engine Grey. Inside, specific components—pistons, gears, or sensor arrays—glow in X-Ray Blue and Skeleton White. The camera orbits the machine, revealing the internal logic that drives the operation. It visualizes the software's ability to see inside the hardware.
Psychological Impact & KPI Focus
- Niche Psychology: Farm fleet managers often feel they are operating "blind" when it comes to machine health. This visual provides "Cognitive Penetration." It reassures them that the ERP system offers deep, diagnostic visibility into their assets, preventing costly downtime.
- Operational Impact: Reducing Implementation Friction. It visualizes the complexity of the integration in a clean, manageable way, suggesting that the software understands the machinery as well as the mechanic does.
Strategic Implementation & Trade-offs
- Best Use: Technical Blog Posts / Hardware Integration Pages.
- Trade-off: Highly technical. It appeals strongly to Fleet Managers and Mechanics but may bore the Finance Director.
Companies using similar video content -
Ag Leader – Ag Leader Technology – Precision agriculture hardware and software.
Topcon Corporation – Topcon Agriculture – Precision agriculture guidance systems.
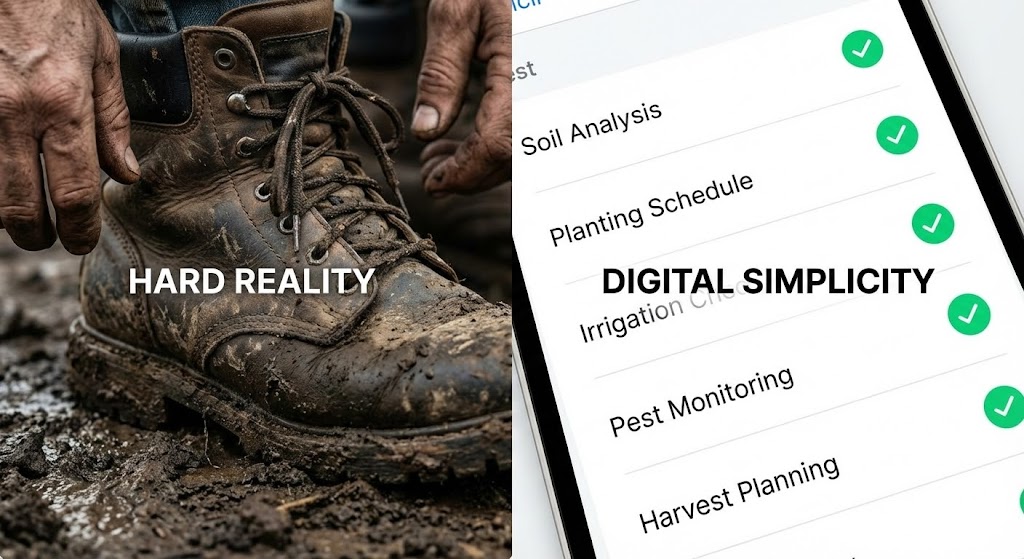
22. Split Screen: Optimized Reality and UI
BOFU | Overcoming Objections
The Visual & Narrative Approach
A stark, high-contrast composition. The left half of the screen displays the "Hard Reality": a close-up, gritty photo of a muddy work boot, a rusted fence, or storm clouds. The right half displays the "Digital Simplicity": a pristine, Clean White mobile UI checklist with satisfying Green checkmarks. A vertical divider slides back and forth, showing how the digital tool tames the physical mess.
Psychological Impact & KPI Focus
- Niche Psychology: Farmers are skeptics; they know software doesn't fix mud. This style validates their skepticism ("We know it's messy out there") while offering a solution ("But we keep your records clean"). It leverages "Contrast Bias" to heighten the perceived value of the organization.
- Operational Impact: Overcoming Objections. It directly addresses the fear that "tech is too fragile for the farm" by juxtaposing the rugged reality with the clean management layer.
Strategic Implementation & Trade-offs
- Best Use: Email Nurture Campaigns / Retargeting Ads.
- Trade-off: The contrast must be sharp. If the "Reality" side isn't gritty enough, the visual loses its emotional punch.
Companies using similar video content -
EasyFarm – EasyFarm Software – Farm accounting and record-keeping.
Farm At Hand – Farm At Hand App – End-to-end farm management solution.
23. Dark Mode UI Showcase
BOFU | The Technical Buyer
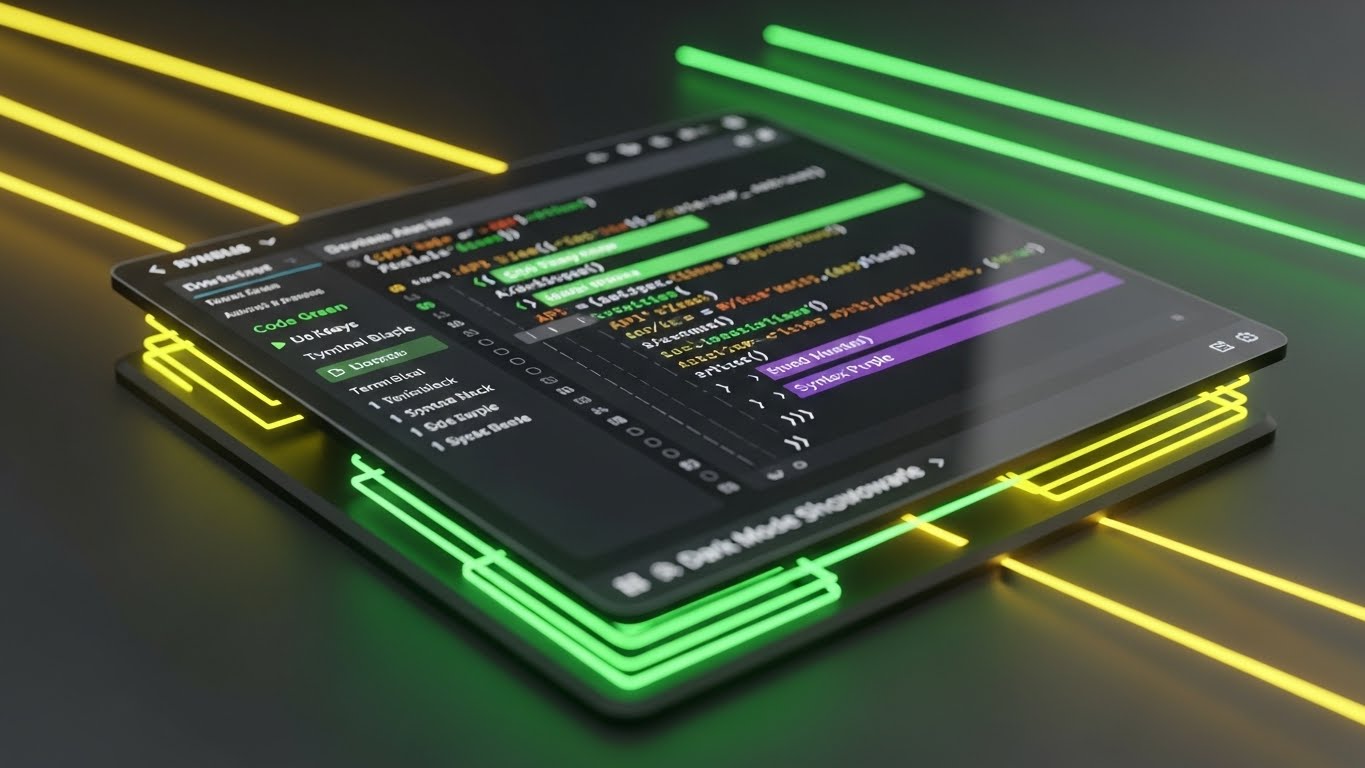
The Visual & Narrative Approach
We shift focus to the unsung heroes: the developers and IT staff. The screen displays a code editor environment (IDE) with syntax highlighting in Code Green, Terminal Black, and Syntax Purple. We see abstract representations of API keys, JSON strings, and successful "200 OK" server responses. The camera angle is slightly tilted (isometric) to add depth to the flat code.
Psychological Impact & KPI Focus
- Niche Psychology: The Technical Buyer (CTO/IT Director) cares about one thing: Integration. Is the API clean? Is the documentation good? This visual speaks their language. It signals that the platform is "Developer-Friendly" and built on modern, robust standards.
- Operational Impact: The Technical Buyer. It builds credibility with the gatekeepers who have the power to veto the software purchase based on technical debt concerns.
Strategic Implementation & Trade-offs
- Best Use: Developer Documentation / API Portal Headers.
- Trade-off: Incomprehensible to the non-technical user. Never use this for a general marketing campaign; keep it in the technical docs.
Companies using similar video content -
Microsoft Dynamics 365 with Agriware 365 – Agriware 365 – ERP for horticulture and floriculture.
Kohezion – Kohezion ERP – Customizable ERP for agricultural businesses.
24. 2D Character-Driven Story
Onboarding | Knowledge Base

The Visual & Narrative Approach
To reduce anxiety during the learning curve, we use a friendly, stylized "Corporate Memphis" illustration style. A character with non-specific features (Blue skin, Pink shirt) interacts with large, floating support bubbles—a question mark, a chat icon, a lightbulb. The background is soft and abstract. The character smiles and points, guiding the user.
Psychological Impact & KPI Focus
- Niche Psychology: New users often feel stupid when they get stuck. This style utilizes "Affective Design" to create a non-threatening, forgiving atmosphere. It tells the user, "It's okay to ask for help; we are here for you."
- Operational Impact: Knowledge Base & Help Center. It humanizes the support process, encouraging users to self-serve through tutorials rather than calling the hotline.
Strategic Implementation & Trade-offs
- Best Use: Help Center Articles / "Empty State" Screens.
- Trade-off: Can feel childish if overused. It works best for "Support" and "Learning," not for "High-Stakes Financial Data."
Companies using similar video content -
FarmKeep – FarmKeep App – All-in-one farm management for small farms.
PANTHEON Farming – PANTHEON Farming Software – Comprehensive farm management.
25. 2D Animation & UI Composition
Onboarding | Self-Serve Onboarding

The Visual & Narrative Approach
A playful, energetic composition designed to make the "Setup" phase feel like a game. A large, stylized hand cursor interacts with floating UI buttons (Teal and Coral). The elements have "bouncy" physics—they squash and stretch when clicked. A large "Play" button icon sits centrally. It visualizes the ease of getting started.
Psychological Impact & KPI Focus
- Niche Psychology: The "Cold Start Problem" kills SaaS adoption. Users sign up but never configure the account. This style uses "Gamification Cues" to promise a dopamine reward for completing the setup tasks. It makes the mundane task of data entry feel interactive.
- Operational Impact: Self-Serve Onboarding. It increases the "Activation Rate" by making the initial clicks feel responsive and fun.
Strategic Implementation & Trade-offs
- Best Use: App Welcome Screens / "Getting Started" Emails.
- Trade-off: Just like Style 24, it sacrifices authority for approachability. Use it only at the very beginning of the user journey.
Companies using similar video content -
AgroPal – AgroPal App – Farm management and planning.
Red Hen – Red Hen Marketplace – Online marketplace for regenerative farmers.
26. Abstract 2D Flat Vector Organic
Retention | Website Visitor Re-engagement

The Visual & Narrative Approach
This style visualizes the concept of "Consolidation." Glossy, liquid-like shapes in Organic Greens and Earth Tones flow from the edges of the screen to merge into a single, cohesive circle in the center. It is abstract, calming, and satisfying. It represents fragmented data (spreadsheets, notes, receipts) merging into one cohesive ERP system.
Psychological Impact & KPI Focus
- Niche Psychology: Farm administrators deal with fragmentation—data is everywhere. This visual provides a "Gestalt satisfaction." It subconsciously reinforces the primary benefit of the ERP: Wholeness and Centralization.
- Operational Impact: Visitor Re-engagement. It serves as a gentle visual reminder in display ads for users who visited the site but didn't convert, reminding them of the peace of mind the solution offers.
Strategic Implementation & Trade-offs
- Best Use: Google Display Network (GDN) Ads / Sidebar Banners.
- Trade-off: It is purely brand-building. It conveys a feeling, not a feature.
Companies using similar video content -
Syngenta Group – Syngenta Digital – Crop protection and digital solutions.
Heirloom – Heirloom Platform – Cloud-based farm management for sustainability.
27. Macro UI Micro-Interactions
Retention | Reducing Churn

The Visual & Narrative Approach
An extreme close-up (Macro) shot. We see the ridges of a fingerprint just as it touches a glowing glass screen. The button under the finger lights up in UI Blue. We see the pixels. This isn't about the data; it's about the touch. It emphasizes the responsiveness and "premium feel" of the mobile application.
Psychological Impact & KPI Focus
- Niche Psychology: Users churn when software feels clunky or unresponsive. This visual leverages "Sensory Marketing." By highlighting the tactile moment of interaction, it suggests that the app is responsive, modern, and a joy to use.
- Operational Impact: Reducing Churn. It subtly reminds existing users of the quality of the tool they have in their pocket, reinforcing the decision to renew the subscription.
Strategic Implementation & Trade-offs
- Best Use: Newsletter Headers / "New Feature" Announcements.
- Trade-off: Requires high-resolution production. A blurry macro shot looks like a mistake.
Companies using similar video content -
Tend – Tend Platform – Streamlines operations for diversified farms.
Local Line – Local Line Platform – Farm sales, inventory, and customer management.
28. Photorealistic 3D Renders
Expansion | Driving Deep Feature Adoption

The Visual & Narrative Approach
We go underground. A cross-section of the earth reveals Rich Soil Dark Brown layers. Delicate Root White systems stretch downwards, interacting with glowing blue particles that represent water and fertilizer data. The rendering is cinema-quality (Octane/Redshift), showing individual grains of dirt. It visualizes the "Pro" features—advanced agronomy and soil analysis.
Psychological Impact & KPI Focus
- Niche Psychology: To upsell a basic user to a "Pro" tier, you must offer them value they cannot see with the naked eye. This visual appeals to the "Scientific Farmer." It visualizes the hidden ROI of soil health, justifying the cost of advanced modules.
- Operational Impact: Driving Deep Feature Adoption. It entices users to unlock the advanced analytics modules by showing them the "hidden world" they are missing.
Strategic Implementation & Trade-offs
- Best Use: "Upgrade to Pro" Landing Pages / In-App Paywalls.
- Trade-off: High rendering cost. It creates a high expectation of scientific accuracy that the software data must fulfill.
Companies using similar video content -
Agremo – Agremo Platform – Field analytics from drone imagery.
OneSoil – OneSoil Platform – Precision farming with satellite monitoring.
29. 3D Parallax UI Presentation
Expansion | Driving Upsell/Cross-sell

The Visual & Narrative Approach
To visualize the "Enterprise" tier, we show depth. Multiple semi-transparent UI screens float in a void, separated by significant Z-axis (depth). As the camera pans, the parallax effect reveals that these aren't just flat screens; they are layers of a complex ecosystem. The style uses "Glassmorphism"—blurred backgrounds and sharp foregrounds—to convey sophistication.
Psychological Impact & KPI Focus
- Niche Psychology: Enterprise buyers want a "Stack," not an app. This visual leverages "Spatial Depth" to metaphorically represent the depth of the platform's capabilities. It implies that the software can grow with the user, layer by layer.
- Operational Impact: Driving Upsell. It effectively markets "Add-on" modules (e.g., drone mapping, financial planning) as additional layers that slide perfectly into the existing stack.
Strategic Implementation & Trade-offs
- Best Use: Webinar Backgrounds / Enterprise Sales Decks.
- Trade-off: Can look cluttered if too many layers are shown. Less is more—show 3 distinct layers maximum.
Companies using similar video content -
iRely – iRely ERP – Business execution software for agriculture.
AGRIS by Greenstone Systems – AGRIS ERP – Grain accounting and commodity trading.
30. Aspirational Stock Montage
Expansion | Driving Referrals & Advocacy

The Visual & Narrative Approach
We conclude with the human element. A high-key, sunlit shot inside a greenhouse or standing by a truck. A farmer and a consultant (or two peers) are shaking hands, smiling genuinely. They wear crisp shirts; the lighting is warm and optimistic. There is no UI, no data—only the result of a job well done.
Psychological Impact & KPI Focus
- Niche Psychology: Ultimately, business is about relationships and success. This visual targets "Social Proof" and "Belonging." It creates a positive association between the brand and professional success/partnership.
- Operational Impact: Driving Referrals (Case Studies). This is the visual anchor for "Customer Success Stories." It tells the prospect, "This could be you."
Strategic Implementation & Trade-offs
- Best Use: Case Study Headers / Testimonial Carousels.
- Trade-off: It is generic. It relies entirely on the quality of the copy and the specific testimonial to give it weight.
Strategic Knowledge Base: The Visual Operations Doctrine
To transform these 30 visual styles from a marketing checklist into a competitive business asset, we must organize them into a strategic framework. This doctrine moves beyond creating content to operationalizing visualization across the entire Agricultural ERP lifecycle.
Strategic Alignment & Visual Architecture (Pre-Production)
The "Why" and "Who" – Laying the Foundation.
- The Cognitive Load Audit: Before commissioning a single pixel, audit your current training materials. If a manual takes 15 minutes to read, can a Style 6 (Rapid Montage) video convey it in 30 seconds? Map visual complexity to user fatigue.
- Role-Based Visual Mapping: Do not use the same visuals for the Combine Operator and the CFO. Use High-Contrast/Large Text (Style 1) for field staff using mobile devices in bright sunlight. Use Dense Data/Medical White (Style 11) for office staff on desktop monitors.
- The "Glanceability" Standard: In AgTech, users are often driving heavy machinery. Visuals must be legible in <2 seconds. Adopt the "Glanceability" standard from automotive UI design for all driver-facing video assets.
- Brand Voice Consistency: Your marketing videos (Style 3) and your in-app tooltips (Style 27) must feel like they come from the same family. Establish a "Visual UID" (Unique Identifier)—a consistent color palette and motion curve that unifies the experience.
- The Advids Strategic Audit: Partner with Advids during this phase to define your "Visual Operating System." We help audit your existing assets to identify gaps between your brand promise and your visual reality.
- Standardization vs. Customization: For core features (Payroll), use standardized, high-polish assets (Style 19). For niche features (specific crop harvesting), use templated structures that allow for rapid, lower-cost updates.
- The Cross-Departmental Bridge: Use visuals to align Sales and Product. A "Wireframe to Reality" video (Style 7) prevents Sales from over-promising vaporware by grounding their pitch in the actual product roadmap.
- Legacy System Integration: Visualizing the invisible connection between old on-premise hardware and new SaaS clouds is difficult. Use Style 21 (X-Ray) to visually demonstrate how your software "wraps" around and modernizes their legacy equipment without requiring total replacement.
- Accessibility in the Field: Your workforce is diverse and often multi-lingual. Use Kinetic Typography (Style 1) and icon-driven narratives to bypass language barriers, ensuring safety protocols are understood by all native tongues.
- The Mobile-First Mandate: 80% of AgTech interaction happens on a phone. Ensure every visual style (especially Styles 5 and 17) is legible on a 5-inch screen. If it doesn't work on mobile, it doesn't work in agriculture.
Operational Adoption & Implementation (Deployment)
The "How" – Embedding Visuals into the Workflow.
- Overcoming "Big Brother" Anxiety: Farmers fear surveillance. Use Style 14 (Green Shield) and Style 22 (Split Screen) to visually frame data collection as protection and organization, not monitoring. Empathy in visualization is your strongest counter-objection tool.
- The Micro-Learning Shift: Replace the 50-page PDF manual with a library of 30-second "Micro-Learning" clips (Style 25). These bite-sized assets respect the farmer's time and are easily searchable in the field.
- Just-in-Time Support: Embed specific visual styles directly into the helpdesk. When a user logs a "Sync Error," automatically serve them a Style 2 (Abstract Motion) video that calms them and explains the data flow process.
- Gamification of Training: Use Style 9 (Isometric Workflow) to visualize the "Leveling Up" of farm operations. Show progress bars and "clean grids" to gamify the dull task of data entry and compliance logging.
- Reducing Support Ticket Volume: There is a direct correlation between proactive visual guides and reduced call center load. A well-placed Style 24 (Character Story) in the onboarding flow can deflect up to 40% of "How-to" tickets.
- Remote Onboarding: In a distributed world, on-site training is expensive. Use Style 29 (Parallax UI) and screencasts to conduct "High-Touch" onboarding remotely, simulating the feeling of sitting next to the user.
- Standard Operating Procedures (SOPs): Transform text-based SOPs into visual process flows. A "Harvest Safety" SOP becomes a Style 12 (Minimalist Vector) video that is watched and verified by every driver before the season starts.
- Feedback Loops: Use interactive video elements. After a Style 10 (Data Viz) video plays, ask "Did this help?" The data collected helps refine the visual strategy iteratively.
- Scalable Localization: Strategies for translating visual assets for global fleets. Use icon-heavy styles (Style 26) to reduce the need for translated text overlays.
- Leadership Communication: When the CEO needs to communicate a new strategy to investors or the board, drop the PowerPoint. Use Style 18 (Cinematic) to convey scale, vision, and authority that static slides cannot match.
Measuring Impact & Future-Proofing (ROI)
The "ROI" – Proving Value and Evolving.
- Beyond "Views": Vanity metrics (views) are useless in B2B. Measure Time-to-Competency (how fast a new user performs a task after watching) and Feature Adoption Rate (clicks on a feature after a video release).
- The "Idle Time" Metric: In logistics, time is money. Correlate better visualization (Style 19) with reduced "Software Navigation Time." If a clear video saves a driver 5 minutes per day, that is massive ROI across a fleet.
- Compliance Velocity: How fast can you get a fleet compliant with new regulations (e.g., Carbon Reporting)? Measure the speed of adoption when using Style 11 (Medical White) videos versus text emails.
- Retention and Churn: High-quality UX visualization (Style 27) directly impacts Customer Lifetime Value (LTV). Users who "feel" the quality of the app through superior visuals are less likely to churn for a cheaper competitor.
- The AI Visual Frontier: Prepare for Generative AI. Soon, you will use Style 3 (Mixed Media) to generate personalized weather reports for each specific farm. Build the data infrastructure now to support this future.
- Scalability of Assets: Build a component library. If you change your UI color from Blue to Green, you shouldn't have to re-shoot 50 videos. Use vector-based styles (Style 8) that can be globally updated via code or master files.
- The Advids Partnership: Scale is the enemy of quality. As your feature set grows, Advids acts as your long-term partner for asset scalability, ensuring that video #100 has the same strategic fidelity as video #1, allowing your internal team to focus on product.
- Benchmarking Success: Why "good enough" visuals are a competitive risk. Do not compare your visuals to other AgTech; compare them to consumer apps (Uber, Airbnb). Your users expect "Consumer Grade" UX (Style 20).
- The ROI of Safety: Quantifying insurance cost reduction through better visual safety training. Use Style 5 (AR Overlay) to show hazards before they happen.
- Final Call to Innovation: Treat visualization as infrastructure, not content. In the "Mud to Cloud" era, the company that best visualizes the truth of the farm will be the one that owns the data of the future. The screen is the new soil; plant your seeds wisely.
Companies using similar video content -
Farm Credit Canada – Farm Credit Canada Services – Financing, insurance, and software for agriculture.
Traction Ag – Traction Ag Software – Farm accounting and financial clarity.
Author & Editor Bio


