
Introduction: Bridging the "Deployment Gap" with Visual Intelligence
The defining challenge of the current AI era is not model architecture, but model operations. For CTOs and VPs of Engineering, the journey from a Jupyter Notebook to a globally scalable API is fraught with invisible perils—latency spikes, model drift, and security vulnerabilities. This operational chasm is known as the "Deployment Gap," and it is where ROI goes to die.
The industry data is stark. According to Gartner, at least 30% of generative AI projects will be abandoned after proof of concept by the end of 2025, largely due to poor integration and unclear business value. The "black box" nature of AI exacerbates this; stakeholders cannot trust what they cannot see.
However, the solution is not just better code, but better communication. The global MLOps market is exploding, growing at a CAGR of 40.5% through 2030. To capture this growth, platforms must adopt a visual language that translates abstract complexity into tangible confidence.
This guide presents 30 distinct visual styles designed to solve this specific problem. From the organic fluidity of decentralized networks (Style 7) to the rigid security of photorealistic vaults (Style 12), these examples provide a strategic taxonomy for every stage of the funnel. They do not just decorate your content; they engineer trust, clarify structure, and bridge the physical/digital divide.
1. Abstract 2D flat vector organic
TOFU | Brand Awareness

The Visual & Narrative Approach
Visualization Scenario: This style abandons the rigid "tech grid" for a biological metaphor. We see fluid bubble shapes in vivid coral and slate grey merging and separating with a glossy sheen. It visually simulates the behavior of decentralized data clouds—constantly adapting, morphing, and flowing without friction against a pure white background.
Narration Style: The voiceover is calm and sophisticated, using terms like "ecosystem," "harmony," and "fluid integration" to contrast with the jagged, stressful reality of manual deployment.
Psychological Impact & KPI Focus
- Niche Psychology: It addresses the anxiety of "brittleness" in legacy infrastructure. The organic shapes subconsciously signal Resilience and Adaptability.
- Operational Impact: Visualizes Serverless Scaling. It makes the platform look easy to use, lowering the barrier to entry.
Strategic Implementation & Trade-offs
- Use Case: Social Ads (Instagram/LinkedIn).
- Duration: 10-15 Seconds.
- Strategic Trade-off: Excellent for emotional connection (Brand Awareness), but too abstract to explain technical specs (MOFU).
Companies using similar video content -
MLflow – MLflow – Manages machine learning lifecycle with flexibility.
TrueFoundry – TrueFoundry – Cloud-agnostic, developer-friendly MLOps platform.
HashiCorp – Terraform – Automates infrastructure as code with fluid animations.
2. Abstract 3D AI Visualization
TOFU | Category Creation

The Visual & Narrative Approach
Visualization Scenario: This style establishes "Category Leadership" through high-end spectacle. A vast, cinematic network of glowing neural nodes in electric cyan and magenta stretches into an infinite white void. The camera movement is majestic and wide-angle, emphasizing the sheer magnitude of the connectivity. It looks like the "brain" of the internet.
Narration Style: Epic and visionary. It speaks to the "Global Scale" and "Intelligence" of the platform, positioning it as a fundamental layer of the AI economy.
Psychological Impact & KPI Focus
- Niche Psychology: Enterprise buyers want to partner with the "future." This aesthetic triggers the Magnitude Effect, making the platform appear powerful and ubiquitous.
- Operational Impact: Visualizes Global Throughput and Latency Reduction. It proves the platform can handle millions of concurrent requests.
Strategic Implementation & Trade-offs
- Use Case: Website Header.
- Duration: 15-20 Seconds (Looping).
- Strategic Trade-off: High production cost. Requires premium rendering to avoid looking like generic "stock footage."
Companies using similar video content -
Google Cloud – Vertex AI – Unified ML platform for global scale.
Amazon Web Services – SageMaker – Fully managed service for building and deploying ML models.
Microsoft Azure – Azure Machine Learning – Cloud-based MLOps for enterprises.
3. Isometric 2D Motion Design
TOFU | Market Education

The Visual & Narrative Approach
Visualization Scenario: Here, we visualize the "plumbing." A precise isometric grid hosts a stylized tube structure (the pipeline). Geometric data packets (cubes/spheres) flow rhythmically through the system. The palette of teal, mustard yellow, and charcoal is clean and legible. It deconstructs the deployment process into a logical, step-by-step factory line.
Narration Style: Educational and articulate. It breaks down the "Input -> Transformation -> Inference" stages clearly.
Psychological Impact & KPI Focus
- Niche Psychology: DevOps engineers crave Order. This style reduces cognitive load by showing exactly where the data goes, removing the "black box" fear.
- Operational Impact: Visualizes CI/CD Pipelines and Data Lineage. It validates the structural logic of the platform.
Strategic Implementation & Trade-offs
- Use Case: Blog Header / Explainer Video.
- Duration: 30-45 Seconds.
- Strategic Trade-off: Can feel "dry" or "low-tech." It prioritizes clarity over excitement.
Companies using similar video content -
Apache – Airflow – Orchestrates complex data pipelines.
Kubeflow – Kubeflow – Simplifies ML workflows on Kubernetes.
Kedro – Kedro – Streamlines data pipelines for ML projects.
5. Abstract 2D Motion Graphics
TOFU | Differentiation

The Visual & Narrative Approach
Visualization Scenario: Speed is the hero. Bauhaus-style geometric shapes (arrows, chevrons) and dynamic diagonal lines cut across the screen in pumpkin orange and black. The motion is fast, staccato, and directional (left-to-right). It doesn't show the software; it visualizes the velocity of the software.
Narration Style: Energetic, punchy, and confident. Key terms: "Sprint," "Launch," "Zero Latency."
Psychological Impact & KPI Focus
- Niche Psychology: In the race to market, Speed is the differentiator. This style uses kinetic energy to differentiate the brand as the "Fastest" option.
- Operational Impact: Visualizes Low Latency and Deployment Velocity. It creates a feeling of momentum.
Strategic Implementation & Trade-offs
- Use Case: LinkedIn Feed Ad.
- Duration: 6-10 Seconds.
- Strategic Trade-off: Very abstract. Needs strong copy to anchor the visual "speed" to a specific business benefit.
Companies using similar video content -
Groq – Groq – High-speed AI inference with LPUs.
Fireworks AI – Fireworks AI – Speed and scalability for multi-modal AI.
BentoML – BentoML – Packages and deploys ML models rapidly.
6. 2D Line Art Animation
MOFU | Thought Leadership

The Visual & Narrative Approach
Visualization Scenario: This looks like a high-end architectural blueprint coming to life. Thin, continuous lines in navy blue and metallic gold draw out a complex server architecture on a white texture. It emphasizes precision, depicting load balancers, API gateways, and nodes as a detailed schematic.
Narration Style: Technical, authoritative, and precise. It appeals to the System Architect who values details over flash.
Psychological Impact & KPI Focus
- Niche Psychology: Technical experts trust Schematics. This style validates the platform's engineering rigor and transparency.
- Operational Impact: Visualizes System Architecture and API Integration. It proves you have "nothing to hide."
Strategic Implementation & Trade-offs
- Use Case: LinkedIn / Whitepaper Summary.
- Duration: 30-60 Seconds.
- Strategic Trade-off: Boring to non-technical buyers. Use strictly for deep-dive technical content.
Companies using similar video content -
Seldon – Seldon Core – Deploys machine learning models on Kubernetes.
NVIDIA – Triton Inference Server – High-performance inference server for AI.
ZenML – ZenML – Extensible open-source MLOps framework for pipelines.
7. Bold Kinetic Typography
MOFU | Skippable Ad

The Visual & Narrative Approach
Visualization Scenario: Words become the visuals. Heavy geometric forms and blocky shapes abstractly represent text (like "DEPLOY NOW"). The forms interlock and shift aggressively in high-contrast hot pink and jet black. The motion is percussive, synchronized to sound effects, ensuring the message lands even in a distracted environment.
Narration Style: Urgent and imperative. "Deploy. Scale. Win."
Psychological Impact & KPI Focus
- Niche Psychology: Attention spans are zero. This style uses Visual Shock to force the viewer to read/watch.
- Operational Impact: Visualizes Urgency and Impact. It drives immediate CTR.
Strategic Implementation & Trade-offs
- Use Case: Pre-Roll Ad.
- Duration: 5-10 Seconds.
- Strategic Trade-off: Zero educational value. It is purely a hook mechanism.
Companies using similar video content -
Modelbit – Modelbit – Deploys trained models using Python or Git.
Qwak – Qwak – Simplifies the entire ML lifecycle for data science.
TrueFoundry – TrueFoundry – Fast, developer-friendly, cloud-agnostic ML deployment.
8. Minimalist Flat 2D Vector
MOFU | SEO Content

The Visual & Narrative Approach
Visualization Scenario: A clean, "Corporate Memphis" illustration of a desktop monitor displaying a simplified upward-trending graph. The curves are smooth, and the colors are mint green and soft beige. It strips away all technical noise to focus purely on the result: growth and success.
Narration Style: Friendly, helpful, and results-oriented.
Psychological Impact & KPI Focus
- Niche Psychology: Reduces Cognitive Load. It tells the user, "This is easy, and it works."
- Operational Impact: Visualizes ROI and Dashboard Metrics. It provides a positive visual anchor for dense text content.
Strategic Implementation & Trade-offs
- Use Case: Blog Post Image.
- Duration: Static or Micro-Loop.
- Strategic Trade-off: Generic. It doesn't build unique brand equity but is highly effective for supporting content.
Companies using similar video content -
DataRobot – DataRobot AI – Automates predictive modeling for business value.
Domino Data Lab – Domino Data Lab – Enterprise MLOps platform for scalable AI.
Neptune.ai – Neptune.ai – Lightweight experiment tracking and model registry.
9. Low-Poly 3D Modeling
MOFU | Feature Education

The Visual & Narrative Approach
Visualization Scenario: Cloud infrastructure is reimagined as a miniature world of floating geometric islands connected by bridges. Rendered in low-poly 3D with soft lavender and white tones, it looks like a simulation game. The tilt-shift camera angle makes the massive infrastructure feel small and manageable.
Narration Style: Playful, exploratory, and simplifying. "Build your world," "Connect your islands."
Psychological Impact & KPI Focus
- Niche Psychology: Cloud complexity causes anxiety. This style Gamifies the experience, making the user feel in control and dominant over the tech.
- Operational Impact: Visualizes Microservices and Cluster Management. It simplifies topology into clear, distinct units.
Strategic Implementation & Trade-offs
- Use Case: Website Feature Page.
- Duration: 30-45 Seconds.
- Strategic Trade-off: Can look "childish" if not textured with premium materials.
Companies using similar video content -
Pachyderm – Pachyderm – Automates data transformation with versioning on Kubernetes.
Ray – Ray – Scalable compute for AI and ML workloads.
Anyscale – Anyscale – Ray platform for scalable AI applications.
10. Photorealistic 3D Renders
MOFU | Building Trust

The Visual & Narrative Approach
Visualization Scenario: A hyper-realistic render of a brushed steel server vault door with intricate locking mechanisms. The lighting is cold, clinical, and symmetrical, emphasizing the weight and strength of the materials (steel blue, silver). It looks impenetrable.
Narration Style: Serious, secure, and reassuring. "Bank-grade encryption," "Sovereign protection."
Psychological Impact & KPI Focus
- Niche Psychology: Security is the #1 blocker. This style triggers the Fortress Bias—heavy, realistic materials imply strong, unbreakable protection.
- Operational Impact: Visualizes Data Sovereignty and SOC2 Compliance. It builds institutional trust for high-value contracts.
Strategic Implementation & Trade-offs
- Use Case: Landing Page (Security Section).
- Duration: 10-15 Seconds.
- Strategic Trade-off: Expensive. Must be indistinguishable from reality to work.
Companies using similar video content -
ModelOp – ModelOp – Enterprise software for AI lifecycle automation and governance.
IBM – Watsonx – Enterprise AI with governance tools.
Fiddler AI – Fiddler AI – AI Observability and Security platform.
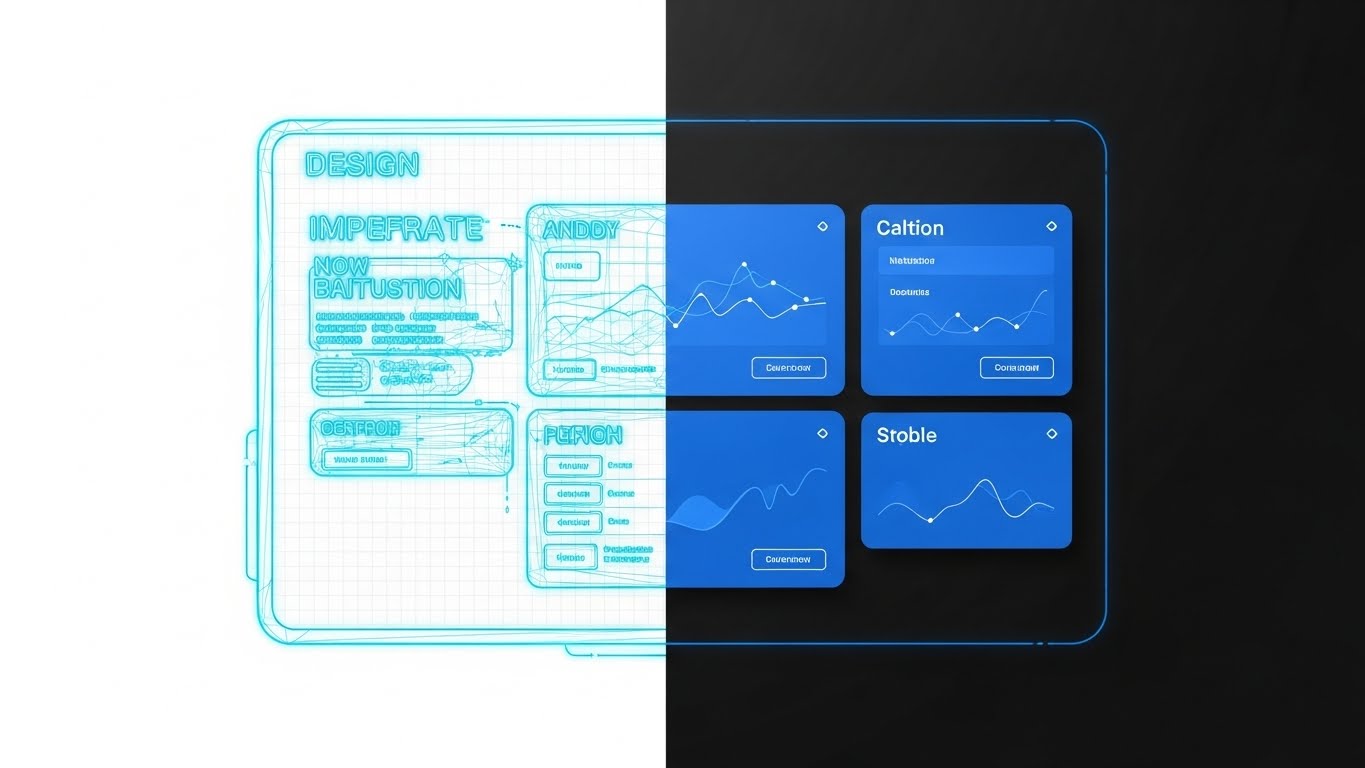
11. Wireframe to Reality Trans**
MOFU | Reducing Friction
The Visual & Narrative Approach
Visualization Scenario: This style visualizes the "What You See Is What You Get" promise of modern deployment. A split-screen composition divides the frame. On the left, a cyan wireframe mesh represents the architectural blueprint or staging environment on a white grid. A sharp vertical line wipes across the screen, transforming the wireframe instantly into a solid, polished blue render of the final interface on the right. It visually proves that the planned architecture matches the deployed reality 1:1.
Narration Style: Efficient, seamless, and satisfying. The audio should emphasize the "snap" of the transition, reinforcing the speed of moving from concept to production.
Psychological Impact & KPI Focus
- Niche Psychology: Developers fear the "works on my machine" paradox. This visual alleviates that anxiety by demonstrating Environment Parity—ensuring that staging and production are identical.
- Operational Impact: Visualizes Deployment Velocity and Reduced Configuration Drift. It argues that the platform eliminates the friction between design and execution.
Strategic Implementation & Trade-offs
- Use Case: Product Page / Feature Release Video.
- Duration: 10-15 Seconds.
- Strategic Trade-off: Excellent for showing speed, but implies a simplicity that may need to be backed up by deeper technical docs for complex custom integrations.
Companies using similar video content -
Harness – Harness – AI software delivery platform for SDLC.
Baseten – Baseten – Model management API for CI/CD tooling.
UnSkript – UnSkript – AI for DevOps, diagnosing Kubernetes issues.
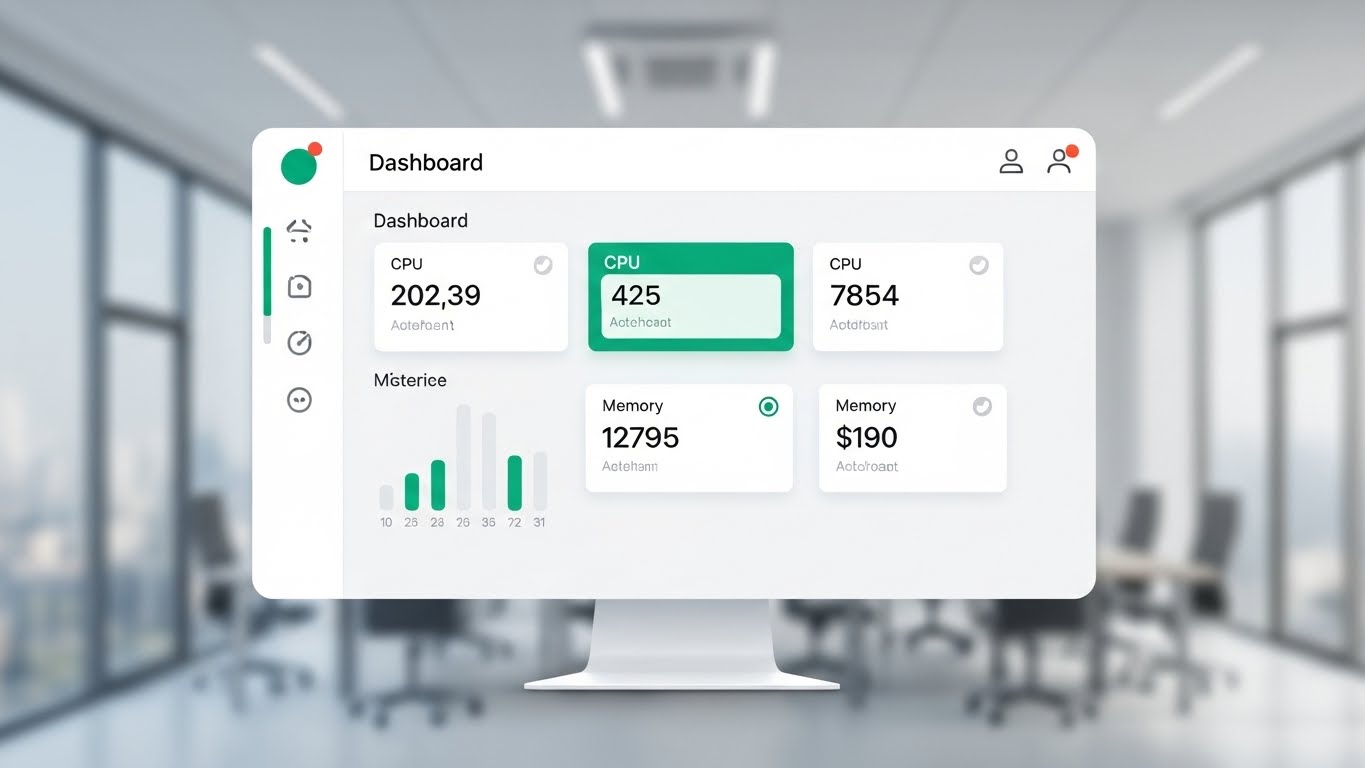
12. Clean UI Workflow (Light Mode)
MOFU | Functional Buyer
The Visual & Narrative Approach
Visualization Scenario: We shift to the perspective of the daily user. A pristine, light-mode UI dashboard floats against a blurred, bright modern office background. The interface uses skeuomorphic depth with soft drop shadows and rounded corners. Emerald green and soft grey data cards display critical health metrics like "CPU Load" and "Memory Usage" clearly and calmly. It looks less like a terminal and more like a consumer app.
Narration Style: Professional, clear, and organized. It focuses on "Visibility," "Control," and "Health Monitoring."
Psychological Impact & KPI Focus
- Niche Psychology: For the Functional Buyer (the person using the tool daily), Usability is the primary concern. This style promises a low-stress, organized user experience, countering the fear of "clunky enterpriseware."
- Operational Impact: Visualizes Observability and Resource Management. It demonstrates that system health can be assessed at a glance.
Strategic Implementation & Trade-offs
- Use Case: Pitch Deck / Demo Video.
- Duration: 30-60 Seconds.
- Strategic Trade-off: Prioritizes ease-of-use over deep technical complexity. It appeals more to the Manager/Director level than the deep-backend Architect.
Companies using similar video content -
Weights & Biases – Weights & Biases – Visualizes and tracks machine learning experiments.
Azure Machine Learning – Azure ML Studio – User-friendly web interface for ML workflows.
Google Cloud – Vertex AI – Unified ML platform with intuitive dashboards.
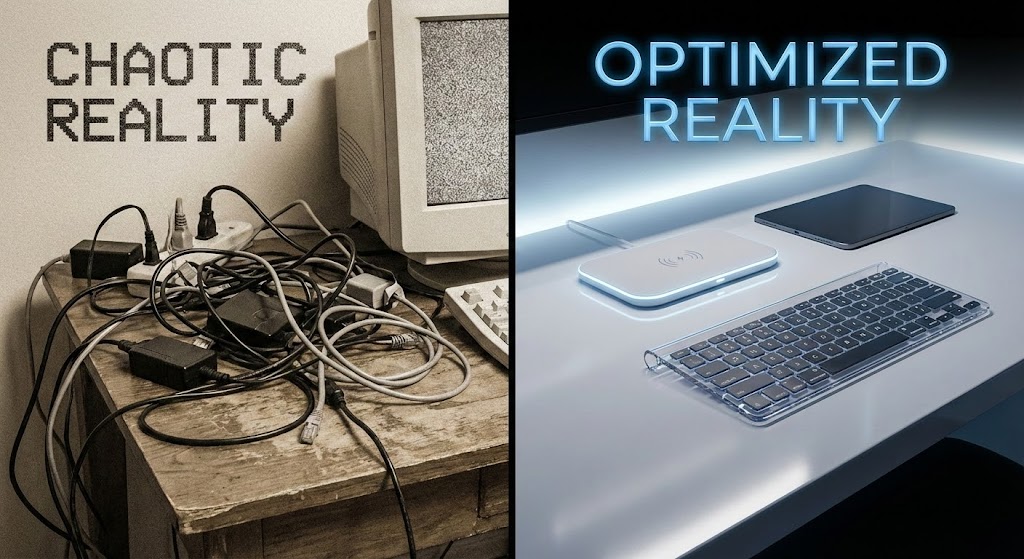
13. Split Screen: Reality/UI
MOFU | Competitive Disp
The Visual & Narrative Approach
Visualization Scenario: A direct "Before and After" confrontation. The left side, labeled "CHAOTIC REALITY," depicts the pain of the status quo: a grainy, desaturated image of tangled cables and messy hardware, symbolizing "spaghetti code" and technical debt. The right side, labeled "OPTIMIZED REALITY," shows a pristine, wireless tech surface with a glowing white device and transparent keyboard, bathed in cool blue light.
Narration Style: Comparative and decisive. "Stop untangling. Start innovating." It frames the competitor/legacy solution as a burden and your platform as the liberation.
Psychological Impact & KPI Focus
- Niche Psychology: It triggers Disgust for the messy old way and Desire for the clean new way. It visually validates the feeling that their current process is broken.
- Operational Impact: Visualizes Technical Debt Reduction and Infrastructure Orchestration. It sells the value of replacing manual patches with automated pipelines.
Strategic Implementation & Trade-offs
- Use Case: Comparison Landing Page / Competitor Takedown Ad.
- Duration: 10-15 Seconds.
- Strategic Trade-off: Aggressive. It explicitly calls out the "mess" of current solutions, which requires confidence that the viewer is indeed frustrated with their current stack.
Companies using similar video content -
Northflank – Northflank – Container-native, multi-cloud platform for AI/ML.
Qwak – Qwak – Simplifies the entire ML lifecycle.
TrueFoundry – TrueFoundry – Modern MLOps for fast, developer-friendly deployment.
15. Dynamic Data Visualization
MOFU | ROI Justification

The Visual & Narrative Approach
Visualization Scenario: This is the "Money Shot." A 3D bar chart rendered in translucent violet and neon blue glass rises aggressively from a white grid floor. A glowing cyan arrow traces the trajectory, pointing sharply upward. The camera angle is low, looking up at the graph to emphasize scale, height, and dominance. It abstracts complex performance data into a singular trajectory of success.
Narration Style: Triumphant and factual. Focuses on "Scale," "Throughput," and "Return."
Psychological Impact & KPI Focus
- Niche Psychology: Stakeholders need to see Growth. This style provides a visual anchor for "Up and to the Right," satisfying the biological preference for upward movement as a proxy for success.
- Operational Impact: Visualizes Scalability and Revenue Impact. It supports claims of handling massive traffic spikes or increasing inference speed by X%.
Strategic Implementation & Trade-offs
- Use Case: Case Study / Investor Presentation.
- Duration: 5-8 Seconds.
- Strategic Trade-off: Highly abstract. It implies success but doesn't explain how it was achieved. Best used as punctuation after a technical explanation.
Companies using similar video content -
C3.ai – C3 AI Platform – Enterprise AI for business transformation.
Infosys – Infosys Topaz – Accelerates business value with poly-AI approach.
DataRobot – DataRobot AI – Automates predictive modeling for business value.
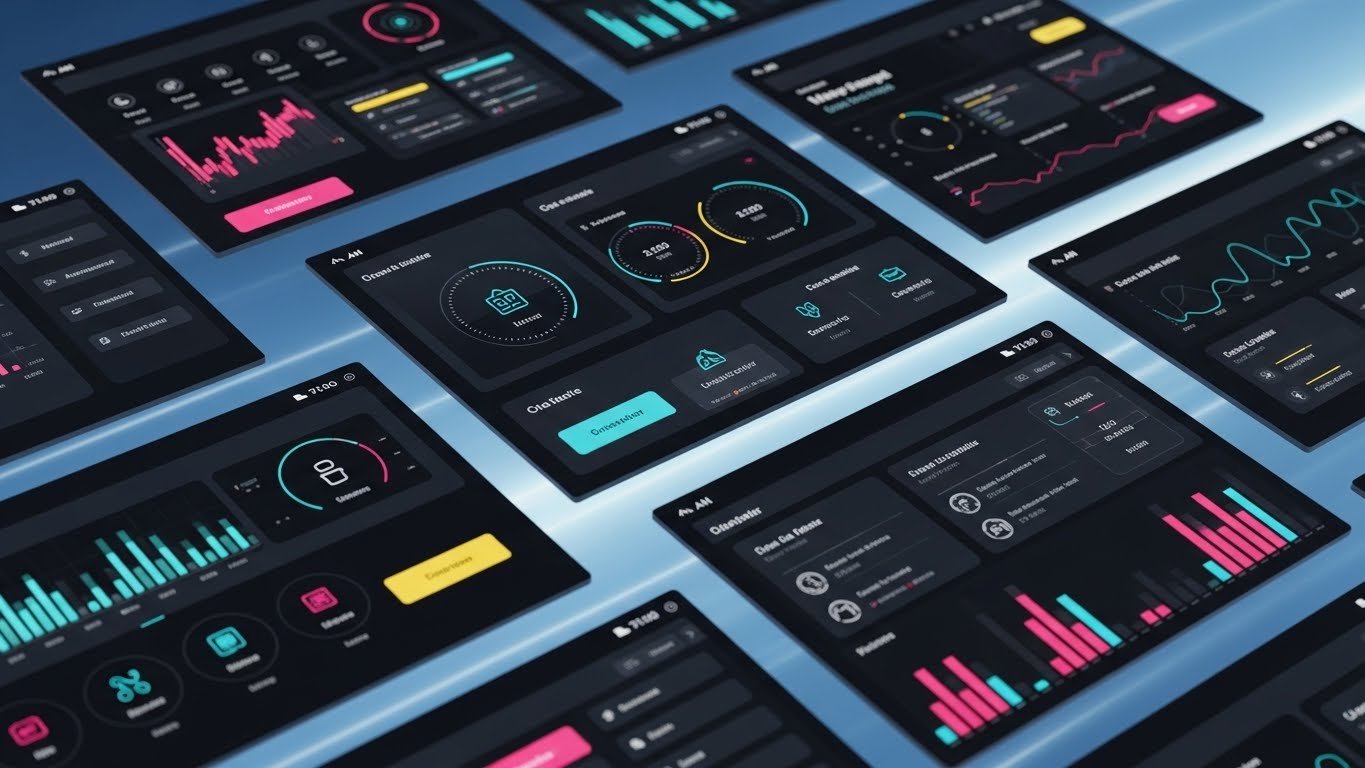
16. Dark Mode UI Showcase
BOFU | Risk Mitigation

The Visual & Narrative Approach
Visualization Scenario: Security is serious business, and this style reflects that. We see a sleek Dark Mode interface focused on governance. Neon green shield icons and checkmarks glow against the deep charcoal background, highlighting active security protocols. The "glass" texture of the UI panels catches the green light, suggesting a high-tech, impenetrable monitoring station.
Narration Style: Serious, hushed, and intense. "Encrypted," "Monitored," "Compliant."
Psychological Impact & KPI Focus
- Niche Psychology: Security Officers operate in a high-threat environment. Dark mode suggests Vigilance and Stealth. The glowing shields provide visual confirmation of active protection.
- Operational Impact: Visualizes SOC2/ISO Compliance and Real-time Threat Detection. It answers the "Is it safe?" objection before it is voiced.
Strategic Implementation & Trade-offs
- Use Case: Security & Compliance Page.
- Duration: 15-20 Seconds.
- Strategic Trade-off: Can feel "intimidating" to non-security buyers. Keep it focused on the "Safety" aspect rather than just "Threats."
Companies using similar video content -
ModelOp – ModelOp – AI lifecycle automation and governance for compliance.
Fiddler AI – Fiddler AI – AI Observability and Security platform.
IBM – Watsonx – Enterprise AI with robust governance.
17. 3D X-Ray Visualization
BOFU | Technical Buyer

The Visual & Narrative Approach
Visualization Scenario: For the skeptic who wants to see under the hood. The camera zooms into a processor or server unit, the outer casing turning transparent (glass). Inside, we see the complex internal architecture with glowing red data pathways pulsing through the core. It looks like high-end medical or chip-fabrication imagery—clean, precise, and incredibly detailed.
Narration Style: Analytical and deep. It speaks to "Architecture," "Core Logic," and "Processing Power."
Psychological Impact & KPI Focus
- Niche Psychology: The Technical Buyer (CTO/Architect) needs to validate the Engineering Rigor. They distrust "magic." This style shows the "engine," validating the complexity and sophistication of the backend.
- Operational Impact: Visualizes Inference Logic and Hardware Optimization. It proves the software is optimized for the hardware it runs on.
Strategic Implementation & Trade-offs
- Use Case: Whitepaper / Technical Documentation.
- Duration: 20-30 Seconds.
- Strategic Trade-off: High production cost. Overkill for marketing to generalists, but essential for closing the technical evaluation team.
Companies using similar video content -
Groq – Groq – Specialized LPU silicon for ultra-fast inference.
NVIDIA – NVIDIA GPUs – Industry leader in GPU-based AI acceleration.
Intel – Intel AI Accelerators – Comprehensive AI acceleration solutions.
18. 2D Animation & UI Comp
BOFU | Objections

The Visual & Narrative Approach
Visualization Scenario: To humanize the tech, this style blends dimensions. A stylized pastel yellow 2D flat character stands in a clean sky blue and white environment, reaching out to touch a floating translucent glass UI panel. The interaction is gentle and simple. It metaphorically represents the ease with which human operators can control complex AI systems.
Narration Style: Empathetic, simple, and reassuring. "Intelligent control," "Human-centric design."
Psychological Impact & KPI Focus
- Niche Psychology: Addresses the fear that AI is "uncontrollable" or "too complex" for the current team. It visualizes Accessibility and Collaboration.
- Operational Impact: Visualizes Human-in-the-Loop (HITL) workflows and User Experience. It shows that you don't need a PhD to operate the platform.
Strategic Implementation & Trade-offs
- Use Case: Explainer Video / FAQ Section.
- Duration: 15-25 Seconds.
- Strategic Trade-off: The "cartoon" style creates approachability but must be balanced carefully to avoid looking "consumer-grade" in an enterprise context.
Companies using similar video content -
ClearML – ClearML – Open-source suite for experiment management and orchestration.
Hugging Face – Hugging Face – Open-source platform for ML models and LLMs.
BentoML – BentoML – Simplifies shipping machine learning applications.
19. Lifestyle Stock with UI
BOFU | Economic Buyer

The Visual & Narrative Approach
Visualization Scenario: This style targets the person signing the check. We see a high-quality shot of a business executive in a suit, standing in a modern glass office with natural daylight. He looks at a tablet where a futuristic "Decision Matrix" hologram is overlaid. The graph on the tablet glows with tech-focused data points. It connects the software directly to the C-Suite environment.
Narration Style: Strategic and high-level. "Insight," "Foresight," "Executive Control."
Psychological Impact & KPI Focus
- Niche Psychology: The Economic Buyer (CFO/CEO) cares about Oversight and Strategic Advantage. This image places the software literally in the hands of leadership.
- Operational Impact: Visualizes Business Intelligence (BI) and Executive Reporting. It frames the platform as a decision-support tool, not just a dev tool.
Strategic Implementation & Trade-offs
- Use Case: Homepage Hero / Sales Deck.
- Duration: Static Image or Micro-motion.
- Strategic Trade-off: Can look like generic stock photography if the UI overlay isn't high-quality and relevant to the specific product.
Companies using similar video content -
Salesforce – Einstein – AI CRM automation and predictive analytics.
IBM – Watsonx – Enterprise-grade generative AI and governance.
DataRobot – DataRobot AI – Enterprise MLOps for model lifecycle management.
20. 2D Character-Driven Story
BOFU | Sales Acceleration

The Visual & Narrative Approach
Visualization Scenario: The final emotional payoff. Two diverse 2D vector characters (one in vibrant purple, one in teal) are high-fiving in a modern office. A rocket ship icon with "LAUNCHED!" text appears on the whiteboard behind them. The mood is celebratory and energetic. It visualizes the feeling of a job well done—the successful deployment.
Narration Style: Enthusiastic and concluding. "Ship faster," "Celebrate success," "Done."
Psychological Impact & KPI Focus
- Niche Psychology: Deployment is stressful. This style sells the Relief and Joy of a successful, bug-free launch. It focuses on the emotional result of using the software.
- Operational Impact: Visualizes Time-to-Market and Team Efficiency. It reinforces the idea that this platform makes the team happier and more productive.
Strategic Implementation & Trade-offs
- Use Case: Email Signature / Onboarding Welcome.
- Duration: 5-10 Seconds.
- Strategic Trade-off: Purely emotional. It contains no technical information, so it should only be used when the technical case has already been proven (Closing phase).
Companies using similar video content -
Modelbit – Modelbit – Simplifies ML deployment from notebook to production.
Qwak – Qwak – Comprehensive MLOps platform for efficient ML projects.
TrueFoundry – TrueFoundry – Accelerates ML deployment and developer experience.
21. Isometric 3D Workflow**
BOFU | Freemium/Trials

The Visual & Narrative Approach
Visualization Scenario: To counter the intimidation of complex MLOps environments, this style uses "Claymorphism"—soft, matte 3D objects with rounded edges and gentle lighting. A miniature, cute workstation setup (server box, monitor, keyboard) sits on a soft pink and clay white surface. It resembles a high-end toy set, making the "Sandbox" environment feel inviting, safe, and "breakable" without consequence.
Narration Style: Welcoming, light, and encouraging. "Play," "Experiment," "Build freely."
Psychological Impact & KPI Focus
- Niche Psychology: Developers often hesitate to try new tools for fear of breaking configurations. The Toy-Like Aesthetic lowers the psychological stakes, encouraging experimentation.
- Operational Impact: Visualizes Sandbox Environments and Ease of Setup. It drives sign-ups for free trials by promising a low-risk learning curve.
Strategic Implementation & Trade-offs
- Use Case: Sign-up Page / Free Trial Landing Page.
- Duration: 10-15 Seconds (Looping).
- Strategic Trade-off: Very casual. Do not use for "Security" or "Compliance" features, as it lacks the gravity of enterprise protection.
Companies using similar video content -
MLflow – MLflow – Manages ML lifecycle through experimentation and deployment.
DagsHub – DagsHub – Open-source MLOps for managing ML projects.
ZenML – ZenML – Extensible open-source MLOps framework for reproducible pipelines.
22. Rapid UI Feature Montage
Post-Sale | Accel TTV
The Visual & Narrative Approach
Visualization Scenario: The first 24 hours are critical. This style uses a high-energy collage of overlapping UI screens tilting at dynamic angles against a speed-blurred electric blue background. The camera flies through the screens, each highlighting a core action: "Import Model," "Set Parameters," "Deploy." It creates a visual rush, symbolizing the speed at which a new user can achieve their first win.
Narration Style: Fast-paced, rhythmic, and driving. "Import. Configure. Live. In minutes."
Psychological Impact & KPI Focus
- Niche Psychology: The "Empty State" paradox—users churn when they don't see immediate value. This style visualizes Momentum, proving that the platform is designed for action, not just configuration.
- Operational Impact: Visualizes Workflow Efficiency and Onboarding Velocity. It reduces early-stage churn by promising quick results.
Strategic Implementation & Trade-offs
- Use Case: Onboarding Welcome Video / "Getting Started" Email.
- Duration: 15-20 Seconds.
- Strategic Trade-off: Can be overwhelming if too fast. Ensure the specific UI elements shown are recognizable "wins."
Companies using similar video content -
Azure Machine Learning – Azure ML Studio – Drag-and-drop pipeline designer for ML.
Google Cloud – Vertex AI – Unified ML platform with MLOps pipelines.
Weights & Biases – Weights & Biases – Tracks and visualizes ML experiments and workflows.
23. Holographic UI over 3D
Post-Sale | Self-Serve

The Visual & Narrative Approach
Visualization Scenario: A realistic 3D render of a laptop on a white coffee shop table (POV shot). A transparent blue holographic help menu projects upward from the screen, floating in mid-air. It highlights specific buttons and workflows on the laptop screen below. This "Augmented Reality" look visualizes the platform's advanced, automated support capabilities—help is always right there, hovering over the problem.
Narration Style: Helpful, futuristic, and omnipresent. "Guidance at your fingertips," "Never stuck."
Psychological Impact & KPI Focus
- Niche Psychology: Engineers hate waiting for support tickets. This style validates their desire for Autonomy. It says, "You can fix this yourself, instantly."
- Operational Impact: Visualizes Self-Serve Documentation and Contextual Help. It aims to deflect Level 1 support tickets.
Strategic Implementation & Trade-offs
- Use Case: In-App Welcome / Help Center Header.
- Duration: 10-15 Seconds.
- Strategic Trade-off: High production value required to make the hologram look integrated, not cheesy.
Companies using similar video content -
Moveworks – Moveworks – Agentic AI for enterprise automation and assistance.
ServiceNow – ServiceNow – Workflow automation and IT service management.
IBM – watsonx Assistant – Builds and deploys AI-powered virtual agents.
24. Macro UI Micro-Interactions
Post-Sale | Deep Feature

The Visual & Narrative Approach
Visualization Scenario: Sometimes, the value is in the details. An extreme macro close-up focuses on a single vivid orange button or toggle switch within the interface. The background is a shallow depth-of-field white blur. We see the subtle texture of the button and the smooth animation as it is clicked/toggled. It elevates a small feature update (e.g., "Auto-Scale Toggle") into a major event.
Narration Style: Intimate, focused, and appreciative of quality. "One click," "Precision control."
Psychological Impact & KPI Focus
- Niche Psychology: Power users appreciate Craftsmanship. This style signals that the platform cares about the granular details of the user experience.
- Operational Impact: Visualizes New Feature Rollouts and UX Polish. It increases adoption of specific, often overlooked, functionalities.
Strategic Implementation & Trade-offs
- Use Case: Feature Release Email / Social Snippet.
- Duration: 3-5 Seconds (Looping).
- Strategic Trade-off: Only effective for existing users who know the context. Meaningless to a new prospect.
Companies using similar video content -
BentoML – BentoML – Fine-grained optimization for model deployment.
OctoML – OctoML – Optimizes, packages, and deploys models across hardware.
Fiddler AI – Fiddler AI – Granular control over model performance and explainability.
25. 2D Graphics Over Live
Post-Sale | Reduce Support

The Visual & Narrative Approach
Visualization Scenario: To humanize the support experience, we use a real photo/video of a smiling support agent in a warm office. Floating around them are 2D pop-art icons (hearts, checkmarks, speech bubbles) in bright primary colors. The graphics animate playfully, emphasizing the agent's words. It bridges the gap between a cold SaaS platform and the warm humans behind it.
Narration Style: Friendly, conversational, and reassuring. "We're here to help," "Real people, real answers."
Psychological Impact & KPI Focus
- Niche Psychology: When things break, users feel isolated. This style triggers Social Connection, reassuring them that a compassionate team is backing the software.
- Operational Impact: Visualizes Customer Success and Support Quality. It builds patience and goodwill during service disruptions.
Strategic Implementation & Trade-offs
- Use Case: Help Center / "Contact Us" Page.
- Duration: 15-30 Seconds.
- Strategic Trade-off: Can look like a B2C commercial if not balanced with professional attire and setting.
Companies using similar video content -
Ringover – Empower by Ringover – AI assistant for optimizing customer loyalty.
Aisera – Aisera – AI-powered customer service and support.
Coveo – Coveo – AI-powered search and recommendations for support.
26. Hyper-lapse Stock + Data
Post-Sale | User Activation

The Visual & Narrative Approach
Visualization Scenario: A high-angle hyper-lapse of a busy city street. Traffic creates long motion streaks. Overlaid on the physical world are white digital data lines flowing in sync with the cars, labeled with metrics like "API Calls" or "Active Users." It connects the abstract code to the real-world pulse of business, showing the software "alive" and working in the wild.
Narration Style: Dynamic, observational, and pulsing. "The city never sleeps," "Your data in motion."
Psychological Impact & KPI Focus
- Niche Psychology: Inactive users (Zombies) need to be reminded of the platform's utility. This style creates FOMO (Fear Of Missing Out) by showing the vibrancy of active data flow.
- Operational Impact: Visualizes Real-Time Analytics and System Throughput. It encourages users to log in and check their own live traffic.
Strategic Implementation & Trade-offs
- Use Case: Re-engagement Email / "Year in Review" Video.
- Duration: 10-15 Seconds.
- Strategic Trade-off: Abstract. Good for feeling/mood, bad for specific technical instruction.
Companies using similar video content -
Superwise – Superwise – Fully automated model observability platform.
Whylogs – Whylogs – Open-source standard for data logging and ML monitoring.
Radicalbit – Radicalbit – Open-source solution for monitoring AI models.
27. 3D Parallax UI Presentation
Post-Sale | Reducing Churn

The Visual & Narrative Approach
Visualization Scenario: To show that the platform is more than just a single tool, we use Z-space parallax. UI screens break apart into floating layers. The front layers (glass panels) show the dashboard, while back layers (fading into a blurred depth map) show the deeper API integrations and databases. The camera moves sideways, revealing the architectural depth of the software.
Narration Style: Deep, resonant, and structural. "More than a tool," "A complete ecosystem."
Psychological Impact & KPI Focus
- Niche Psychology: Churn happens when users feel they've "outgrown" a tool. This style visualizes Depth and Scalability, proving there is more value beneath the surface.
- Operational Impact: Visualizes Platform Extensibility and Integration Layers. It argues for long-term retention.
Strategic Implementation & Trade-offs
- Use Case: Quarterly Business Review (QBR) Deck / Renewal Presentation.
- Duration: 20-30 Seconds.
- Strategic Trade-off: Complex. Requires high-end motion design to achieve the "glass" effect.
Companies using similar video content -
Databricks – Databricks – Unified platform for data and AI.
Google Cloud – Vertex AI – Unified ML platform with deep integrations.
IBM – Cloud Pak for Data – Multicloud data and AI platform.
28. Futuristic Neon/Dark Mode
Post-Sale | Upsell

The Visual & Narrative Approach
Visualization Scenario: The Enterprise Tier needs to look expensive. This style uses a Cyberpunk/Sci-Fi aesthetic with volumetric fog and glowing deep purple/hot pink neon lines. The interface looks like the cockpit of a spaceship. It suggests that upgrading unlocks a "God Mode" of power and visibility that the standard tier lacks.
Narration Style: Exclusive, powerful, and enticing. "Unlock the core," "Power without limit."
Psychological Impact & KPI Focus
- Niche Psychology: Status matters. This style appeals to the Aspirational Self—the user wants to be the "elite" operator who needs this level of power.
- Operational Impact: Visualizes Enterprise Features (e.g., Advanced Security, Dedicated Clusters). It justifies the higher price point through visual superiority.
Strategic Implementation & Trade-offs
- Use Case: Product Launch Video (New Tier) / Upsell Landing Page.
- Duration: 15-30 Seconds.
- Strategic Trade-off: Can alienate standard users if it makes the base product look "cheap" by comparison. Use selectively.
Companies using similar video content -
CoreWeave – CoreWeave – Dedicated GPU cloud for high-performance AI.
GMI Cloud – GMI Cloud Inference Engine – Low latency AI inference at scale.
NVIDIA – NVIDIA H100/H200 – High-performance GPUs for AI workloads.
29. Aspirational Stock Montage
Post-Sale | Referrals

The Visual & Narrative Approach
Visualization Scenario: We shift from code to community. A high-key, sun-drenched photo montage shows a diverse team of professionals laughing around a laptop on a rooftop terrace. The colors are warm earth tones and sky blue. There is no complex UI, just the result of a good platform: a happy, collaborative team.
Narration Style: Authentic, testimonial-driven, and inviting. "Join the community," "Build together."
Psychological Impact & KPI Focus
- Niche Psychology: People refer products that make them look good to their peers. This style visualizes Professional Success and Belonging.
- Operational Impact: Visualizes User Satisfaction and Community Scale. It prompts users to become advocates/ambassadors.
Strategic Implementation & Trade-offs
- Use Case: Referral Program Page / Case Study Header.
- Duration: Static or Slideshow.
- Strategic Trade-off: Generic. Relies entirely on the authenticity of the "cast" to avoid looking like bad stock footage.
Companies using similar video content -
Hugging Face – Hugging Face – Open-source community for ML models.
DagsHub – DagsHub – MLOps platform for collaboration on ML projects.
Weights & Biases – Weights & Biases – Tool for visualizing and tracking ML experiments.
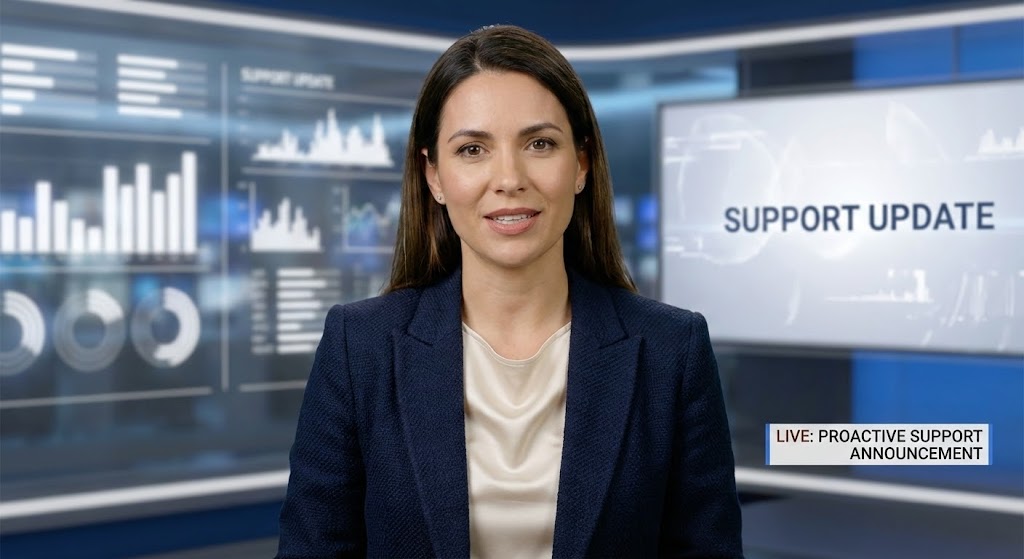
30. Gen AI Realistic Character
Post-Sale | Proactive Support
The Visual & Narrative Approach
Visualization Scenario: The future of support is proactive. A photorealistic Gen AI avatar (a professional female support lead) speaks directly to the camera. The background is a blurred virtual newsroom with white data screens. She delivers a personalized update or "breaking news" about system health. It combines the scalability of AI with the face of a human.
Narration Style: Crisp, clear, and news-anchor professional. "System update," "Optimized for you."
Psychological Impact & KPI Focus
- Niche Psychology: Users ignore text emails. A "personal" video update commands attention. It leverages the Face Bias—we pay attention when a human faces us.
- Operational Impact: Visualizes Proactive Communication and Innovation Leadership. It positions the platform as cutting-edge even in its communication methods.
Strategic Implementation & Trade-offs
- Use Case: Critical System Update / Major Version Release Video.
- Duration: 30-60 Seconds.
- Strategic Trade-off: The "Uncanny Valley." The AI generation must be high-quality (lip-sync, eye movement) or it will damage trust.
Strategic Knowledge Base: The Visual Operations Doctrine
This section synthesizes the 30 visual styles into a cohesive business framework. It moves beyond "what to create" and addresses "how to operationalize" visual intelligence within an AI Deployment & SaaS environment.
STRATEGIC ALIGNMENT & VISUAL ARCHITECTURE
The "Pre-Production" Strategy. Defining the Visual Operating System (VOS).
- The Cognitive Load Audit: Before commissioning a video, audit the complexity of the feature (e.g., Style 6) versus the user's current knowledge. If the gap is high (e.g., explaining "Quantization" to a junior dev), prioritize "Abstract simplification" (Style 1) over "Technical precision" (Style 17).
- Role-Based Visual Mapping: Differentiate your visual language. Use "Dark Mode/Cyberpunk" (Style 28) for the Architect (who wants power) and "Light Mode/Clean UI" (Style 12) for the Manager (who wants clarity). Do not mix these signals.
- The "Glanceability" Standard: In DevOps, speed is currency. Your visual assets (Style 22) must be comprehensible within 3 seconds. If a developer cannot understand the diagram while scrolling a Slack feed, the asset has failed.
- Brand Voice Consistency: Your marketing visuals (TOFU - Style 2) and your documentation visuals (BOFU - Style 6) must share a "Visual DNA." Use the same hex codes for "Data" and "Infrastructure" across both to reduce cognitive friction during onboarding.
- The Advids Strategic Audit: Partner with Advids to define this "Visual Operating System" before production begins. A fragmented visual strategy (cartoonish ads vs. hyper-real product docs) erodes trust faster than bugs do.
- Standardization vs. Customization: Use "Abstract Motion" (Style 5) for generic concepts like "Speed" (reusable assets). Reserve expensive "Photorealistic 3D" (Style 10) for your core differentiators (e.g., your proprietary GPU locking mechanism).
- The Cross-Departmental Bridge: Use visuals to unify terminology. If Sales calls it a "Vault" (Style 10) and Engineering calls it a "Bucket," you have a disconnect. The visual creates the shared truth.
- Legacy System Integration: Visualizing the invisible connection between on-prem hardware and your SaaS is critical. Use "Wireframe to Reality" (Style 11) to show exactly how your cloud software maps to their physical servers.
- Accessibility in Global Teams: Engineering teams are global. "Kinetic Typography" (Style 7) is effective, but ensure motion graphics text is easily localizable or relies on universal icons (Style 25) to bridge language barriers.
- The Mobile-First Mandate: CTOs check status updates on phones. Ensure complex "Architecture Diagrams" (Style 6) are responsive or have simplified "Mobile Card" versions (Style 21) for small screens.
OPERATIONAL ADOPTION & IMPLEMENTATION
The "Deployment" Phase. Embedding visuals into the engineering workflow.
- Overcoming "Black Box" Anxiety: AI is opaque. Use "X-Ray Visualization" (Style 17) to literally show the "inside" of the algorithm. Transparency is not just a value; it’s a visual requirement for trust.
- The Micro-Learning Shift: Developers don't read PDFs. Replace the 50-page "Getting Started" guide with a playlist of ten 15-second "Rapid UI Montages" (Style 22). This drastically reduces Time-to-Hello-World.
- Just-in-Time Support: Embed "Holographic Overlay" loops (Style 23) directly into the IDE or CLI error messages. Deliver the visual solution at the exact moment of frustration.
- Gamification of Deployment: Use "Low-Poly 3D" (Style 9) to visualize team progress or deployment streaks. Gamifying the mundane aspects of MLOps increases engagement and platform stickiness.
- Reducing Support Ticket Volume: There is a direct correlation between proactive "Macro Interaction" videos (Style 24) and reduced L1 tickets. If you show them the button, they won't ask where it is.
- Remote Onboarding: For distributed engineering teams, "Lifestyle Stock with UI" (Style 19) helps remote hires feel connected to the "HQ" vibe, while "Claymorphism" (Style 21) makes the training sandbox feel safe.
- Standard Operating Procedures (SOPs): Transform text-based disaster recovery SOPs into "Isometric Motion" (Style 3) flows. In a crisis, a clear visual flow is faster to follow than a wall of text.
- Feedback Loops: Use interactive video elements (Style 30) to gather feedback. An avatar asking "Did this help?" gets more responses than a static form.
- Scalable Localization: When expanding to EMEA or APAC, use "Abstract 3D" (Style 2) which requires no translation, rather than text-heavy styles. This speeds up global GTM.
- Leadership Communication: When the CTO needs to present to the Board, provide them with "Dynamic Data Visualization" (Style 15). Equip your champion with the visual ammo they need to sell your renewal.
MEASURING IMPACT & FUTURE-PROOFING
The "ROI" Phase. Quantifying the value of visual intelligence.
- Beyond "Views": Measure "Time-to-Competency." Does watching the "Wireframe Transition" (Style 11) video reduce the time it takes a user to deploy their first model? That is your metric.
- The "Idle Time" Metric: Correlate better visualization with reduced software navigation time. High-quality UI montages (Style 22) should result in faster workflows, not longer video watch times.
- Compliance Velocity: How fast does the team adopt new security protocols (SOC2)? Use "Dark Mode Security" (Style 16) videos to announce changes and measure compliance uptake rates.
- Retention and Churn: "Parallax Ecosystem" visuals (Style 27) remind users of the platform's depth. Track churn rates in cohorts exposed to these "Depth" campaigns vs. those who aren't.
- The AI Visual Frontier: Prepare for real-time generative video. Soon, your documentation (Style 23) will generate custom video solutions for specific user error codes on the fly.
- Scalability of Assets: Build a component library of your 3D assets (servers, nodes, locks). This allows you to generate new "Isometric" (Style 3) videos rapidly as features evolve, without starting from scratch.
- The Advids Partnership: Scale isn't just about more videos; it's about maintaining quality at volume. Advids acts as the custodian of your component library, ensuring that Style 29 (Community) and Style 12 (UI) remain consistent as you grow.
- Benchmarking Success: "Good enough" screen recordings are a competitive risk. If your competitor uses "Cinema 3D" (Style 2) and you use shaky screen captures, you lose the perception war before the feature war.
- The ROI of Safety: For on-prem/hybrid deployments, quantifying the reduction in configuration errors (via Style 11) translates directly to saved engineering hours and reduced downtime costs.
- Final Call to Innovation: Treat video not as "content," but as infrastructure. Just as you optimize your API for latency, optimize your visual communication for comprehension. In the AI era, the platform that is easiest to understand is the platform that wins.
Companies using similar video content -
Moveworks – Moveworks – Agentic AI for proactive enterprise automation.
IBM – watsonx Assistant – Builds and deploys AI-powered virtual agents.
Salesforce – Agentforce – AI customer service agents.
Author & Editor Bio


