
 /home/wwwroot/advids.co/design/index.php on line 425
Introduction: The Visualization of Dealership Velocity
The automotive retail landscape is currently navigating its most significant structural shift in decades. We are moving from an era of inventory scarcity and high margins to a normalized market where operational velocity—how fast a dealership moves people, parts, and processes—determines profitability. For Dealer Management System (DMS) providers, this environment offers a massive opportunity. It is no longer enough to sell "software"; you must sell a vision of friction-free orchestration.
The challenge, however, is that the modern DMS is invisible; it is a cloud-native nervous system running in the background. For General Managers and Fixed Operations Directors, the daily reality is a high-stakes battle to synchronize the physical world—service bays, parts counters, showrooms—with the digital world of the DMS. They struggle to see how a digital API connection translates to physical profitability.
The stakes for clear communication are quantifiable. Recent industry data indicates that fixed operations has grown to cover an increasing portion of dealership expenses, jumping from 35% in 2010 to an estimated 65% by the end of 2024. This makes the visualization of "Service Workflow" and "Fixed Ops Efficiency" not just a feature showcase, but a critical financial narrative. Furthermore, the technology gap is widening; yet 70% of dealers agree that lags in real-time customer and vehicle data make data-driven insights less useful.
Your visual strategy must articulate this competitive advantage, positioning your platform not as a utility, but as the essential engine of modern dealership growth. This guide presents a curated selection of "Gold Standard" visualization styles. Each style is analyzed not just for aesthetics, but for its psychological impact on the dealer's mindset—reducing cognitive load, validating their operational expertise, and positioning your platform as the architecture of their future success.
1. The Efficiency Untangler (Style 7)
TOFU | Brand Awareness

The Visual & Narrative Approach
Visualization Scenario: We begin with a bird's-eye view of a chaotic, vibrating tangle of lines in Vivid Coral and Slate Grey—representing the friction of disconnected legacy systems. As the motion begins, these "organic" lines elegantly untangle, straightening into clean, parallel data streams. Icons of wrenches (Service), steering wheels (Sales), and dollar signs (Accounting) slide neatly into connected nodes.
Narration Style: The tone is therapeutic and rhythmic. It emphasizes "flow," "alignment," and the relief of turning disorder into a streamlined operation.
Psychological Impact & KPI Focus
- Niche Psychology: Dealers are overwhelmed by "software bloat" and fragmented tools. This style leverages Perceptual Fluency, giving the viewer an immediate sense of relief. It visualizes the promise of order without getting bogged down in technical UI details.
- Operational Impact: Directly addresses Workflow Efficiency. By showing chaos turning into order, it validates the pain point (disorganization) and offers the solution (alignment) in seconds.
Strategic Implementation & Trade-offs
- Best Use Case: Social Media Teasers (Instagram/LinkedIn) to explain high-level integration concepts.
- Trade-off: It is abstract. It explains the concept of the software, not the feature. Use this for the "Why," not the "How."
- Duration: 15-30 seconds.
Companies using similar video content -
Tekion – Automotive Retail Cloud – Modernizing dealership operations with integrated workflows.
Dominion DMS – VUE – Streamlining dealership processes for efficiency.
DealerBuilt – LightYear DMS – Untangling complex data for smoother operations.
2. The Digital Nervous System (Style 11)
TOFU | Market Education

The Visual & Narrative Approach
Visualization Scenario: This style transports the viewer into the "digital brain" of the vehicle. We see a stylized, glowing chassis—pistons, axles, and wheels rendered in Electric Cyan and Deep Violet neon. A central "cloud chip" pulses above the drivetrain, sending data streams to every mechanical part. The camera moves dynamically through a digital void, mimicking the speed of data transfer and emphasizing the connection between the physical car and the cloud.
Narration Style: Futuristic and authoritative. It speaks to "intelligence," "predictive maintenance," and "infinite scalability."
Psychological Impact & KPI Focus
- Niche Psychology: Appeals to the Technological Aspirations of the Dealer Principal. It frames the software as "Future-Proof" and "Cutting Edge," countering fears of obsolescence.
- Operational Impact: Visualizes Scalability and Data Integration. The infinite void suggests the system can handle millions of ROs across multiple rooftops without crashing.
Strategic Implementation & Trade-offs
- Best Use Case: Website Hero Backgrounds and Event Openers. It builds immediate authority and "Tech Equity."
- Trade-off: High production value requires significant resources. It risks looking like a generic sci-fi movie if not grounded with specific automotive elements (pistons, wheels).
- Duration: 30-45 seconds (Looping).
Companies using similar video content -
Fortellis (CDK Global) – Developer Platform – Connecting automotive data and applications.
Cox Automotive – Data Solutions – Powering insights and connectivity across the ecosystem.
MyDealerLot – Customer Experience Platform – Integrating vehicle and customer data for smart operations.
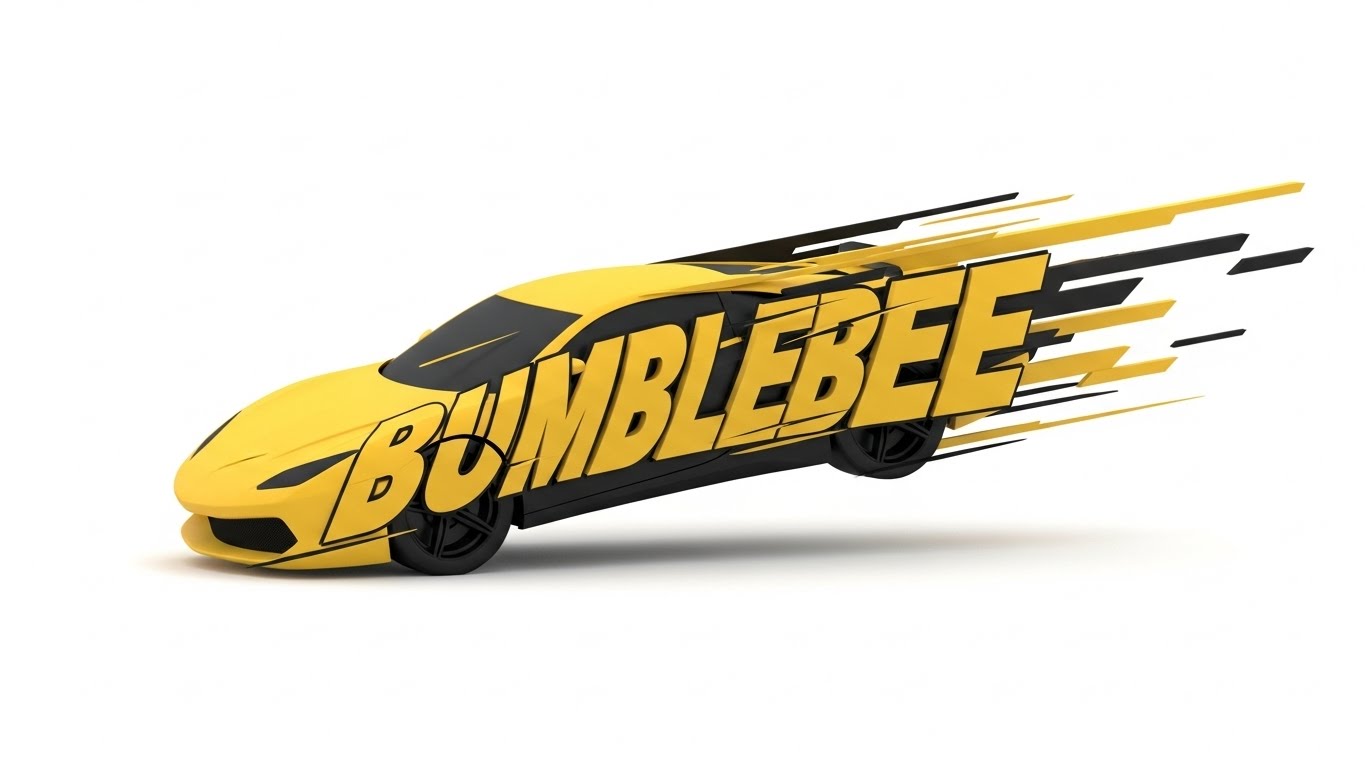
3. The Velocity Engine (Style 4)
TOFU | Brand Perception
The Visual & Narrative Approach
Visualization Scenario: Here, text becomes the object. Heavy, blocky abstract shapes in Bumblebee Yellow and Jet Black rapidly collide, stack, and shear. In a flash, they transform to mimic the silhouette of a sports car in motion, surrounded by abstract speed lines. The energy is high-impact and aggressive. There is no legible body copy, only the visual suggestion of heavy font weights representing "SPEED" and "POWER."
Narration Style: High-energy sound design with engine revs and percussive beats. No voiceover is needed; the rhythm drives the message.
Psychological Impact & KPI Focus
- Niche Psychology: Auto dealers are competitive. This style mirrors the Adrenaline of the sales floor. It uses "Priming" to associate the software brand with speed, dominance, and high performance.
- Operational Impact: Targets Speed of Execution and Inventory Turn. In a busy showroom, time is money; this style promises a lag-free experience.
Strategic Implementation & Trade-offs
- Best Use Case: Vertical Social Media (TikTok/Reels) where sound might be off. It grabs attention in the feed immediately.
- Trade-off: Zero educational value. It creates hype but explains nothing about the product's function.
- Duration: 6-12 seconds.
Companies using similar video content -
VAuto (Cox Automotive) – Provision – Accelerating inventory acquisition and pricing.
LotLinx – AI-Powered Inventory Marketing – Driving faster inventory turnover with targeted ads.
ACV Auctions – Digital Marketplace – Rapid vehicle acquisition and wholesale transactions.
4. The Executive Control Tower (Style 1)
TOFU | Differentiation

The Visual & Narrative Approach
Visualization Scenario: We return to the desk. A clean, Mint Green and Charcoal illustration shows a sleek laptop sitting open on a tidy, modern desk. On the screen, simple, abstract geometric shapes represent positive growth graphs and efficiency metrics (e.g., "25%"). The lighting is even and shadowless ("Corporate Memphis" style). It conveys a sense of calm control and professional organization.
Narration Style: Professional, crisp, and direct. The message focuses on "clarity," "reporting," and "single source of truth."
Psychological Impact & KPI Focus
- Niche Psychology: Lowers Cognitive Load. For a General Manager staring at complex spreadsheets all day, this style is visually soothing. It promises an "Easy Button" for financial reporting.
- Operational Impact: Focuses on Management Visibility. It represents the "Dashboard View" that owners crave—the ability to see the health of the business at a glance.
Strategic Implementation & Trade-offs
- Best Use Case: Website Landing Pages (Above the Fold) and Explainer Video Intros. It establishes trust.
- Trade-off: Can feel generic if not customized with industry-specific props (e.g., a key fob or RO stack on the desk).
- Duration: Static or Micro-Motion (5-10 seconds).
Companies using similar video content -
Reynolds and Reynolds – ERA-IGNITE – Providing comprehensive executive oversight and reporting.
CDK Global – DMS Reporting – Simplifying financial and operational reporting for GMs.
PBS Systems – DMS – Offering clear, concise dashboard views for dealership management.
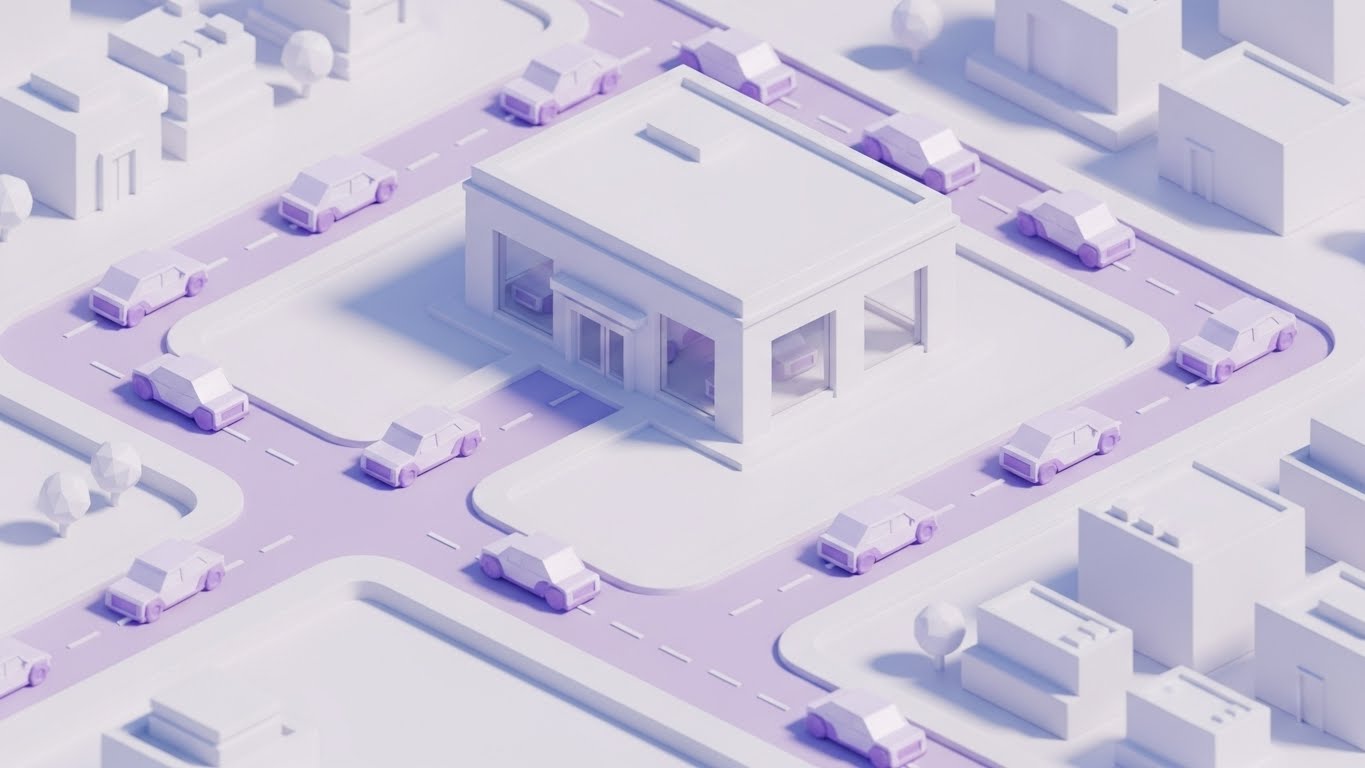
5. The Logistic Loop (Style 9)
TOFU | Trials
The Visual & Narrative Approach
Visualization Scenario: This style gamifies the dealership lot. Using a Low-Poly 3D isometric perspective, we see a miniature digital city rendered in Pastel Lavender and White. Tiny, faceted cars travel along precise roads, feeding into a central dealership building and exiting in a continuous, satisfying loop. The lighting is soft and ambient.
Narration Style: Playful and light. Sound design features satisfying "clicks" as cars slot into place, emphasizing precision.
Psychological Impact & KPI Focus
- Niche Psychology: Appeals to the Systemizer brain type common in Fixed Operations. It satisfies the desire to see the "Big Picture" and the interdependencies of the lot without the stress of reality.
- Operational Impact: Visualizes Turn Rate and Throughput. It shows how software optimizes the physical movement of assets, reducing bottlenecks in the service lane.
Strategic Implementation & Trade-offs
- Best Use Case: TikTok, Reels, and Shorts. The satisfying loops increase "Watch Time" and engagement.
- Trade-off: It simplifies reality. It doesn't show the grit of the service bay, which can feel detached from the actual work environment.
- Duration: 15-30 seconds (Looping).
Companies using similar video content -
Dealerware – Fleet Management – Optimizing vehicle logistics and loaner car management.
AutoIMS – Inventory Management System – Streamlining wholesale inventory movement and tracking.
Dealer-FX (CDK Global) – Service Scheduling – Orchestrating service bay flow and customer appointments.
6. The Data Fortress (Style 13)
TOFU | Web Hero

The Visual & Narrative Approach
Visualization Scenario: The lights go down. We are in the server room. Towering black racks with Neon Pink and Deep Purple accents stretch endlessly upward. Data streams travel like laser beams between the racks. A glowing holographic shield appears, locking into place with the text "FIREWALL PROTECTION." The environment is dark, glossy, and reflective.
Narration Style: Serious, intense, and secure. Deep bass tones convey strength and impenetrability.
Psychological Impact & KPI Focus
- Niche Psychology: Addresses the fear of Cybersecurity Threats. It projects "Fortress" energy, reassuring the CFO and IT Director that their customer data is safe behind the software's walls.
- Operational Impact: Highlights Uptime, Reliability, and Compliance. It visually demonstrates that the backend infrastructure is powerful enough to support the entire dealer group.
Strategic Implementation & Trade-offs
- Best Use Case: YouTube Pre-roll ads targeting IT Directors.
- Trade-off: Can feel cold. It lacks the "Human Element" of customer service. Excellent for selling security, poor for selling relationship tools.
- Duration: 15 seconds (Bumper Ad).
Companies using similar video content -
DealerVault – Data Security Platform – Protecting dealership data with robust security.
KPA – Risk Management Software – Ensuring compliance and data protection for dealerships.
ComplyAuto – Compliance Software – Automating compliance and safeguarding sensitive information.
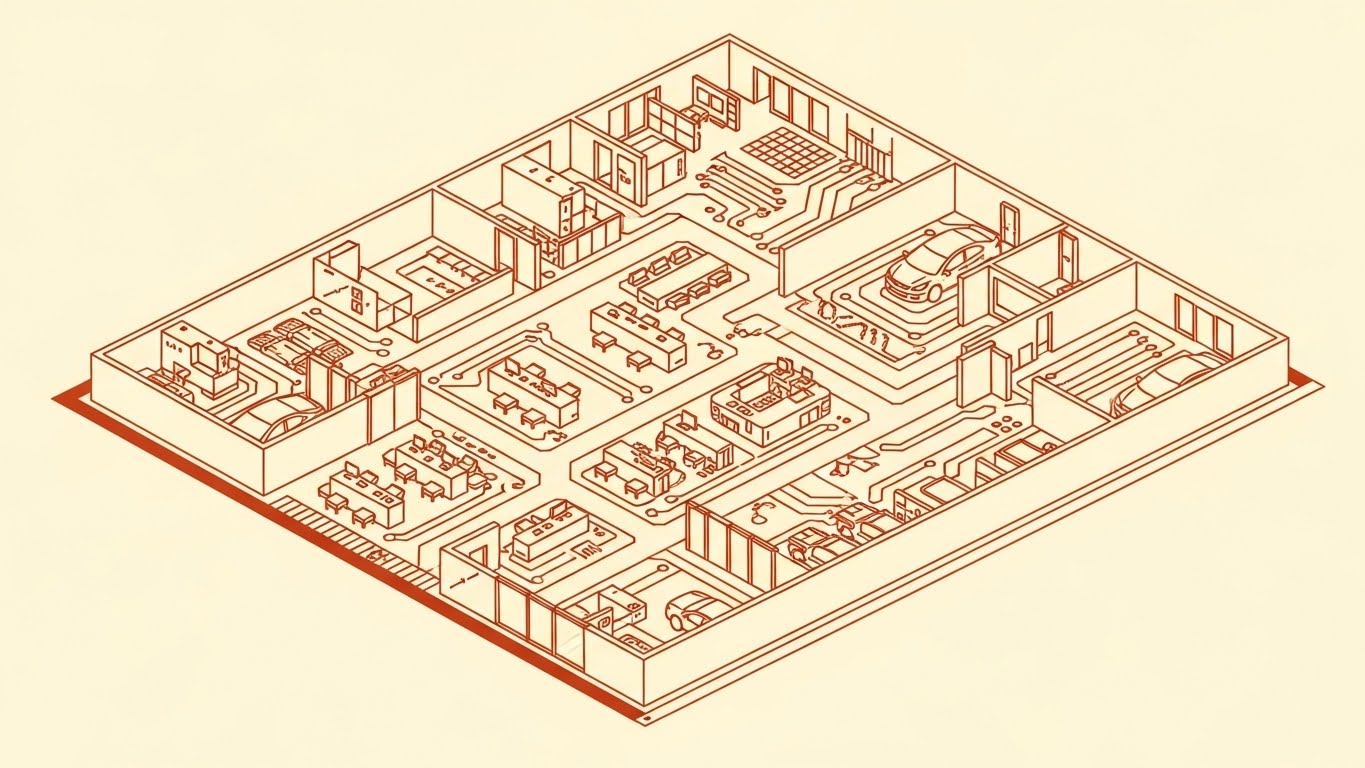
7. The Process Blueprint (Style 3)
TOFU | Vertical Social
The Visual & Narrative Approach
Visualization Scenario: This style treats the dealership floor plan like a printed circuit board. Using a palette of Burnt Orange and Cream, the scene depicts the layout of sales desks, service bays, and F&I offices as connected nodes. Copper-colored traces connect these nodes, and small pulses of light (data) travel efficiently between them. It looks like an architectural blueprint come to life.
Narration Style: Technical and precise. The narrative frames the dealership as a "programmed machine."
Psychological Impact & KPI Focus
- Niche Psychology: Appeals to the Planner and Engineer. It suggests that the software is not just an add-on, but the "Operating System" hardwired into the building's layout.
- Operational Impact: Visualizes Departmental Integration. It proves that the software breaks down silos, connecting variable ops (Sales) with fixed ops (Service).
Strategic Implementation & Trade-offs
- Best Use Case: LinkedIn Thought Leadership posts and Whitepaper companions. It positions the brand as a "Consultant."
- Trade-off: Can be visually dense. Requires the viewer to pay attention to follow the "traces."
- Duration: 45-60 seconds.
Companies using similar video content -
Protractor – Shop Management Software – Engineering efficient service workflows and processes.
Shop-Ware – Shop Management System – Blueprinting repair processes for optimal efficiency.
Infomedia – Parts & Service Solutions – Connecting parts and service processes with precision.
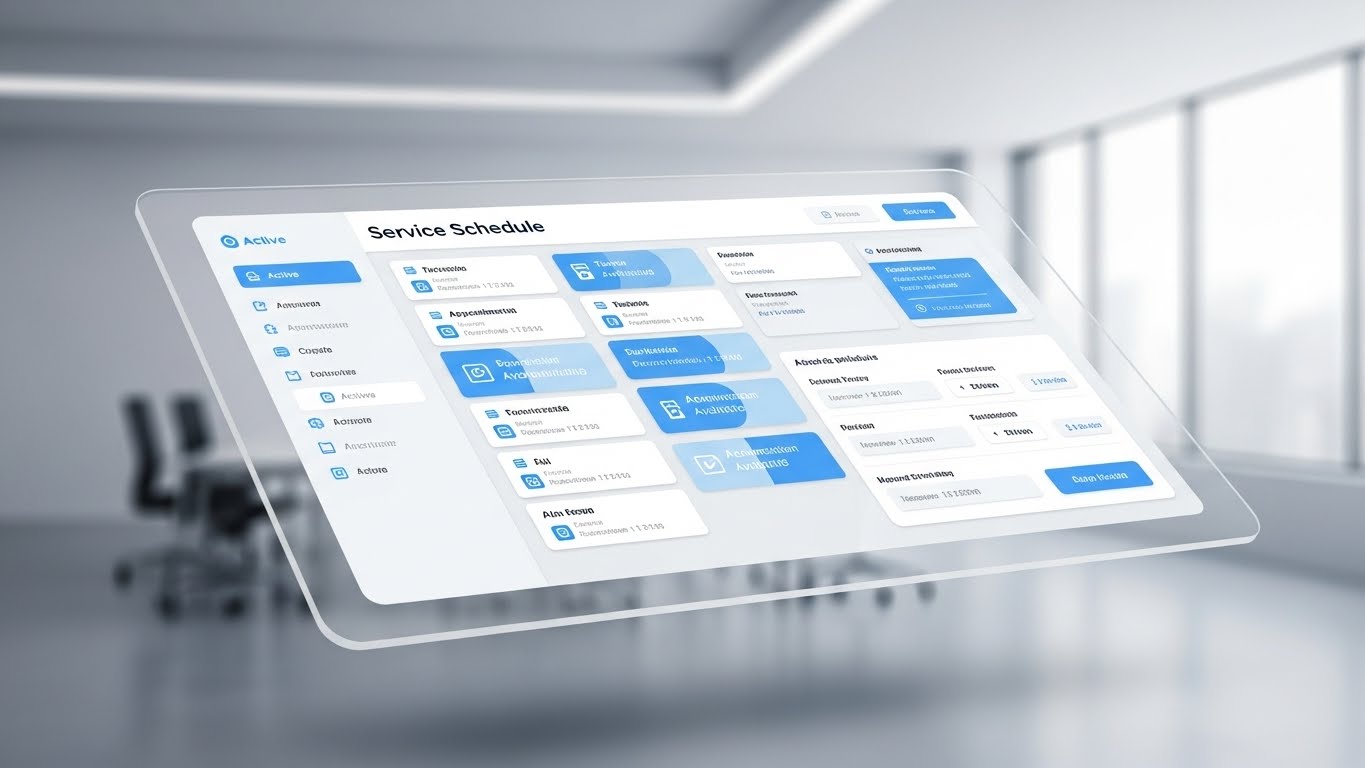
8. The Frictionless Interface (Style 15)
TOFU | Pre-Roll
The Visual & Narrative Approach
Visualization Scenario: This is the "Hero Product" shot. A high-fidelity UI mockup of a 'Service Schedule' grid floats on a translucent glass surface in a soft-focus, modern office. The Sky Blue and White interface is crisp. We see a cursor effortlessly drag-and-drop an appointment block. Shadows are diffused, creating a premium, airy feel.
Narration Style: Instructional and polished. Focuses on the "Ease of Use" and "Frictionless" nature of the tool.
Psychological Impact & KPI Focus
- Niche Psychology: Combats Tech Fatigue. Dealers are used to clunky, gray legacy systems. This style promises a "Consumer-Grade" experience (like an iPhone) for their enterprise work.
- Operational Impact: Focuses on Training Efficiency and Adoption. It visually demonstrates that the software is intuitive, implying lower training costs.
Strategic Implementation & Trade-offs
- Best Use Case: Product Pages and Demo Videos. It is the closest thing to a "Test Drive."
- Trade-off: It must be accurate. If the actual software doesn't look this good, the user will feel deceived.
- Duration: 60-120 seconds.
Companies using similar video content -
Roadster – Express Storefront – Providing a seamless, intuitive online car buying experience.
AutoFi – Digital Retailing Platform – Offering a frictionless digital finance and sales interface.
DealerCenter – DMS – Delivering an easy-to-use, integrated dealership management system.
11. The Inventory X-Ray (Style 14)
MOFU | Feature

The Visual & Narrative Approach
Visualization Scenario: We enter a pristine, clinical lab environment where a highly detailed vehicle engine block rotates slowly on a turntable. Using a "3D X-Ray" aesthetic, the outer metallic casing is rendered in translucent White glass, revealing the complex internal pistons and gears. Suddenly, one specific gear deep within the assembly glows a vibrant, alarming Red. A digital tag floats out, identifying it as a "Critical Backorder" or "Obsolete Part" tracked in real-time.
Narration Style: Clinical, forensic, and precise. The tone mimics a high-tech diagnostic scan, emphasizing "granular visibility" and "precision tracking."
Psychological Impact & KPI Focus
- Niche Psychology: Directly addresses the Parts Manager's fear of the unknown—specifically, "parts leakage" and dead stock hidden on shelves. The X-Ray visual validates their desire for absolute control and accuracy.
- Operational Impact: Visualizes Inventory Accuracy and Fill Rate. It metaphorically demonstrates that the DMS sees through the metal to find the money (parts) hidden in the bins, preventing write-offs.
Strategic Implementation & Trade-offs
- Best Use Case: Detailed Blog Posts about Parts Management and Fixed Ops efficiency.
- Trade-off: Highly technical. It appeals to operational staff but may feel too "mechanical" for a Dealer Principal focused purely on sales.
- Duration: 15-20 seconds.
Companies using similar video content -
RevolutionParts – eCommerce Platform – Revealing hidden parts obsolescence and optimizing inventory.
OEC (OEConnection) – Parts Solutions – Providing granular visibility into parts inventory and availability.
PartsTrader – Collision Parts Procurement – X-raying parts availability and pricing for collision repair.
12. The Consultative Bridge (Style 25)
MOFU | Feature

The Visual & Narrative Approach
Visualization Scenario: Shifting to the F&I office, we use a stylish 2D illustration in a palette of Trust Navy and Gold. We look over the shoulder of a professional F&I Manager holding a floating, stylized tablet. The screen displays a "Finance Menu" with abstract, friendly pie charts. The background is a sketched, cel-shaded outline of a dealership desk, keeping the focus entirely on the human-to-tablet interaction.
Narration Style: Warm, conversational, and empathetic. It emphasizes "transparency," "trust," and "customer comfort," countering the "high-pressure" stereotype.
Psychological Impact & KPI Focus
- Niche Psychology: Combats the stigma of the "Box." It reframes the F&I process as a consultative, transparent experience, appealing to dealers who want to improve their CSI (Customer Service Index) scores.
- Operational Impact: Visualizes PVR (Per Vehicle Retail) and Penetration Rates. It shows the software as a tool for dialogue, not just data entry, leading to higher acceptance of warranty products.
Strategic Implementation & Trade-offs
- Best Use Case: Social Media (LinkedIn/Facebook) targeting Sales Managers and F&I Directors.
- Trade-off: Stylized art can sometimes lack the "Tech Credibility" of 3D. It sells the feeling of the process, not the technical specs.
- Duration: 30-45 seconds.
Companies using similar video content -
Darwin Automotive – F&I Presentation Software – Humanizing F&I presentations with transparent options.
MaximTrak (RouteOne) – Menu Presentation – Building trust through interactive F&I product presentations.
StoneEagle – F&I Reporting & Analytics – Bridging data and F&I performance with clear insights.
13. The Asset Alchemist (Style 6)
MOFU | Feature

The Visual & Narrative Approach
Visualization Scenario: In a dramatic, dark void, we see 3D bar graphs rising from the floor. As the camera zooms in, we reveal the bars are constructed from stacks of gold coins. These stacks fluidly morph and flow, taking the shape of a sleek car silhouette in Emerald Green and Metallic Silver. The animation physically demonstrates the concept that "Inventory is Cash."
Narration Style: Sophisticated and financial. The tone is akin to a Bloomberg report—serious about "liquidity," "holding costs," and "asset turnaround."
Psychological Impact & KPI Focus
- Niche Psychology: Targets the CFO and Controller. These stakeholders view cars not as vehicles, but as depreciating assets on a floorplan. This style validates their worldview that inventory management is financial management.
- Operational Impact: Visualizes Floorplan Interest and Capital Liquidity. It links the physical car directly to the dealership's bank account.
Strategic Implementation & Trade-offs
- Best Use Case: Pitch Decks and Investor-facing presentations.
- Trade-off: It is abstract. It doesn't show the software interface, so it must be paired with UI shots to prove the functionality exists.
- Duration: 10-15 seconds.
Companies using similar video content -
PureCars – Digital Advertising & Analytics – Transforming inventory into liquid assets and reducing holding costs.
TradePending – Trade-In Valuation – Materializing vehicle equity and optimizing asset turnaround.
KAR Global – Wholesale Solutions – Alchemizing wholesale assets into capital liquidity.
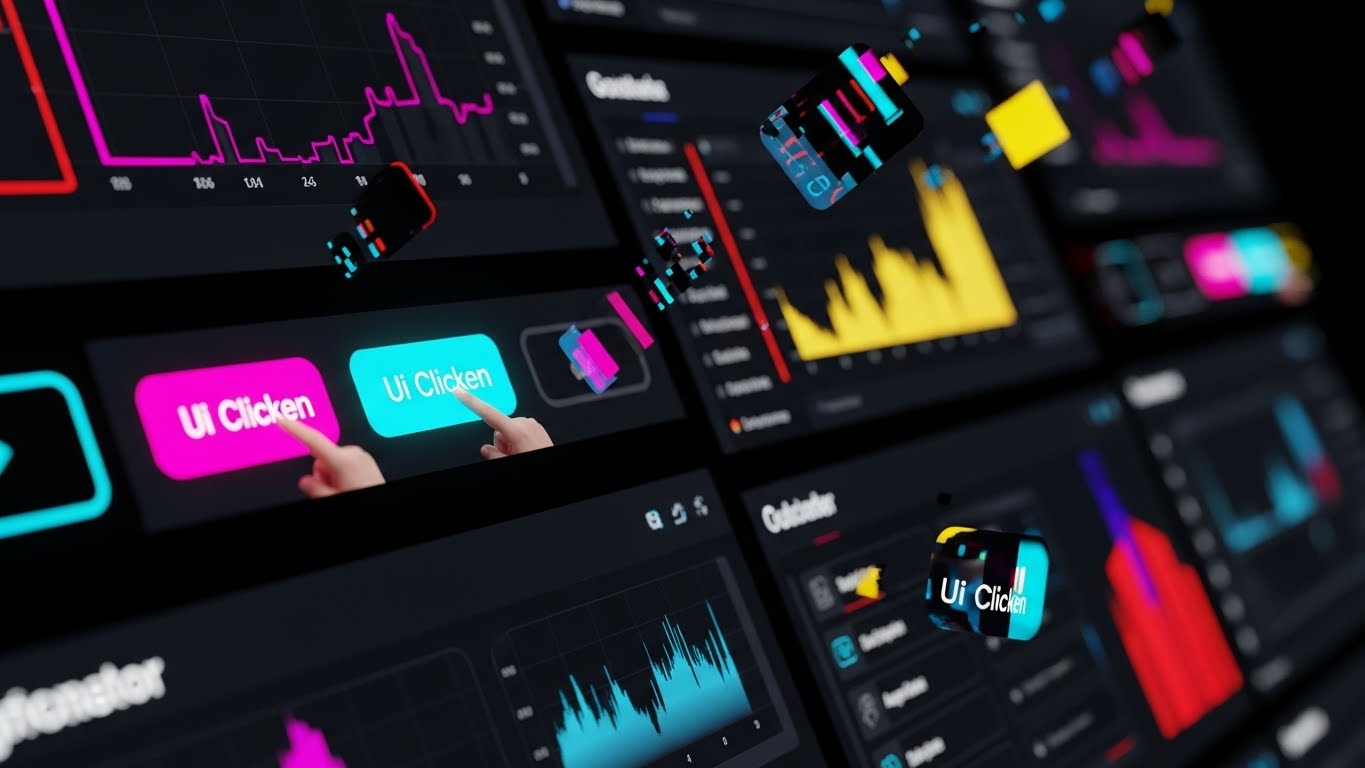
14. The Velocity Glitch (Style 19)
MOFU | Sales Velocity
The Visual & Narrative Approach
Visualization Scenario: A high-octane montage designed to convey raw speed. We see extreme macro close-ups of UI buttons in Magenta and Cyan being clicked. The edits are rapid-fire. Between clicks, the screen transitions use "glitch art" effects and motion blur to simulate high-speed data processing. We zoom into individual pixels and fly out to different dashboard screens in milliseconds.
Narration Style: Fast-paced, rhythmic, and urgent. Sound design is key here—clicks, swooshes, and digital processing sounds.
Psychological Impact & KPI Focus
- Niche Psychology: Addresses the universal hatred of "Lag." Dealers are impatient; they want software that moves as fast as they do. This style leverages Kinetic Energy to promise a lag-free, high-performance environment.
- Operational Impact: Focuses on Transaction Time and Sales Velocity. It implies the system will never be the bottleneck in a deal.
Strategic Implementation & Trade-offs
- Best Use Case: 15-second Video Ads on YouTube or Instagram Stories.
- Trade-off: Can be overwhelming. Not suitable for training or explaining complex workflows. It is purely a "Speed" play.
- Duration: 10-20 seconds.
Companies using similar video content -
ProMax – DMS & CRM – Accelerating sales processing with rapid system performance.
DriveCentric – CRM – Glitch-free, high-speed customer interaction and sales execution.
AutoAlert – Equity Mining – Rapidly identifying sales opportunities and accelerating outreach.
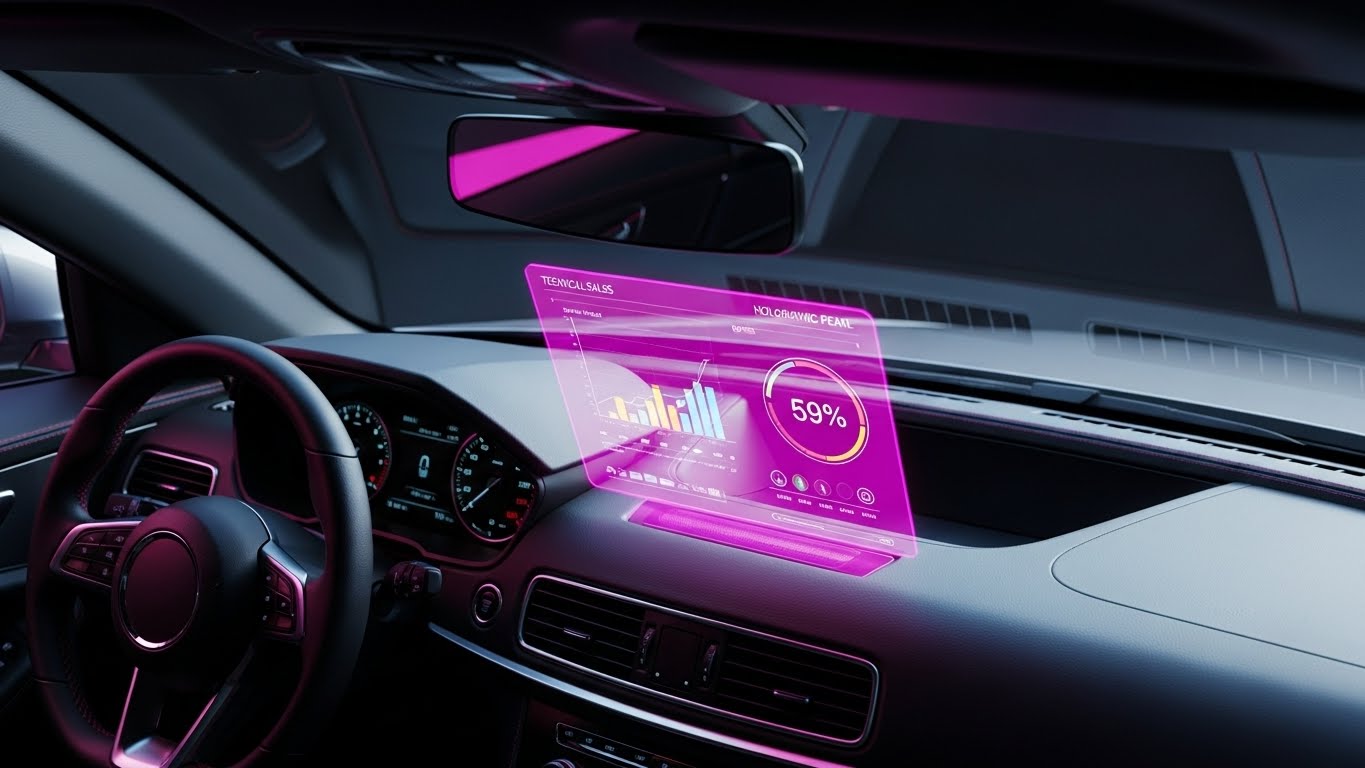
15. The Pilot's HUD (Style 24)
MOFU | Demand Gen
The Visual & Narrative Approach
Visualization Scenario: We sit in the driver's seat of a hyper-realistic luxury car. The dashboard is leather and chrome. Suddenly, a futuristic, Holographic Pearl UI projects from the dash onto the windshield (Heads Up Display style). It displays a sales chart and a "Deal Velocity" speedometer. The lighting is iridescent, reflecting off the leather, blending the physical drive with digital sales performance.
Narration Style: Aspirational and premium. "The cockpit of your business."
Psychological Impact & KPI Focus
- Niche Psychology: Appeals to the Car Enthusiast in every dealer. It bridges the gap between the product they love (cars) and the tool they use (DMS), framing the software as an integrated part of the driving experience.
- Operational Impact: Visualizes Real-Time Analytics and Mobility. It suggests the dealer can run their business from anywhere, even the driver's seat.
Strategic Implementation & Trade-offs
- Best Use Case: LinkedIn Hero Videos and Trade Show Booth Backdrops.
- Trade-off: High production cost. It creates a "Future State" vision that the actual current software UI might not match, so manage expectations carefully.
- Duration: 20-30 seconds.
Companies using similar video content -
VinSolutions (Cox Automotive) – CRM – Providing a holographic view of customer interactions and sales pipeline.
DealerSocket (CDK Global) – CRM – Integrating sales data into a real-time, mobile-friendly HUD.
Tekion – Automotive Retail Cloud – Offering a modern, integrated view of dealership performance.
16. The Tactile Trigger (Style 17)
MOFU | Functional Buyer

The Visual & Narrative Approach
Visualization Scenario: An extreme macro close-up of a pristine, White and Soft Grey interface. The depth of field is razor-thin, blurring everything except a single button that reads "Spring" (metaphor for action) or "Approve." We see a cursor enter the frame and click. The button depresses with a satisfying, tactile weight. The screen pixels are faintly visible, emphasizing the sharpness of the resolution.
Narration Style: Quiet, focused, and satisfying. The sound of the mouse click is amplified—a "trigger pull" for business execution.
Psychological Impact & KPI Focus
- Niche Psychology: Focuses on Micro-Interactions. For users who click buttons thousands of times a day, this style promises a satisfying, responsive, and clean UX. It validates the "Ease of Use."
- Operational Impact: Targets Workflow Efficiency. It highlights how a single, well-designed click can trigger complex backend processes (e.g., approving a warranty claim).
Strategic Implementation & Trade-offs
- Best Use Case: Email Marketing headers (GIFs) and Feature Release announcements.
- Trade-off: Very specific. It creates anticipation but doesn't explain the broader context of the feature.
- Duration: 3-5 seconds (Looping).
Companies using similar video content -
RouteOne – eContracting – Validating decisive action with satisfying, single-click contract approvals.
700Credit – Credit Reporting – Streamlining credit pulls with a responsive, tactile interface.
CVR (Computerized Vehicle Registration) – Registration & Titling – Enabling quick, precise actions for vehicle registration.
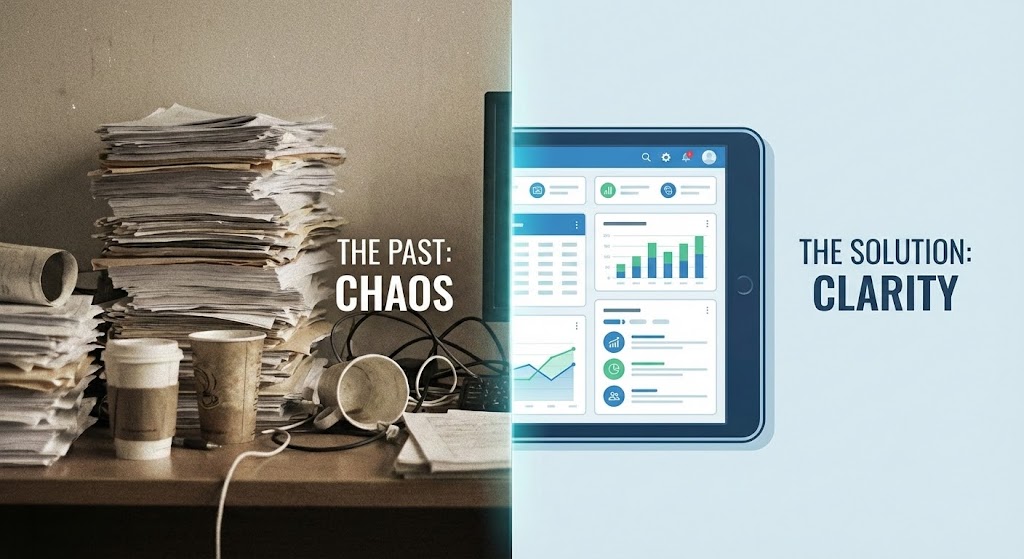
17. The Evolution Split (Style 27)
MOFU | Comp Comparison
The Visual & Narrative Approach
Visualization Scenario: A vertical line divides the screen. The Left side is a desaturated, grainy photo of a "Traditional" dealership desk—overflowing with paper stacks, coffee cups, and chaos (Warm/Sepia tones). The text reads "THE PAST: CHAOS." The Right side is a vibrant, crisp vector illustration of a clean tablet displaying organized graphs (Cool/Blue tones). The text reads "THE SOLUTION: CLARITY." The divider slides left, letting the solution consume the past.
Narration Style: Contrast-heavy. "Stop drowning in paper. Start swimming in data."
Psychological Impact & KPI Focus
- Niche Psychology: Leverages Loss Aversion and the desire for modernization. It visually validates the pain (chaos) the dealer feels and offers an immediate visual escape.
- Operational Impact: Visualizes Digital Transformation. It starkly contrasts the inefficiency of analog workflows with the streamlined nature of the DMS.
Strategic Implementation & Trade-offs
- Best Use Case: Remarketing Display Ads and Social Retargeting.
- Trade-off: A bit cliché ("Before/After"), but undeniably effective for audiences who haven't switched yet.
- Duration: 6-10 seconds.
Companies using similar video content -
Dealertrack (Cox Automotive) – DMS – Contrasting legacy systems with modern, streamlined solutions.
Dominion DMS – VUE – Highlighting the shift from chaotic paper to clear digital workflows.
CDK Global – Fortellis – Showcasing the evolution from fragmented systems to integrated platforms.
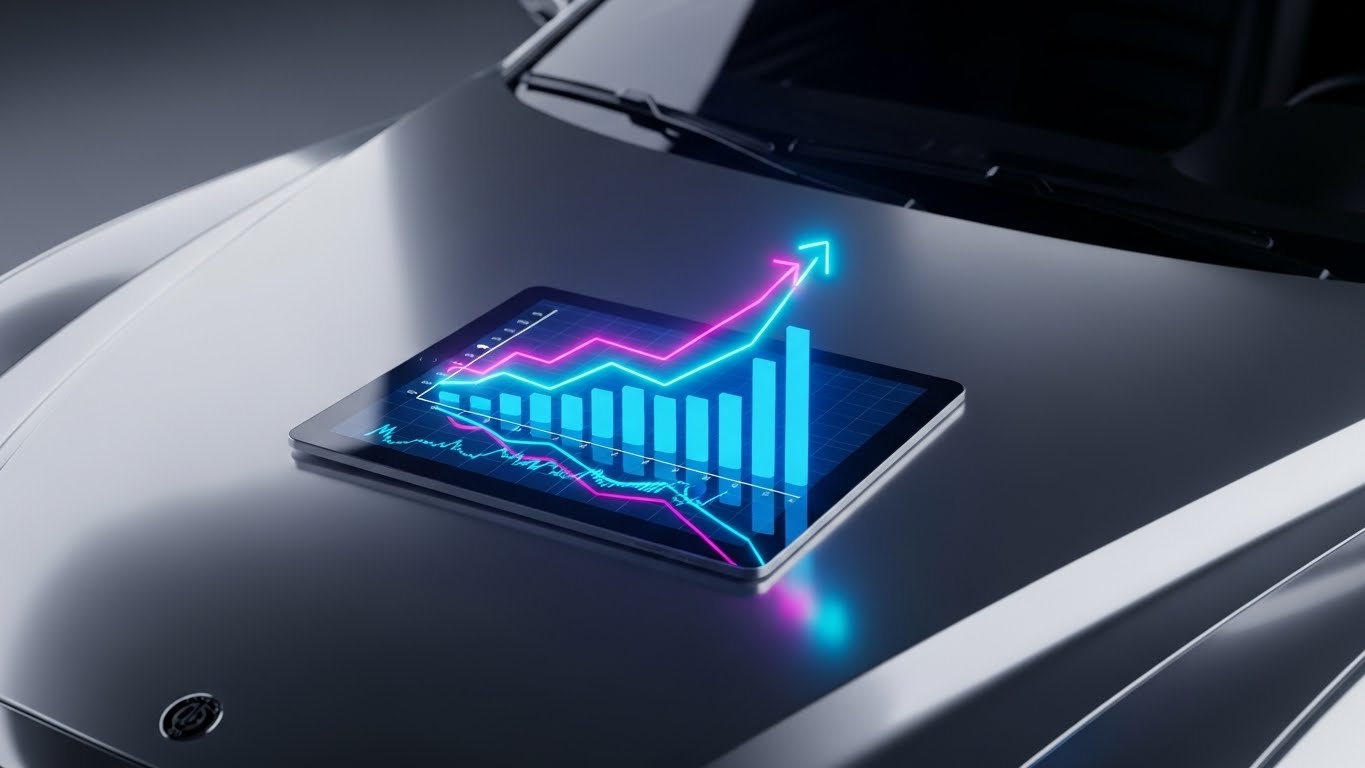
18. The Showroom Standard (Style 12)
BOFU | Economic Buyer
The Visual & Narrative Approach
Visualization Scenario: A scene of pure automotive luxury. A sleek, high-end digital tablet rests on the polished Metallic Silver hood of a luxury vehicle. The studio lighting reflects softboxes on the car's curves. On the tablet screen, a glowing Royal Blue line graph trends upward. The textures—paint, glass, metal—are indistinguishable from reality.
Narration Style: Premium, confident, and understated. "The standard for the modern retailer."
Psychological Impact & KPI Focus
- Niche Psychology: Appeals to the Economic Buyer (Dealer Principal/Owner). It aligns the software brand with the premium brands they sell (Mercedes, Lexus, BMW). It says, "This software is worthy of your showroom."
- Operational Impact: Focuses on Group Profitability and Brand Equity. It positions the DMS as a strategic asset that enhances the dealership's image.
Strategic Implementation & Trade-offs
- Best Use Case: Website Homepage (Hero Section) and Executive Briefings.
- Trade-off: Static. It sets a mood but tells no story. It serves as a "Trust Badge" rather than an explainer.
- Duration: Static or Slow Pan (10 seconds).
Companies using similar video content -
Reynolds and Reynolds – Retail Management System – Elevating brand prestige with a premium DMS solution.
CDK Global – DMS – Setting the standard for modern dealership operations and profitability.
Tekion – Automotive Retail Cloud – Projecting a high-end, integrated showroom experience.
19. The Momentum Tunnel (Style 8)
BOFU | ROI Hook

The Visual & Narrative Approach
Visualization Scenario: An abstract, high-energy composition in Crimson and Black. Diagonal lines race across the screen, forming a tunnel effect that pulls the viewer in. Inside this tunnel, stylized arrow shapes point aggressively upward and forward. The motion blur and speed lines create a feeling of irresistible forward momentum, symbolizing rapid financial gain.
Narration Style: Driving, percussive, and bold. "Accelerate your returns. Dominate your market."
Psychological Impact & KPI Focus
- Niche Psychology: Tap into the Competitive Drive of the sales floor. Dealers want to grow, win, and crush the competition. This style visualizes that aggression and success.
- Operational Impact: Visualizes ROI (Return on Investment) and Year-over-Year Growth. It is purely about financial momentum and market share.
Strategic Implementation & Trade-offs
- Best Use Case: Display Ads (Banner Blindness breakers) and Hype Reels at sales conferences.
- Trade-off: Zero informational content. It is purely emotional priming for a "Close the Deal" conversation.
- Duration: 5-8 seconds (Looping).
Companies using similar video content -
PureCars – Digital Advertising – Visualizing aggressive growth and accelerated ROI for dealerships.
LotLinx – AI-Powered Inventory Marketing – Driving forward momentum in inventory sales and profitability.
AutoAlert – Equity Mining – Creating irresistible forward momentum for sales and customer retention.
20. The Tangible Ecosystem (Style 10)
BOFU | ROI

The Visual & Narrative Approach
Visualization Scenario: We see a charming, "toy-like" isometric cutaway of a dealership office, rendered with a matte "clay" finish in Forest Green and Wood tones. It feels crafted and tactile. Inside this miniature room, stacks of tiny green cash bundles are neatly arranged next to miniature cars. The lighting is soft and global. It makes the complex business of a dealership look like a manageable, organized, profitable machine.
Narration Style: Grounded, reassuring, and stable. "Everything in its place. Every dollar accounted for."
Psychological Impact & KPI Focus
- Niche Psychology: Lowers Implementation Anxiety. Changing a DMS is scary; this style makes the new system look approachable, manageable, and "collectible." It satisfies the need for Control.
- Operational Impact: Visualizes Cash Flow and Operational Organization. It proves that the software creates a tidy, profitable environment.
Strategic Implementation & Trade-offs
- Best Use Case: LinkedIn organic posts and "Thank You" pages after a demo request.
- Trade-off: Can look too "cute" for some hardened corporate dealerships. Use it to disarm, not to intimidate.
- Duration: 15-30 seconds (Looping).
Companies using similar video content -
PBS Systems – DMS – Making dealership ROI tangible with organized, profitable workflows.
Quorum – XSellerate DMS – Creating a manageable, organized, and profitable dealership ecosystem.
DealerBuilt – LightYear DMS – Visualizing a tidy, profitable environment for dealership operations.
21. The Digital Vault (Style 16)
BOFU | Risk/Security

The Visual & Narrative Approach
Visualization Scenario: We shift to a "Dark Mode" aesthetic. A high-contrast scene in Matrix Green and Black depicts a digital vault door in the center of a monitor. The door is constructed from cascading binary code and ASCII characters. As it locks, the code solidifies into a steel-like texture. The aesthetic is heavily inspired by terminal code and cybersecurity interfaces, conveying impenetrable safety.
Narration Style: Serious, low-register, and guarded. The sound design features heavy mechanical locking sounds and digital encryption chirps.
Psychological Impact & KPI Focus
- Niche Psychology: Directly targets the IT Director's sleepless nights regarding ransomware and data breaches. It visualizes the DMS as a fortress, leveraging the "Security Theatre" effect to build trust.
- Operational Impact: Focuses on Data Integrity and Compliance (e.g., FTC Safeguards Rule). It reassures stakeholders that customer PII (Personally Identifiable Information) is locked down.
Strategic Implementation & Trade-offs
- Best Use Case: IT Security Decks and Technical Specification sheets.
- Trade-off: Intentionally intimidating. It is not "friendly," but security shouldn't feel friendly—it should feel strong.
- Duration: 10-15 seconds.
Companies using similar video content -
SecureClose – Digital Transaction Security – Encrypting dealer data and ensuring impenetrable safety.
DealerVault – Data Security Platform – Providing a digital vault for robust data protection and compliance.
ComplyAuto – Compliance Software – Solidifying data security with advanced encryption and regulatory adherence.
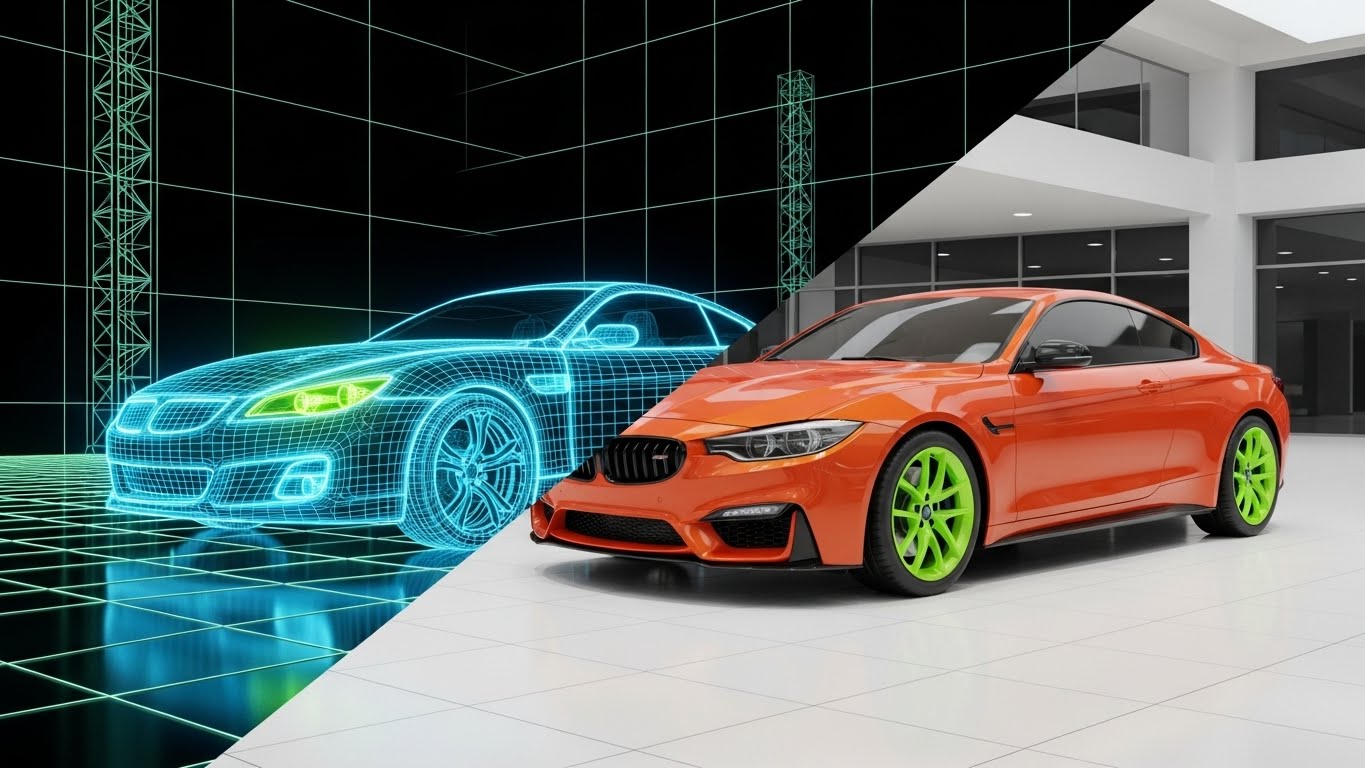
22. The Implementation Bridge (Style 26)
BOFU | Implementation
The Visual & Narrative Approach
Visualization Scenario: A split-screen transition. On the left, a car and showroom are depicted as a Blueprint Blue wireframe grid—representing the planning phase. As the camera tracks right, a "wipe" effect transforms the wireframe seamlessly into a solid, photorealistic Orange and White showroom floor. This visualizes the concept of "implementation" moving from plan to reality without friction.
Narration Style: Smooth and transformative. "From plan to performance in record time."
Psychological Impact & KPI Focus
- Niche Psychology: Mitigates Change Management Anxiety. Dealers fear the downtime associated with switching DMS providers. This style promises a glitch-free migration.
- Operational Impact: Visualizes Time-to-Value (TTV). It suggests that the gap between signing the contract and selling cars is minimal.
Strategic Implementation & Trade-offs
- Best Use Case: "Onboarding" section of the Website and Proposal documents.
- Trade-off: It is metaphorical. It doesn't show the actual data migration process (which is boring), so it sells the result of the migration.
- Duration: 10-12 seconds.
Companies using similar video content -
Tekion – Automotive Retail Cloud – Visualizing seamless setup and rapid time-to-value for new DMS implementations.
CDK Global – DMS Implementation Services – Bridging the gap from planning to a fully rendered, operational dealership.
Dealertrack (Cox Automotive) – DMS Migration – Transforming legacy systems into modern solutions without friction.
23. The Self-Serve Flow (Style 2)
Onboarding | Self-Serve

The Visual & Narrative Approach
Visualization Scenario: An elegant, continuous line art animation in Tangerine and White. A single, unbroken line draws a hand holding a smartphone. As the thumb taps the screen, the line morphs into a checkmark, then into a rising graph. The background is a subtle, textured white paper. The style is sophisticated, clean, and airy.
Narration Style: Light, acoustic, and organic. It emphasizes "simplicity," "mobility," and "autonomy."
Psychological Impact & KPI Focus
- Niche Psychology: Appeals to the Sales Consultant who wants to work from their phone, not be tethered to a desk. It leverages Minimalism to suggest the app is lightweight and easy to learn.
- Operational Impact: Targets Adoption Rates and Mobile Utilization. It positions the mobile app as an intuitive extension of the salesperson.
Strategic Implementation & Trade-offs
- Best Use Case: App Store Preview Videos and Internal Training Intros.
- Trade-off: Lacks detail. It captures the "vibe" of ease but cannot be used to teach specific feature workflows.
- Duration: 15-20 seconds.
Companies using similar video content -
DealerCenter – Mobile App – Simplifying mobile usage for sales and inventory management.
VinSolutions (Cox Automotive) – Connect Mobile – Enabling self-serve workflows for sales consultants on the go.
DriveCentric – Mobile CRM – Providing a continuous, simple flow for mobile customer interactions.
24. The Support Companion (Style 5)
Onboarding | Knowledge Base

The Visual & Narrative Approach
Visualization Scenario: A 3D character design in a Soft Blue and Beige palette, rendered in a friendly, high-quality style similar to feature animation. A professional support agent with a headset waves a friendly hand. They stand in a stylized help-desk environment with a floating 3D question mark icon nearby that turns into a lightbulb. The lighting is warm and inviting.
Narration Style: Warm, empathetic, and helpful. "Stuck? We're right here with you."
Psychological Impact & KPI Focus
- Niche Psychology: Counteracts the frustration of Automated Phone Trees. Dealers hate bad support. This style personifies the helpdesk, making the vendor feel like a partner rather than a faceless entity.
- Operational Impact: Visualizes Knowledge Base Accessibility. It encourages users to seek help, reducing frustration-driven churn.
Strategic Implementation & Trade-offs
- Best Use Case: Support Portal Login Screen and "Welcome" Emails.
- Trade-off: Can feel juvenile if not rendered with high-end textures. Must look "Pixar," not "Preschool."
- Duration: 10-15 seconds (Looping).
Companies using similar video content -
CDK Global – Customer Support – Humanizing tech support with a friendly, accessible companion.
Reynolds and Reynolds – Support Services – Providing empathetic and helpful support for dealership staff.
PBS Systems – Customer Care – Offering a supportive companion for all DMS-related queries.
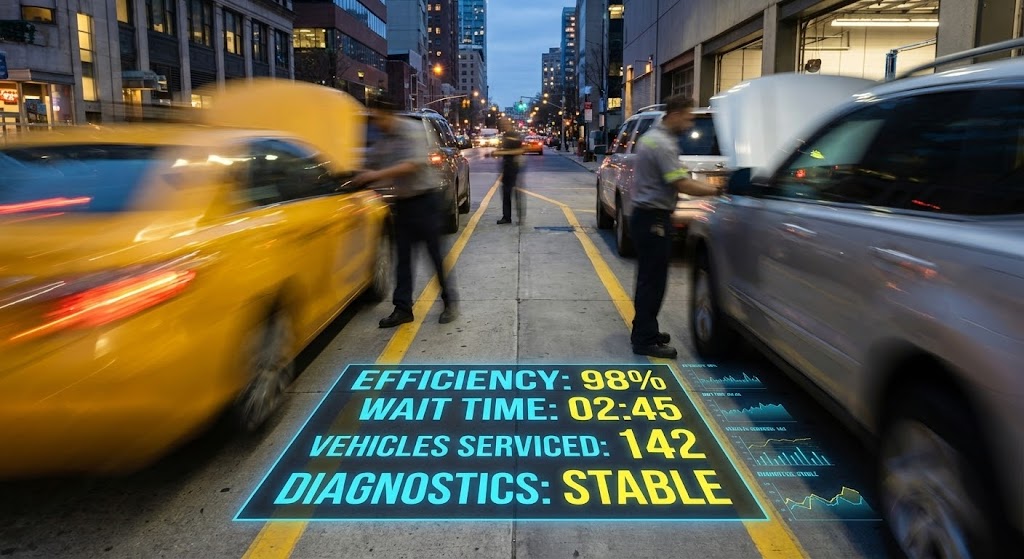
25. The Velocity Lapse (Style 22)
Retention | TTV
The Visual & Narrative Approach
Visualization Scenario: The camera is stationary in a busy service lane. Real technicians and cars move in a hyper-lapse blur (Urban Grey and Yellow palette), conveying the chaotic speed of the shop. In the foreground, a sharp, static digital overlay in Electric Blue displays "Efficiency: 98%" and "Wait Time: 02:45." The contrast highlights that while the physical world is frantic, the data remains stable and controlled.
Narration Style: Energetic but controlled. The sound design mixes fast-forward "wooshes" with a steady, calming digital hum.
Psychological Impact & KPI Focus
- Niche Psychology: Validates the Service Manager's reality—it's a zoo out there. The visual proves the software can keep up with the pace without adding to the chaos.
- Operational Impact: Visualizes Throughput and Service Cycle Time. It shows that the software brings calm/control to high-velocity environments.
Strategic Implementation & Trade-offs
- Best Use Case: Social Media (Instagram Reels) and Waiting Room screens.
- Trade-off: Requires high-quality stock or custom footage of a service lane. Poor footage will ruin the effect.
- Duration: 6-10 seconds (Looping).
Companies using similar video content -
Xtime (Cox Automotive) – Service Scheduling & Check-in – Stabilizing service data amidst chaotic shop activity.
Dealer-FX (CDK Global) – Service Platform – Bringing calm and control to high-velocity service environments.
Protractor – Shop Management Software – Overlaying clear data on busy service operations for efficiency.
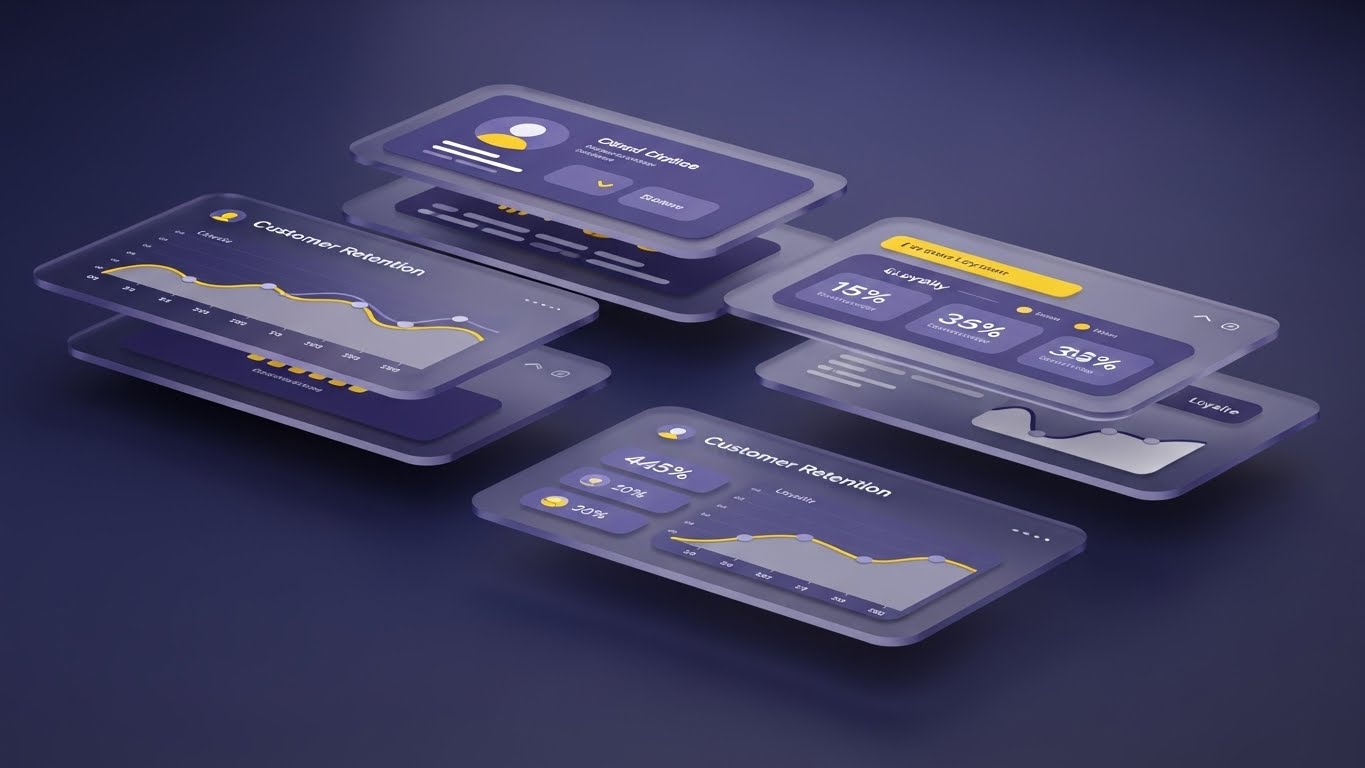
26. The Retention Deep Dive (Style 18)
Retention | Churn
The Visual & Narrative Approach
Visualization Scenario: A 3D parallax composition in Deep Indigo and Gold. Layers of semi-transparent glass UI screens float at different depths. The camera drifts slowly, revealing the separation between the layers. The content on the screens depicts customer retention curves, loyalty metrics, and lifetime value predictions. The aesthetic is deep, immersive, and analytical.
Narration Style: Intelligent and reflective. "See the depth of your relationships."
Psychological Impact & KPI Focus
- Niche Psychology: Appeals to the CRM Manager and Marketing Director. It visualizes the complexity of customer data as something beautiful and navigable, rather than a flat spreadsheet.
- Operational Impact: Focuses on LTV (Lifetime Value) and Churn Rate. It suggests that the software allows for a "deeper" understanding of the customer base.
Strategic Implementation & Trade-offs
- Best Use Case: Quarterly Business Review (QBR) presentations and Email Newsletters.
- Trade-off: Abstract. It sells the concept of deep analytics, not the specific report generation.
- Duration: 15-20 seconds.
Companies using similar video content -
AutoLoop – CRM & Marketing – Deepening customer insights with layered retention analytics.
VinSolutions (Cox Automotive) – CRM – Providing immersive, analytical views of customer loyalty and lifetime value.
DriveCentric – CRM – Revealing the depth of customer relationships through advanced data visualization.
27. The Executive Vision (Style 30)
Expansion | Upsell

The Visual & Narrative Approach
Visualization Scenario: A cinematic, 35mm film-style shot of a confident Dealership General Manager standing in an upscale, glass-walled lobby. The subject is a middle-aged professional with realistic skin texture and attire, shaking hands with an unseen partner. The lighting is natural and flattering (Golden Hour). The background is slightly out of focus, showing the depth of the showroom.
Narration Style: Aspirational and human. "Partnership. Growth. Success."
Psychological Impact & KPI Focus
- Niche Psychology: Uses Mirroring. The target audience (GMs/Owners) sees themselves in this confident, successful figure. It associates the software with their personal professional success.
- Operational Impact: Targets Brand Reputation and Dealer Group Expansion. It subtly suggests that using this software leads to the kind of success that allows for expansion.
Strategic Implementation & Trade-offs
- Best Use Case: Video Ads on LinkedIn and Pre-roll for Industry News sites.
- Trade-off: It's "Lifestyle" content. It builds brand affinity but explains zero features. Must be used for brand awareness.
- Duration: 15-30 seconds.
Companies using similar video content -
CDK Global – Enterprise Solutions – Projecting leadership confidence and strategic partnership for growth.
Reynolds and Reynolds – Corporate Solutions – Visualizing executive success and dealer group expansion.
Tekion – Automotive Retail Cloud – Embodying the aspirational vision of modern dealership leadership.
28. The Culture Builder (Style 21)
Expansion | Advocacy

The Visual & Narrative Approach
Visualization Scenario: A high-resolution aspirational image in Sun-kissed Gold and Sky Blue. A diverse group of dealership staff (sales, service, execs) are shown in a low-angle hero shot, high-fiving or cheering against a bright blue sky. The lighting is bright and optimistic. The image conveys team unity and the celebration of success driven by the platform.
Narration Style: Uplifting and communal. "One team. One platform. One goal."
Psychological Impact & KPI Focus
- Niche Psychology: Addresses Staff Morale. Dealerships have high turnover. This style frames the software as a tool that unifies the team and reduces friction-based arguments between departments.
- Operational Impact: Visualizes Employee Satisfaction and Cross-Departmental Collaboration.
Strategic Implementation & Trade-offs
- Best Use Case: Careers Page (Recruitment) and Social Media "Culture" posts.
- Trade-off: Can feel like generic stock photography if not carefully selected to look authentic to the auto industry.
- Duration: Static or Slow Zoom.
Companies using similar video content -
Podium – Interaction Management – Unifying dealership staff through improved customer communication.
DealerRater (Cars.com) – Reputation Management – Building a positive team culture through customer feedback.
KPA – HR & Compliance – Fostering a strong dealership culture through safety and training.
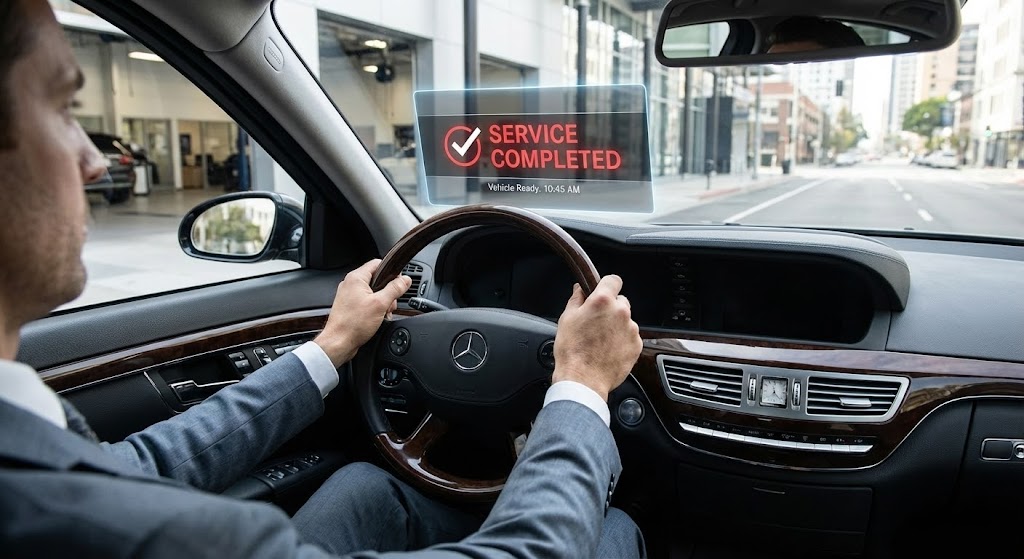
29. The Owner's Perspective (Style 20)
Expansion | Re-engagement
The Visual & Narrative Approach
Visualization Scenario: A first-person POV shot from inside a luxury car. The driver's hands (Steel Grey suit cuffs) are on the wheel. A digital UI overlay in Red and White floats near the dashboard, displaying a "Service Completed" notification or "Trade-In Value Alert." The aesthetic blends a realistic lifestyle photography feel with augmented reality elements.
Narration Style: Immersive and direct. "Stay connected to the drive."
Psychological Impact & KPI Focus
- Niche Psychology: Puts the dealer in the Customer's Shoes. It helps them visualize the end-user experience (the car buyer), validating the software's ability to improve the customer journey.
- Operational Impact: Targets CSI (Customer Service Index) and App Engagement. It shows how the software touches the actual driver.
Strategic Implementation & Trade-offs
- Best Use Case: Remarketing Ads to existing customers to upsell "Customer Experience" modules.
- Trade-off: Focuses on the end-consumer experience, which is indirect for the B2B buyer, but powerful for selling value.
- Duration: 10-15 seconds.
Companies using similar video content -
Dealer Inspire (Cox Automotive) – Digital Retailing – Connecting the drive to data from the customer's perspective.
Roadster – Express Storefront – Enhancing the customer journey with integrated digital experiences.
TruVideo – Video Communication – Providing a POV experience for service updates and sales walkarounds.
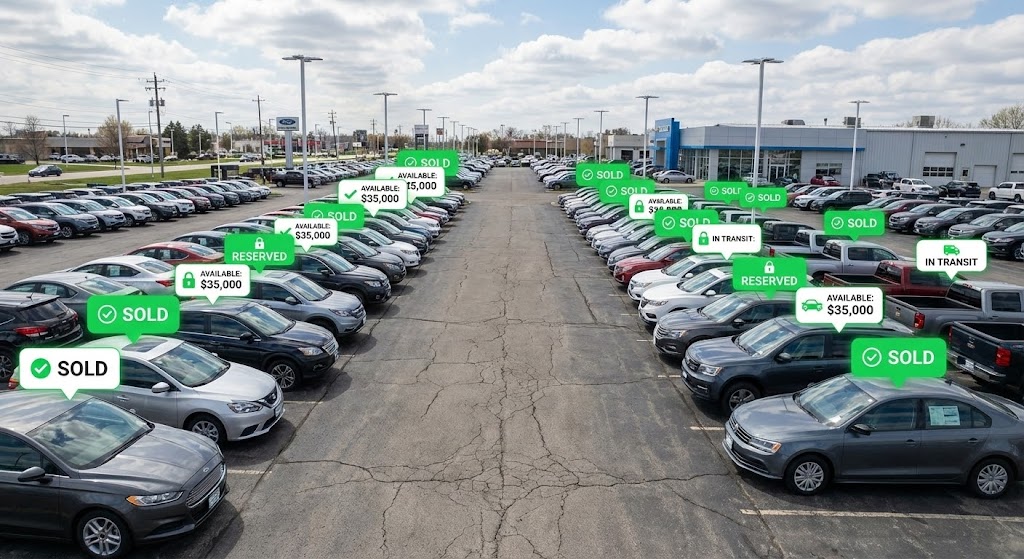
30. The Digital Twin (Style 23)
Expansion | Updates
The Visual & Narrative Approach
Visualization Scenario: A wide shot of a real car dealership lot filled with vehicles. Superimposed over the cars are crisp, 2D vector pop-up bubbles in Bright Green and White, showing price tags, "Sold" statuses, and "In Transit" icons. The contrast between the gritty asphalt reality and the clean vector graphics highlights the "Digital Twin" concept—the software overlaying reality.
Narration Style: Informative and modern. "Your lot, upgraded."
Psychological Impact & KPI Focus
- Niche Psychology: Appeals to the Inventory Manager. It visualizes the "God View" of the lot. It satisfies the need to know the status of every asset instantly.
- Operational Impact: Visualizes Inventory Visibility and Lot Management. It demonstrates how the digital layer enhances physical control.
Strategic Implementation & Trade-offs
- Best Use Case: Newsletter Updates regarding new inventory features.
- Trade-off: Requires a good "plate" (background video) of a dealership lot.
- Duration: 15-20 seconds.
Strategic Knowledge Base: The Visual Operations Doctrine
To move beyond "pretty pictures" and transform these 30 styles into a business asset, we must apply a strategic framework. This section outlines how to operationalize visual content to drive adoption, efficiency, and ROI within the automotive retail environment.
Strategic Alignment & Visual Architecture
The "Pre-Production" Strategy. Why and Who.
- The Cognitive Load Audit: Before creating assets, audit the current "screen time" of your users. A Service Advisor toggling between 5 screens needs Style 4 (Velocity Engine) for quick wins, not Style 11 (Digital Nervous System). Reduce load, don't add to it.
- Role-Based Visual Mapping: Differentiate your visual language. Use Mobile-First/Simple (Style 23) for Technicians and Salespeople who are on their feet. Reserve Dense/Data-Rich (Style 1) for Controllers and Fixed Ops Directors sitting at desks.
- The "Glanceability" Standard: In a high-stress service lane, information must be consumed in under 2 seconds. Prioritize high-contrast, large-text visuals (Style 14) for operational alerts.
- Brand Voice Consistency: Your visual language must be unified. Ensure the "Green" used in your Style 16 (Dark Mode) security visuals matches the "Green" in your Style 7 (Efficiency Untangler). Inconsistency breeds distrust.
- The Advids Strategic Audit: Partner with Advids to define this "Visual Operating System" before production begins. We align your visual palette with your specific operational goals, ensuring every pixel serves a KPI.
- Standardization vs. Customization: For general training, use standardized "Stock" assets (Style 28). For specific workflow training (e.g., "How to Close an RO"), investing in bespoke motion graphics (Style 8) reduces support tickets.
- The Cross-Departmental Bridge: Use visuals to unify terminology. If Sales calls it a "Trade-in" and Service calls it an "Acquisition," use Style 7 to visually link these terms, breaking down silos.
- Legacy System Integration: Visualizing the connection between old AS400 "Green Screens" and your new cloud UI is critical. Use Style 26 (Wireframe to Reality) to show that the old data isn't lost, just upgraded.
- Accessibility in the Shop: Your technicians are diverse. Use Style 2 (Line Art) and visual icons rather than text-heavy videos to overcome language barriers in the service bay.
- The Mobile-First Mandate: 60% of DMS interaction happens away from a desk. Ensure all 30 styles are legible on a 6-inch screen. If it doesn't work on mobile, it doesn't work for the dealer.
Operational Adoption & Implementation
The "Deployment" Phase. How to embed visuals into the workflow.
- Overcoming "Big Brother" Anxiety: When introducing efficiency tracking, staff can feel monitored. Use Style 28 (Culture Builder) to frame the software as a tool for team success, not individual surveillance.
- The Micro-Learning Shift: Kill the PDF manual. Replace it with a library of 30-second clips using Style 15 (Frictionless Interface). Technicians will watch a video; they will not read a handbook.
- Just-in-Time Support: Embed specific visual styles directly into the DMS help menu. When a user hovers over "Monthly Close," a Style 1 (Executive Control) video should auto-play to guide them.
- Gamification of Training: Use Style 3 (Process Blueprint) to create "Level Up" visuals. Show technicians their progress through training modules as a visual map, boosting engagement.
- Reducing Support Ticket Volume: There is a direct correlation between proactive visual guides and reduced call center load. If 30% of tickets are "Password Reset," a 5-second Style 16 GIF in the login box solves it.
- Remote Onboarding: Dealers are geographically dispersed. Use Style 5 (Support Companion) and screen-casts to train new hires remotely, ensuring consistent training quality across all rooftops.
- Standard Operating Procedures (SOPs): Transform text-based SOPs into visual process flows using Style 7. A visual "Service Road to the Sale" is memorable; a text list is forgotten.
- Feedback Loops: Use interactive video elements. After a Style 15 tutorial, pop up a "Was this helpful?" emoticon. Use this data to refine your visual assets.
- Scalable Localization: If you serve dealers in Quebec or Spanish-speaking regions, design your Style 2 and Style 9 assets with text-free icons so they require zero translation.
- Leadership Communication: When the Dealer Principal needs to announce a software change, don't send an email. Use Style 27 (Executive Vision) to create a high-production video message that commands attention.
Measuring Impact & Future-Proofing
The "ROI" Phase. Measuring success and looking ahead.
- Beyond "Views": Don't just count video views. Measure Time-to-Competency. Did the group that watched the Style 11 training close their month faster than the group that didn't?
- The "Idle Time" Metric: Correlate better visualization with reduced software navigation time. High-quality UI visualization (Style 15) should lead to fewer clicks and less "hovering."
- Compliance Velocity: When new FTC rules drop, measure how fast your dealer base confirms compliance after watching a Style 21 (Digital Vault) explainer versus a text bulletin.
- Retention and Churn: High-quality UX visualization improves perceived value. Track the Net Promoter Score (NPS) of users exposed to your high-end Style 18 retention content.
- The AI Visual Frontier: Prepare for the future. Style 30 (Gen AI) is just the start. Soon, you will need real-time, AI-generated video support for every unique user query.
- Scalability of Assets: Build a library, not a landfill. Organize your source files for Style 20 and Style 8 so they can be easily updated when your UI changes, without re-shooting everything.
- The Advids Partnership: Scalability requires a partner. Advids acts as your visual infrastructure, maintaining the quality and consistency of your asset library as your feature set grows and evolves.
- Benchmarking Success: "Good enough" visuals are a competitive risk. If your competitor uses Style 11 (3D Nervous System) and you use static screenshots, you look like the legacy option.
- The ROI of Safety: For Fixed Ops, visualize safety protocols. Quantify the reduction in shop accidents or insurance premiums achieved through better visual safety training (Style 25).
- Final Call to Innovation: Treat video as infrastructure, not content. In the AI era, your visual data is your product. Invest in it, structure it, and use it to drive the velocity of your dealership clients.
Companies using similar video content -
Impel – Digital Merchandising – Augmenting physical inventory with digital twin overlays and insights.
SpinCar – 360° Vehicle Imaging – Creating a digital twin of inventory with interactive visuals.
LotLinx – Inventory Marketing – Overlaying real-time data on physical inventory for enhanced visibility.
Author & Editor Bio


