
 /home/wwwroot/advids.co/design/index.php on line 425
Introduction: The Visual Engine of the "Phygital" Dealership
The automotive industry is currently navigating its most significant pivot in a century: the collapse of the barrier between the digital showroom and the physical lot. For marketing leaders in the Automotive SaaS space, this "Phygital" revolution presents a massive opportunity. The global automotive software market size is projected to grow from USD 36.07 billion in 2025, signaling that dealerships are no longer just buying "tools"—they are investing in a completely new operational infrastructure.
However, a critical friction point remains. Software is invisible. Algorithms, API integrations, and equity mining tools are abstract concepts that are notoriously difficult to explain to a busy General Manager or Dealer Principal. The "Physical/Digital Divide" creates skepticism; dealers need to see how the code impacts the metal. They are driven by velocity and efficiency—data shows that dealers who respond to leads within 10 minutes see a 3X increase in sales. Your marketing visuals must promise this same level of speed and seamlessness.
If your video content relies on static screen recordings or generic stock footage, you are signaling "legacy tech" in a market hungry for innovation.
This guide acts as your visual blueprint. We have curated 30 distinct video styles (Part 1 covers the first 8) specifically mapped to the B2B automotive funnel. From Bold Kinetic Typography that captures the adrenaline of a sales event to Clean UI Workflows that visually prove ease-of-use, these examples are strategic frameworks designed to reduce cognitive load and accelerate adoption. They transform your software from an "expense" into an essential engine of growth.
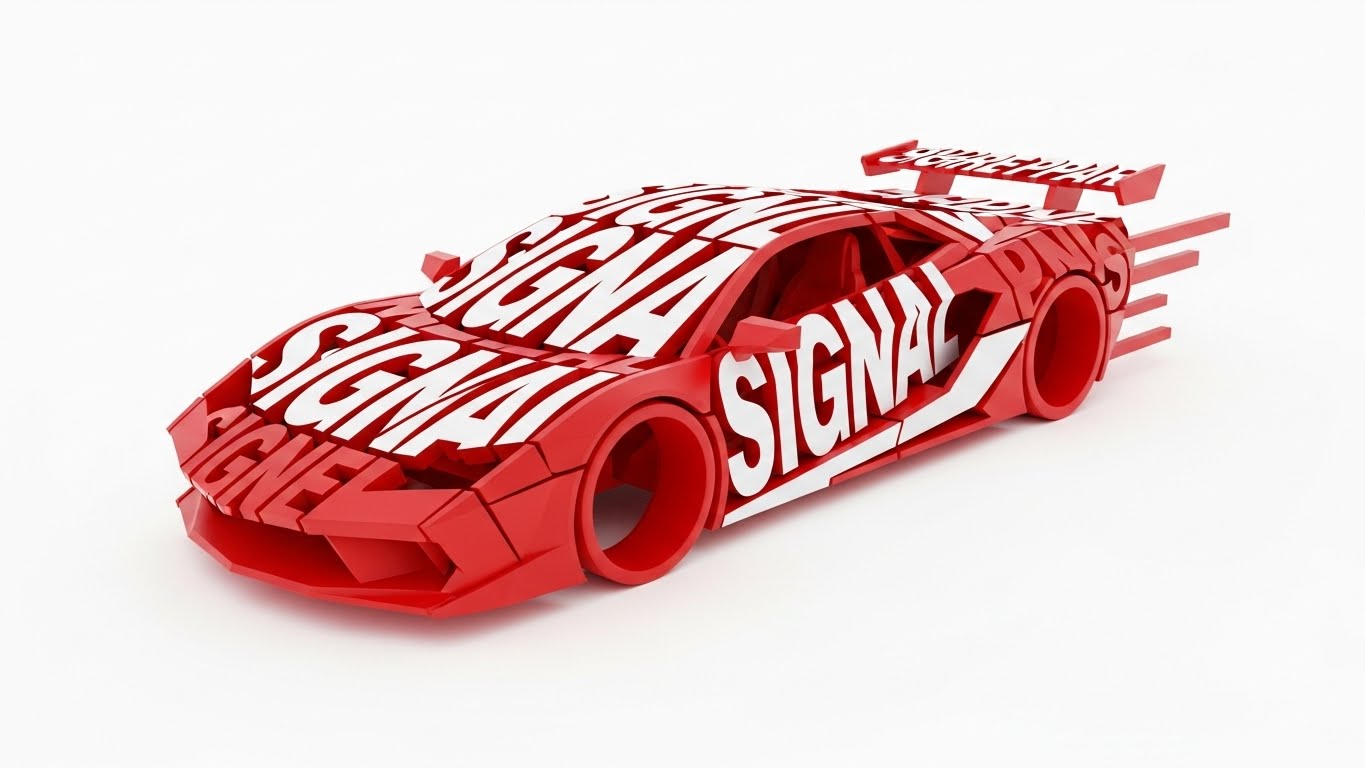
1. Bold Kinetic Typography
TOFU | Brand Awareness
- The Visual & Narrative Approach
Visualization Scenario:
This style abandons traditional imagery to rely entirely on the physics of motion and text. A 2D visual composition is built from bold, blocky shapes in a high-contrast palette of Signal Red and Pure White. These shapes abstractly form the silhouette of a speeding sports car, but the "bodywork" is composed of heavy typography elements. The blocks are slanted forward, mimicking the aerodynamic lines of a hood and roofline to convey aggressive velocity. The background remains a stark, solid white, allowing the red geometric forms to pop with sharp, hard edges.
- Psychological Impact & KPI Focus
Niche Psychology:
General Managers operate in a high-adrenaline environment. They respond to "Sales Velocity." By using Kinetic Typography—text that moves with the weight and momentum of a physical vehicle—you trigger a visceral response. It bypasses the logical brain and hits the emotional center that craves speed.
Operational Impact:
It visually solves the "Invisibility" problem. It turns abstract concepts like "Lead Velocity" or "Rapid Response" into a tangible, moving object.
- Strategic Implementation & Trade-offs
- Best For: TOFU Social Ads (Instagram/LinkedIn) announcing new feature launches or flash incentives.
- Trade-off: This style is high-energy but low-information. It is excellent for Brand Awareness but suboptimal for explaining complex features. Use it to get the click, not to close the deal.
Companies using similar video content -
DriveCentric – AI-Powered Automotive CRM – Accelerate lead response and sales velocity.
Matador AI – AI Sales Agent – Automate sales conversations, engage leads instantly.
2. Abstract 2D Motion Graphics
TOFU | Category Creation

- The Visual & Narrative Approach
Visualization Scenario:
A flat vector style that tells a story of assembly. Geometric shapes in Electric Blue, Charcoal, and White morph, slide, and interlock to form a structured grid, eventually resolving into the shape of a car. The composition operates on a straight-on 2D plane with smooth motion blur on transitions. The background is a minimalist white digital canvas. The visual metaphor is one of "solving"—the chaotic pieces of the market assembling themselves into a coherent solution.
- Psychological Impact & KPI Focus
Niche Psychology:
Marketing Directors often feel overwhelmed by "fragmentation"—too many tools, too much siloed data. This style leverages Gestalt principles to provide "Cognitive Closure." Seeing the shapes snap into a unified form subconsciously promises that your software will organize their chaos.
Operational Impact:
It positions the brand as a "Category Creator." It implies that your platform is the structure that holds the entire dealership ecosystem together.
- Strategic Implementation & Trade-offs
- Best For: Website Headers and "Vision" videos where you need to explain a high-level concept (e.g., "Connected Retailing") rather than a specific feature.
- Trade-off: It can feel too abstract for pragmatic buyers (e.g., Fixed Ops Directors) who want to see the actual dashboard.
Companies using similar video content -
Tekion DMS – Automotive Retail Cloud – Unify dealership operations with cloud platform.
Fullpath – AI-Powered Solutions – Optimize operations, enhance customer experiences.
5. Minimalist Flat 2D Vector
TOFU | Vertical Social

- The Visual & Narrative Approach
Visualization Scenario:
Designed strictly for vertical mobile screens (9:16), this style strips away all noise to focus on workflow efficiency. A simple, thick-line vector illustration depicts a Service Advisor (female icon) at a desk seamlessly passing a task—represented by a golden arrow—to a Technician (male icon). The palette uses Navy Blue for uniforms and Paper White for the background, devoid of shadows. The motion is linear and direct, visualizing the "handoff" without friction.
- Psychological Impact & KPI Focus
Niche Psychology:
Service staff often view new software as a burden. This style combats that anxiety by presenting the workflow as simple, clean, and helpful. It respects their time by removing visual clutter.
Operational Impact:
It highlights "Process Efficiency." By visually simplifying the interaction between departments (Front of House vs. Back of House), it suggests the software is easy to learn and improves team collaboration.
- Strategic Implementation & Trade-offs
- Best For: TikTok and Vertical Social content targeting dealership employees and middle management.
- Trade-off: It lacks "Enterprise Gravity." It creates a fun, accessible vibe but may not convince a C-Suite executive of the platform's robust power.
Companies using similar video content -
Affinitiv Inc – Customer Lifecycle Solutions – Data-driven marketing for automotive customer lifecycle.
Spireon – NSpire Platform – Telematics solutions for tracking and managing assets.
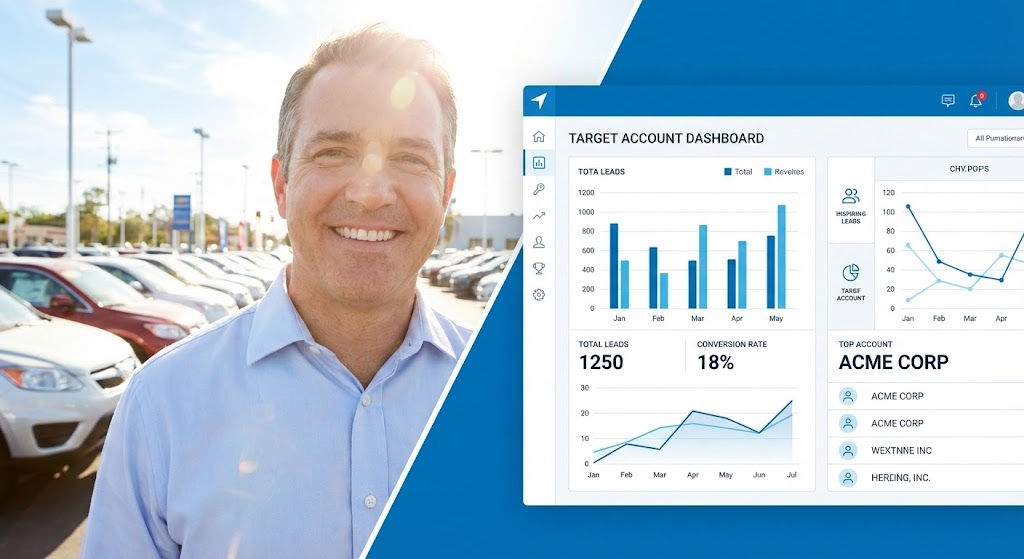
6. Split Screen: Optimized Reality
TOFU | ABM Awareness
- The Visual & Narrative Approach
Visualization Scenario:
A split-screen composition that connects cause and effect. The left side is a bright, high-key photo of a dealership General Manager smiling in a sunny car lot. The right side is a crisp, vector-style UI graphic in Tech Blue displaying a "Target Account" dashboard. The dividing line is a sharp diagonal, visually bridging the human success with the software precision.
- Psychological Impact & KPI Focus
Niche Psychology:
Skepticism is high in B2B auto. Buyers don't trust screenshots alone; they want to see the human impact. This style utilizes "Trust Transfer" by associating the cold UI (Right) with the warm, authentic emotion of the successful dealer (Left).
Operational Impact:
It effectively visualizes Account Based Marketing (ABM) success. It shows that specific digital actions lead to specific physical outcomes (happier staff, more sales).
- Strategic Implementation & Trade-offs
- Best For: LinkedIn Sponsored Content and Case Study headers.
- Trade-off: Requires high-quality photography. If the stock photo looks generic or "cheesy," it devalues the perceived quality of the software.
Companies using similar video content -
Affinitiv Inc – Customer Lifecycle Solutions – Data-driven marketing for automotive customer lifecycle.
Spireon – NSpire Platform – Telematics solutions for tracking and managing assets.
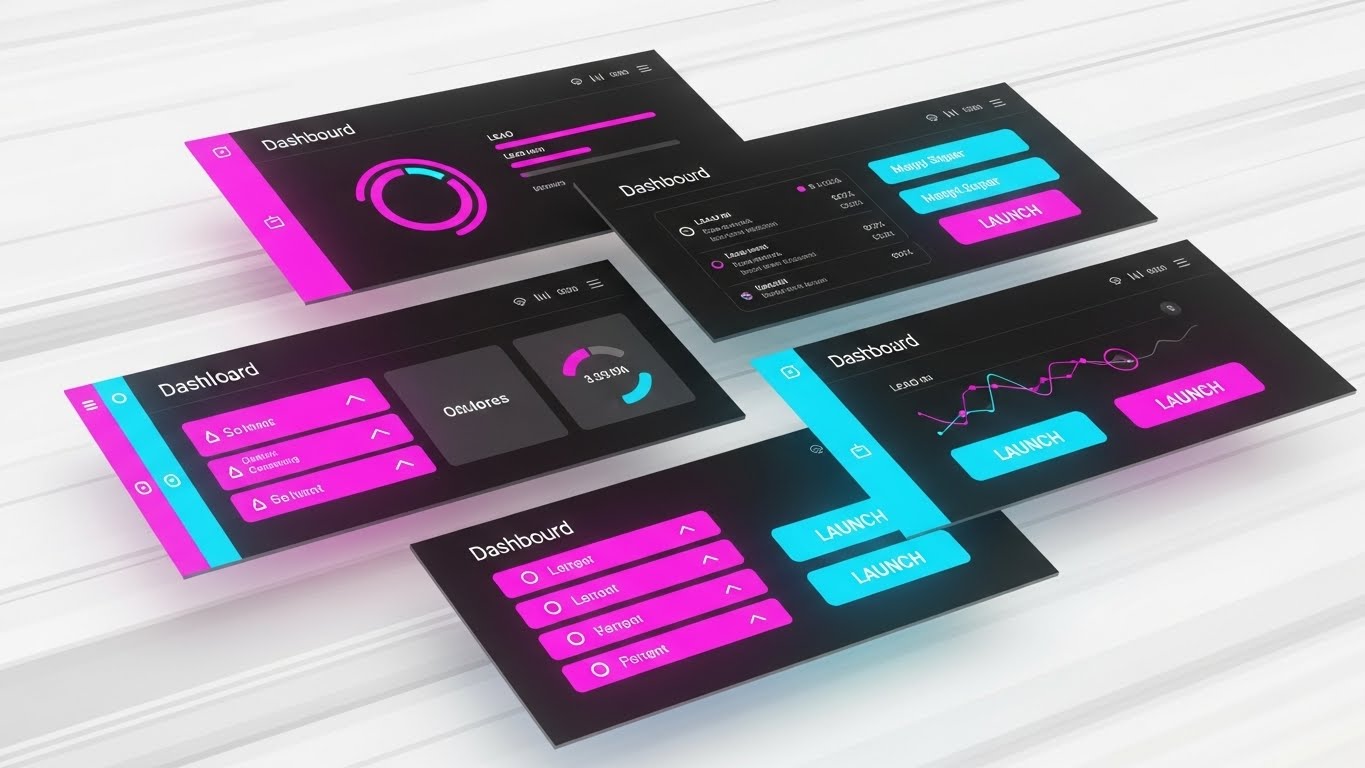
7. Rapid UI Feature Montage
TOFU | Skippable Pre-Roll
- The Visual & Narrative Approach
Visualization Scenario:
A composition simulating a rapid montage of UI screens for a power user. Multiple slanted panels of the software interface fly through 3D space. The screens display vibrant Magenta and Cyan data visualization widgets—pie charts, lead lists, and "Launch" buttons—against a "Dark Mode" background. Speed lines and motion blur suggest rapid workflow and high-volume data processing.
- Psychological Impact & KPI Focus
Niche Psychology:
This style appeals to the "Power User" or BDC Manager who equates feature density with value. It triggers "FOMO" (Fear Of Missing Out) by suggesting the platform is robust, fast, and packed with tools.
Operational Impact:
It visually asserts "Capability." Even if the viewer cannot read every number, the sheer volume of screens implies a comprehensive solution that handles high-speed retail environments.
- Strategic Implementation & Trade-offs
- Best For: YouTube Skippable Pre-Rolls (Goal 4.1). You need to show massive value in 5 seconds.
- Trade-off: It creates high cognitive load. Viewers won't retain specific details. Use it to create an impression of power, not to teach a workflow.
Companies using similar video content -
AutoSoft DMS – Streamline dealership operations, boost efficiency and profits.
DealerCenter – Manage, sell, and advertise vehicle inventory from one program.
8. Isometric 2D Motion Design
MOFU | Demand Gen

- The Visual & Narrative Approach
Visualization Scenario:
An isometric "God's Eye View" of a perfectly organized dealership lot. The floor is a Slate Grey grid. On the grid are identical, simplified white vehicle icons arranged in neat rows. Above selected cars, small vibrant Orange notification bubbles float, indicating status updates. The design is flat but uses isometric perspective to show depth and volume.
- Psychological Impact & KPI Focus
Niche Psychology:
Inventory Managers and CFOs constantly worry about "Lost Units" or "Aging Inventory." This style provides a sense of omniscience and control. The grid structure implies logic, order, and precision.
Operational Impact:
It visualizes "Inventory Turn" and "Logistics." The movement of the notification bubbles can show cars moving off the lot, directly linking the software to the core business goal of moving metal.
- Strategic Implementation & Trade-offs
- Best For: Explaining logistics, inventory tracking, or multi-location management features on LinkedIn.
- Trade-off: It can feel detached or "game-like." It appeals to the logical brain (Left Brain), not the emotional brain.
Companies using similar video content -
DealerSocket – CRM – Manage customer data, automate marketing campaigns.
VinSolutions – CRM – Combine CRM with inventory management, improve lead tracking.
9. Abstract 2D Glossy Vector
MOFU | Prog. Display

- The Visual & Narrative Approach
Visualization Scenario:
Abstract 2D flat vector motion graphics with glossy, premium textures. Liquid-like shapes in Liquid Metal and Royal Purple flow vertically across the screen. These amorphous blobs coalesce in the center to form a recognizable, stylized shape of a bar graph. The surfaces have high-gloss highlights, looking like molten metal or mercury.
- Psychological Impact & KPI Focus
Niche Psychology:
For Enterprise clients, standard flat vectors can sometimes look "cheap." This glossy, fluid aesthetic signals "Premium" and "Modern." It mimics the high-end design language of consumer tech brands.
Operational Impact:
It visualizes "Seamless Integration." The way the fluids merge represents the frictionless flow of data between the website, CRM, and DMS—solving the "Siloed Data" problem visually.
- Strategic Implementation & Trade-offs
- Best For: Background loops for Programmatic Banner Ads or high-level brand awareness videos.
- Trade-off: Style over substance. It captures attention and builds brand equity but explains nothing about how the software works.
Companies using similar video content -
ProMax Unlimited – Front End Solution – Complete front-end solution for desking, CRM, websites.
Dabadu XRM – All-in-one platform for lead, communication, inventory.
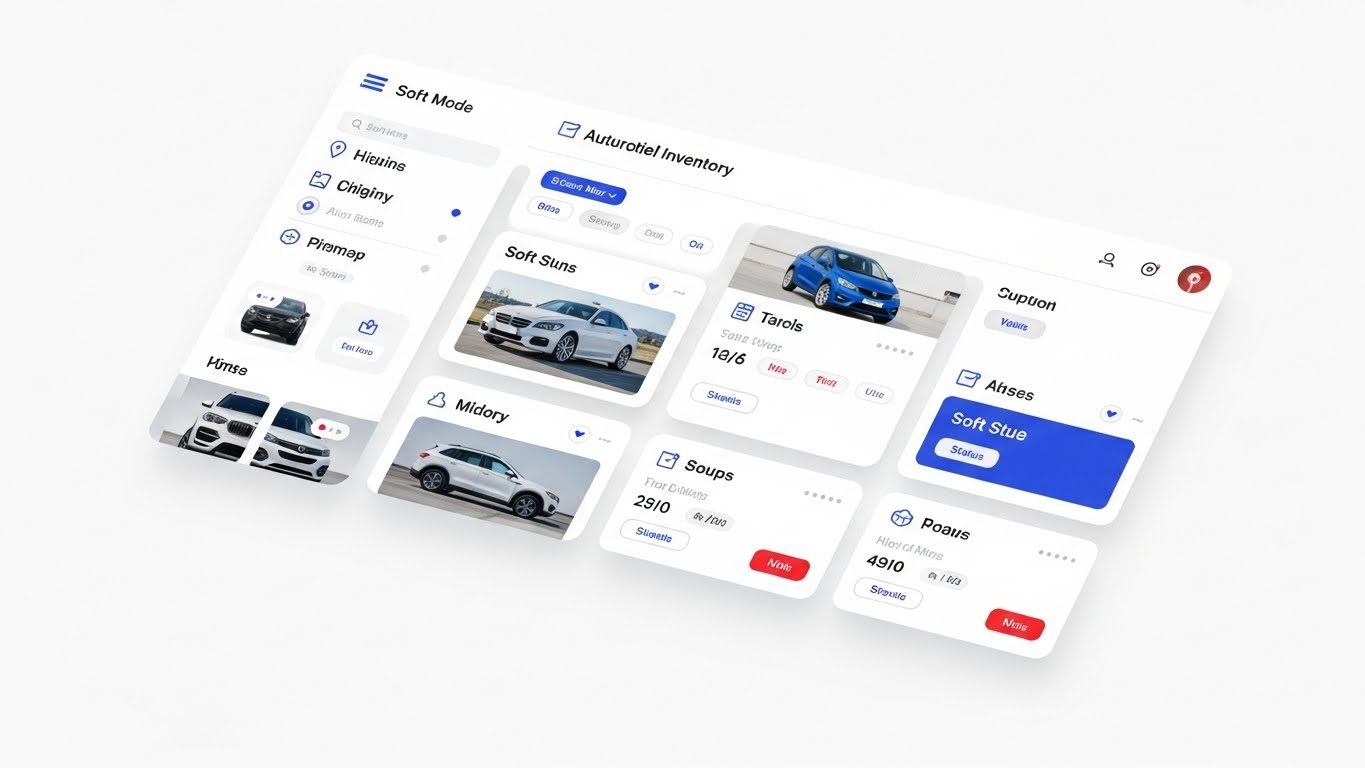
10. Clean UI Workflow (Light)
MOFU | Feature Education
- The Visual & Narrative Approach
Visualization Scenario:
A pristine, high-fidelity UI mockup of an automotive inventory platform. The interface uses a Material Design aesthetic with a palette of Airy White, Soft Grey, and Royal Blue. The screen displays a grid of vehicle thumbnails with status tags. The lighting is soft studio lighting, creating gentle drop shadows on the UI cards. The background is pure white.
- Psychological Impact & KPI Focus
Niche Psychology:
At the educational stage, the buyer's anxiety is: "Is this hard to use?" This clean, bright style lowers cognitive load. It signals that the tool is modern, approachable, and won't require weeks of training.
Operational Impact:
It serves as "Feature Validation." It proves the marketing claims by showing the actual (idealized) product in action, building trust in the UX/UI.
- Strategic Implementation & Trade-offs
- Best For: Website Product Pages and deeper funnel "How-to" videos.
- Trade-off: It requires a high-fidelity mockup. If your real software UI is cluttered or dated, this style will highlight the gap between the marketing and the reality.
Companies using similar video content -
vAuto – Inventory Management – Optimize new and used inventory with data.
DealerSocket – Inventory+ – Maximize Profit Per Day with data-driven inventory.
11. Wireframe to Reality
MOFU | Differentiation
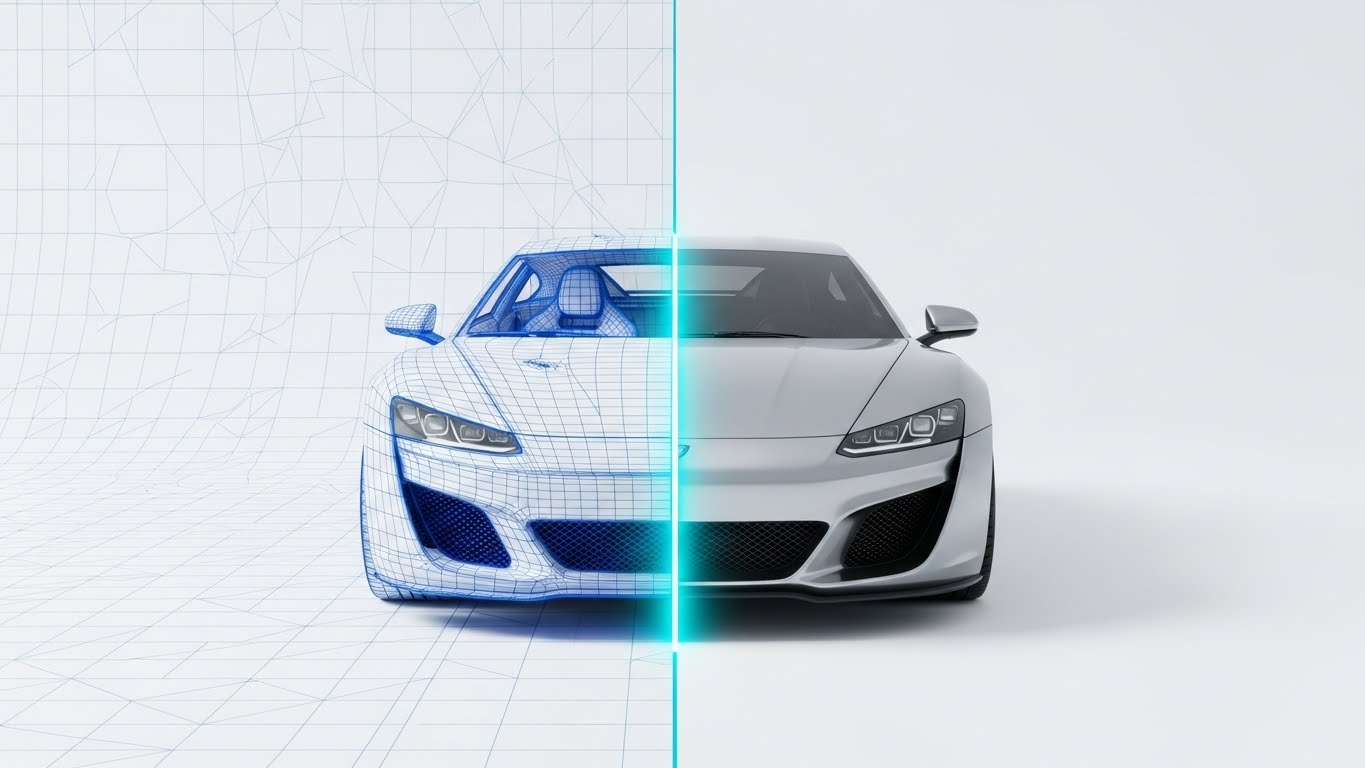
- The Visual & Narrative Approach
Visualization Scenario:
This style utilizes a sophisticated "reveal" technique to visualize the depth of your platform's data capabilities. A 3D composition centers on a sports vehicle in transition. The left half is rendered as a technical Blueprint Blue wireframe grid against a clean white background, representing raw data structure. A glowing cyan scanner line moves across the chassis, transforming the wireframe into a fully rendered, photorealistic Pearl Silver finish on the right. This visualizes the software’s role in turning raw inventory data into a premium, tangible asset.
- Psychological Impact & KPI Focus
Niche Psychology:
Dealers are wary of "Vaporware." They need to see that the shiny frontend is supported by a robust backend. This style visually demonstrates substantiation. By showing the skeletal structure (data) becoming a solid object (sales), you subconsciously prove that your solution is grounded in reality.
Operational Impact:
It effectively visualizes "Equity Mining" or "Merchandising." It shows how the software takes partial customer data (the wireframe) and builds it into a complete, actionable deal (the rendered car).
- Strategic Implementation & Trade-offs
- Best For: Product differentiation videos and "How It Works" sections explaining data enrichment or VIN decoding.
- Trade-off: It feels technical. It appeals to the CTO or IT Director (the technical validators) more than the average sales associate.
Companies using similar video content -
Cox Automotive – Digital Retailing – Unify marketing, retail, inventory solutions.
Autofi – Digital Retailing Platform – Seamless digital car buying experience.
12. 2D Line Art Animation
MOFU | Competitive Disp.

- The Visual & Narrative Approach
Visualization Scenario:
To contrast the complexity of legacy systems, this style uses a sophisticated, minimalist continuous line animation. On a textured Paper White background, a single fluid Charcoal line sketches a stalk of wheat, symbolizing the "farming" of a database. The line then seamlessly morphs and angles upward to form a jagged, rising financial chart, punctuated by a Gold arrow tip. The motion is smooth and unhurried, suggesting stability and natural progression.
- Psychological Impact & KPI Focus
Niche Psychology:
In a market saturated with aggressive "Hunter" imagery, this style appeals to the "Farmer" mindset of long-term stability and Customer Lifetime Value (CLV). It suggests that your software nurtures the dealership's existing database to produce a reliable harvest, rather than just chasing quick, one-off leads.
Operational Impact:
It visualizes Organic Growth and Retention ROI. It simplifies the complex argument of "replacing legacy systems" into a clear visual metaphor: cultivation leads to capital.
- Strategic Implementation & Trade-offs
- Best For: Email marketing campaigns and retention-focused content where a calm, sophisticated tone is preferred over high-energy sales pitches.
- Trade-off: It is highly stylized. It sells the philosophy of growth, not the mechanics of the tool, so it must be paired with hard data.
Companies using similar video content -
Dominion VUE DMS – Cloud-based dealer management system.
Keyloop – Provide integrated technology solutions for dealerships.
13. 2D Animation & UI Comp
MOFU | Re-engagement

- The Visual & Narrative Approach
Visualization Scenario:
A hybrid style that mixes friendly character illustration with actual software screenshots. A stylized 2D illustration of a dealership employee (rendered in soft Pastel Pink and Blue) interacts with a floating, semi-transparent UI window. The character points to a specific "Email Automation" button, smiling as a green "Sent" notification appears. The background is a clean, abstract office setting, keeping the focus entirely on the helpful interaction.
- Psychological Impact & KPI Focus
Niche Psychology:
Churn often happens when users feel abandoned or confused. This style is disarming and supportive. It uses the "Helpful Guide" archetype to lower the barrier to re-entry. It implies, "We are here to help you succeed, not just sell you a license."
Operational Impact:
It visualizes "Customer Success" and "Ease of Adoption." It directly counters the fear of complex onboarding by showing a friendly, human-centric view of task completion.
- Strategic Implementation & Trade-offs
- Best For: Retargeting Display Ads and "We Miss You" email campaigns for dormant leads.
- Trade-off: It can look "Consumer" rather than "Enterprise." Avoid using this for high-stakes Enterprise pitches where a more serious tone is required.
Companies using similar video content -
automotiveMastermind – Predictive Analytics – Predict consumer behavior, personalize engagement.
AutoXloo – Vehicle Merchandising – Enhance vehicle merchandising and marketing solutions.
14. 3D Parallax UI Presentation
MOFU | Demo Request
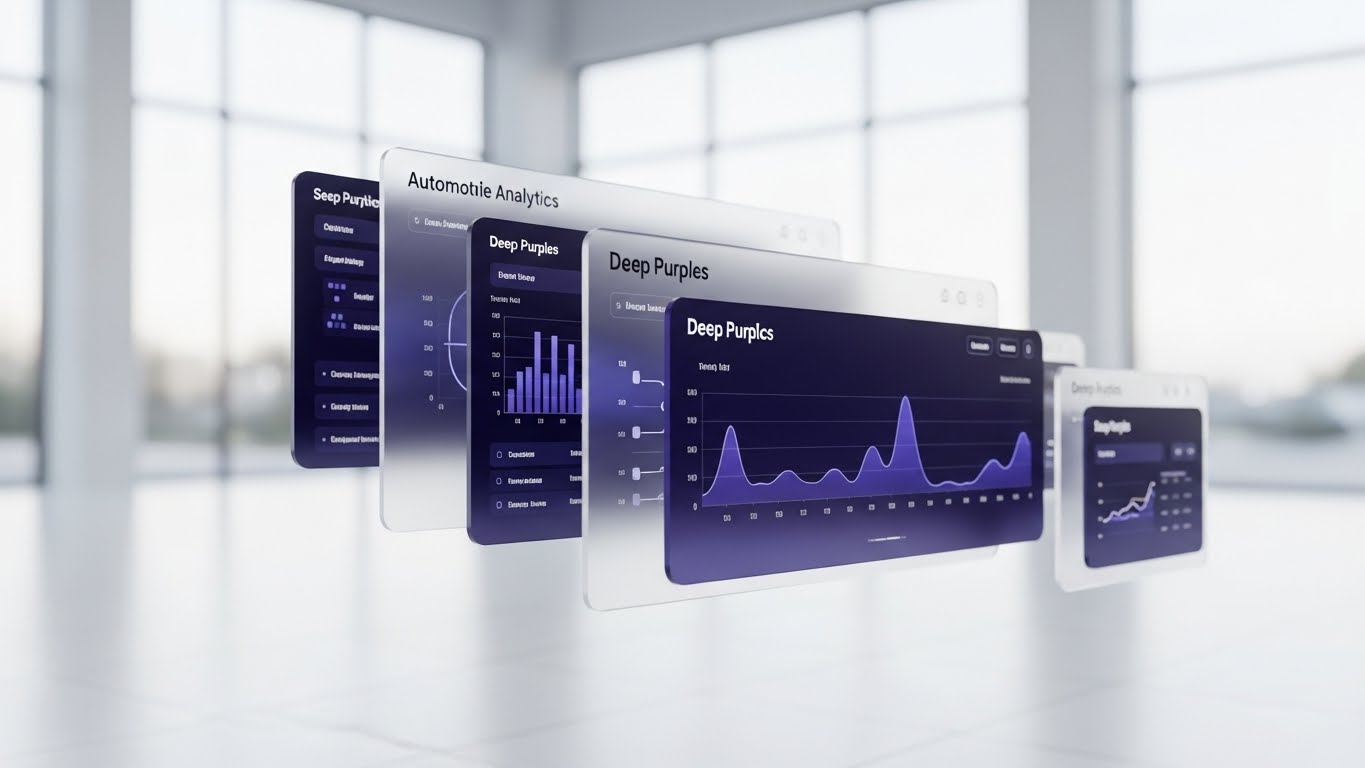
- The Visual & Narrative Approach
Visualization Scenario:
A high-end 3D presentation where software screens are treated as premium physical objects. Multiple frosted glass panels float in a 3D space with a parallax effect. The panels display detailed automotive analytics—Deep Purple wave charts and data grids—utilizing a "Glassmorphism" effect with semi-transparency. The background is a bright, out-of-focus white showroom, providing a clean, airy context that makes the dark-mode UI pop with authority.
- Psychological Impact & KPI Focus
Niche Psychology:
Marketing Directors want their tools to look as modern as the cars they sell. This style leverages the "Premium Tech Aesthetic." It signals that the platform is cutting-edge, high-value, and prestigious.
Operational Impact:
It visualizes "Data Depth." The layering of screens implies that the software offers deep insights and multi-level analytics, not just surface-level reporting.
- Strategic Implementation & Trade-offs
- Best For: The "Request Demo" section of your website and high-level capabilities decks.
- Trade-off: It idealizes the UI. If the actual product is a flat, grey spreadsheet-style interface, this video style creates an "Expectation Gap" that could hurt during the actual demo.
Companies using similar video content -
AutoLoop – Marketing Automation – Marketing automation and customer retention.
CallRevu – Call Tracking – Improve customer experience with call tracking.
15. Lifestyle Stock with UI
MOFU | Building Trust

- The Visual & Narrative Approach
Visualization Scenario:
A high-quality cinematic photo brings the user into the scene. A professional woman in a Warm Beige blazer sits at a glass desk in a modern, sunlit office, looking intently at her laptop. Floating in the air between her and the device is a sleek, holographic interface overlay in Navy Blue and Gold, prominently displaying a "5-Star Trust Score." The natural lighting and authentic posture ground the futuristic tech in a relatable human moment.
- Psychological Impact & KPI Focus
Niche Psychology:
Trust is the currency of the automotive trade. This style uses "Social Proof Visualization." By showing a focused, professional user deriving value (the Trust Score) from the software, it validates the viewer's potential decision. It mirrors their self-image as a data-driven leader.
Operational Impact:
It visualizes "Reputation Management." It connects the abstract concept of a digital reputation score to the physical reality of a manager monitoring the dealership's brand health.
- Strategic Implementation & Trade-offs
- Best For: Landing Pages and Case Study testimonials.
- Trade-off: Reliance on stock actors. If the model looks too generic or "corporate," the video loses authenticity. Custom photography of real clients is preferred if budget allows.
Companies using similar video content -
Impel AI – AI Webchat – AI for customer service, personalized marketing.
Drivee AI – AI Sales Agent – Advanced AI for car dealerships, sales agent.
16. Photorealistic 3D Renders
BOFU | Economic Buyer

- The Visual & Narrative Approach
Visualization Scenario:
To appeal to the financial guardian of the dealership, this style uses metaphor over interface. A photorealistic 3D render depicts a heavy, crystalline glass shield with a sharp Gold core resting on a textured surface. A beam of light highlights the shield's strength and clarity. The texture of the glass suggests impermeability and high value. The visual is stark, serious, and premium.
- Psychological Impact & KPI Focus
Niche Psychology:
The Economic Buyer (CFO or Dealer Principal) is driven by Risk Mitigation. While others look for features, they look for safety. This visual metaphor speaks directly to "Security" and "Protection"—protecting the dealership's data, margins, and compliance status (FTC Safeguards).
Operational Impact:
It visualizes "Compliance and Security." Visually representing your software as an impenetrable shield positions it as a safe harbor for their investment, rather than just an expense.
- Strategic Implementation & Trade-offs
- Best For: Pitch decks for the C-Suite and sections on Data Security/Compliance.
- Trade-off: It is purely metaphorical. It builds confidence in the company but explains nothing about the product features.
Companies using similar video content -
CDK Global – Drive DMS – Integrated computing solutions for dealerships.
Dealer360 – Analytics Tool – Make precise data-driven decisions.
17. Dynamic Data Visualization
BOFU | ROI Justification
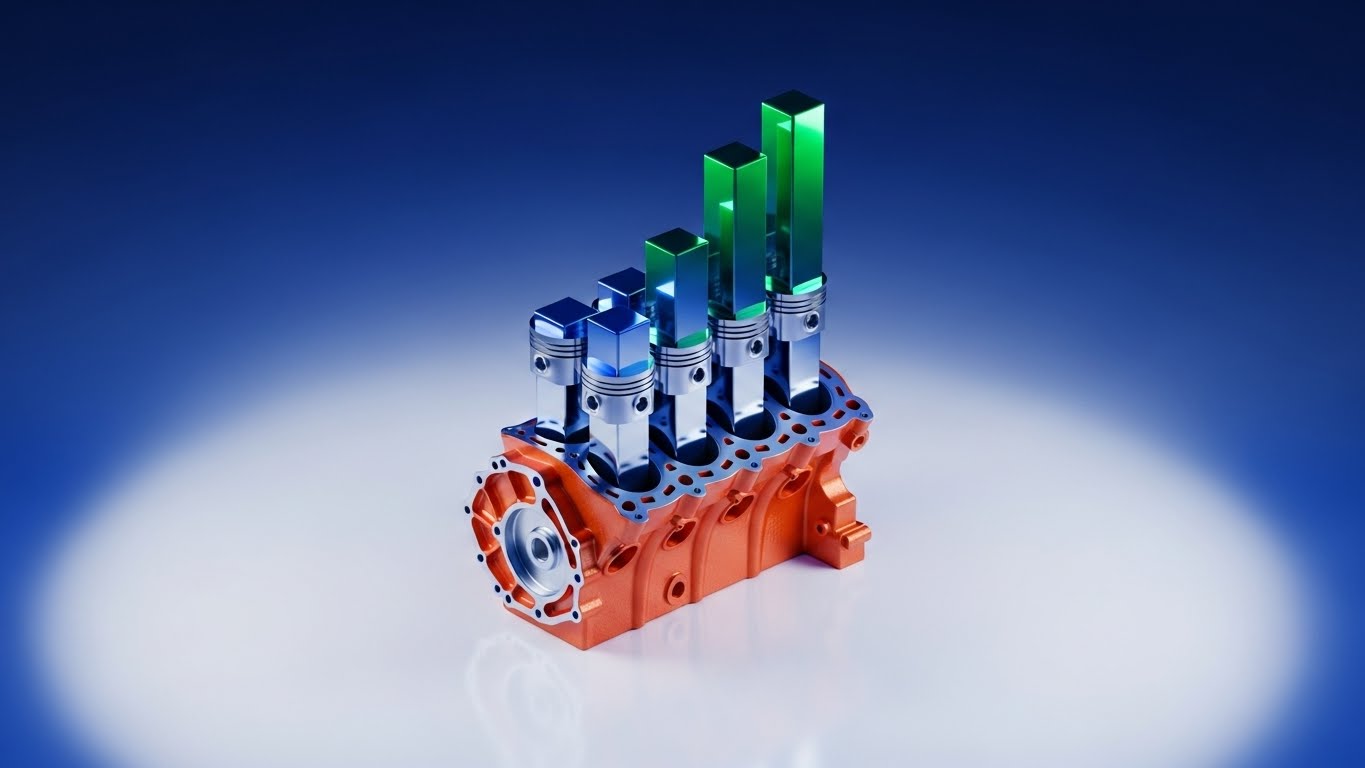
- The Visual & Narrative Approach
Visualization Scenario:
A clever fusion of automotive hardware and business intelligence. An isometric 3D render shows a stylized car engine block cast in Burnt Orange metal. Instead of pistons, bright Chrome and Green 3D bar charts pump vertically out of the cylinders. The scene is set on a clean laboratory stage. The motion of the "data pistons" mimics the firing order of an engine, creating a rhythmic visual of power and output.
- Psychological Impact & KPI Focus
Niche Psychology:
Dealers understand horsepower. This style translates "Software Performance" into "Engine Performance." It frames your marketing automation or CRM not as a passive database, but as the active engine driving the dealership's revenue.
Operational Impact:
It visualizes "ROI Generation" and "Service Absorption." It explicitly links the mechanical operation of the dealership (service/sales) with the financial output (the rising bar charts).
- Strategic Implementation & Trade-offs
- Best For: Executive presentations and "Performance Review" quarterly reports (QBRs).
- Trade-off: It is highly stylized. It works best as a conceptual hook before diving into the actual spreadsheet numbers.
Companies using similar video content -
Podium – AI BDC – Improve lead response time, manage customer reviews.
KPA – Vera Suite – Complete dealership compliance and safety programs.
18. Generative AI Realistic Character Video
BOFU | ROI Hook

- The Visual & Narrative Approach
Visualization Scenario:
This style focuses on the moment of success. A cinematic medium close-up captures a confident dealership manager in a tailored Navy suit firmly shaking hands with a client. The focus is sharp on the handshake—the universal symbol of a closed deal. The background is a soft, warm bokeh of a sunlit showroom. The lighting is golden and aspirational, evoking the satisfaction of a seamless transaction.
- Psychological Impact & KPI Focus
Niche Psychology:
Ultimately, dealers want to sell cars. Software is just a means to this end. This style cuts through the tech jargon to remind them of the result. It triggers the emotional reward associated with closing a sale.
Operational Impact:
It visualizes "Conversion" and "Closing Ratio." It anchors the software's value not in clicks or impressions, but in the physical reality of a sold unit and a happy customer.
- Strategic Implementation & Trade-offs
- Best For: Bottom-of-funnel video ads (YouTube/Facebook) retargeting decision-makers who have visited the pricing page.
- Trade-off: Authenticity risk. AI characters must be generated with high precision to avoid looking artificial, which would damage trust in a "people-first" industry.
Companies using similar video content -
ComplianceTrak – FCA Compliance Software – Streamline FCA compliance for dealerships.
AutoSmart Audit – Compliance Automation – Compliance automation for dealerships.
19. 2D Graphics Over Live Action
BOFU | Objection Handling
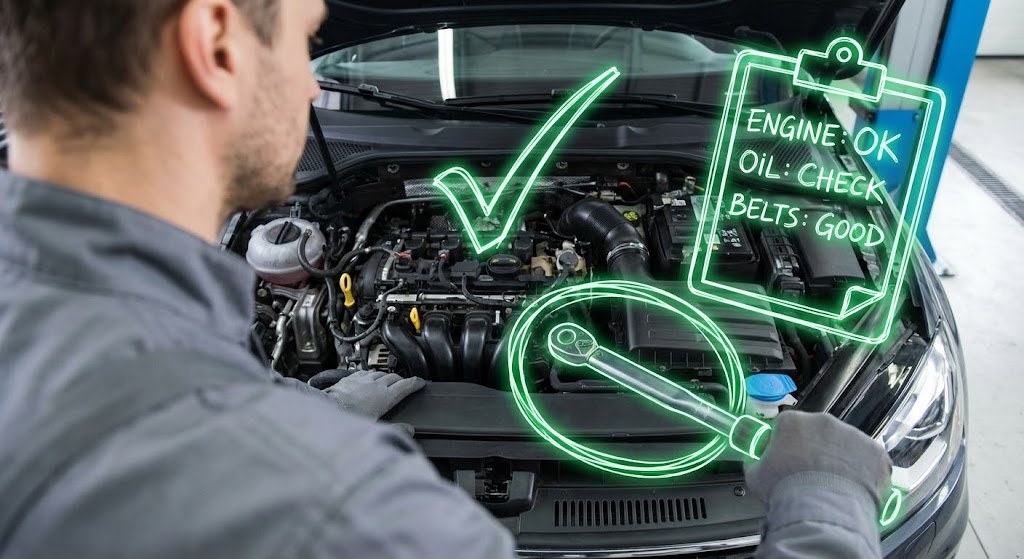
- The Visual & Narrative Approach
Visualization Scenario:
A first-person POV shot places the viewer in the shoes of a technician. We see a mechanic in a grey uniform inspecting an engine bay. Overlaid on the real footage are floating, hand-drawn style Neon Green vector graphics: checkmarks appearing over inspected parts, a circle highlighting a bolt, and a floating "status" checklist. The graphics track with the camera movement, simulating an Augmented Reality experience.
- Psychological Impact & KPI Focus
Niche Psychology:
Fixed Operations Directors value accuracy and speed. They fear software will slow their techs down. This style visually refutes that by showing the software as a layer of intelligence that speeds up the inspection process, guiding the tech rather than obstructing them.
Operational Impact:
It visualizes "Process Compliance" and "MPI (Multi-Point Inspection) Efficiency." It demonstrates how the digital tool overlays directly onto the physical work, ensuring nothing is missed.
- Strategic Implementation & Trade-offs
- Best For: Training videos and Sales Enablement content for Fixed Ops Directors.
- Trade-off: Production intensity. It requires shooting high-quality live-action footage and then motion-tracking the graphics.
Companies using similar video content -
Tekion DMS – Automotive Retail Cloud – Real-time analytics, operational efficiencies.
Nerd Auto – Design websites integrating advanced predictive solutions.
20. Hyper-lapse Stock Footage
BOFU | Sales Accel

- The Visual & Narrative Approach
Visualization Scenario:
A high-energy hyper-lapse sequence of a busy multi-lane highway during the day. The cars are blurred streaks of motion in Red and White, conveying massive volume and speed. Overlaying this kinetic footage is a crisp, static white data line graph that trends sharply upwards. The juxtaposition of the frantic, fast-moving traffic with the steady, rising data line creates a sense of controlled chaos and capitalized opportunity.
- Psychological Impact & KPI Focus
Niche Psychology:
Dealers are obsessed with "Traffic" (both foot and web). This style visualizes the market as a rushing river of opportunity. It creates urgency—"The market is moving fast; are you capturing it?"
Operational Impact:
It visualizes "Inventory Turn" and "Lead Velocity." It implies that the software acts as the traffic controller, organizing the chaos of the market into a predictable upward revenue trend.
- Strategic Implementation & Trade-offs
- Best For: LinkedIn background headers or introductory loops for high-energy sales events.
- Trade-off: It is broad. It builds energy but lacks specificity. Use it to set the mood, not to explain a feature.
Companies using similar video content -
Matador AI – AI Sales Agent – Automate sales & service conversations for dealerships.
Impel AI – AI for Customer Service – AI for customer service, personalized marketing.
21. Macro UI Micro-Interactions
Onboarding | Self-Serve

- The Visual & Narrative Approach
Visualization Scenario:
This style abandons the wide shot to focus on the microscopic moment of action. An extreme macro close-up (simulated 3D render) focuses on a single, circular digital button on a sleek interface. The button glows with a Vivid Emerald Green inner light and features a stylized "Rocket Ship" icon. A human finger (soft focus) is poised to press it. The background is a blurred, high-key white device surface. The texture of the button suggests smooth, capacitive glass.
- Psychological Impact & KPI Focus
Niche Psychology:
Onboarding friction often stems from the fear of complexity—"Will I break something?" This style isolates a single, positive action. It uses Tactile Visualization to make the digital action feel physical, satisfying, and safe. It promises that the software is responsive and easy to control.
Operational Impact:
It visually validates "Ease of Use" and "Self-Serve." By highlighting the simplicity of a "Launch" or "Submit" action, it encourages users to take the first step without waiting for a support rep.
- Strategic Implementation & Trade-offs
- Best For: In-app tooltips, "Welcome" emails, and feature announcement snippets showing a specific new button/function.
- Trade-off: It is hyper-specific. It effectively sells a feature but cannot explain a process. It is a visual "nudge," not a tutorial.
Companies using similar video content -
Xtime – Service Management – Enhance service experiences, streamline appointment scheduling.
Mitchell 1 – Repair Shop Software – Repair shop software, diagnostics, labor guides.
22. Isometric 3D Workflow
Onboarding | Reduce Friction
- The Visual & Narrative Approach
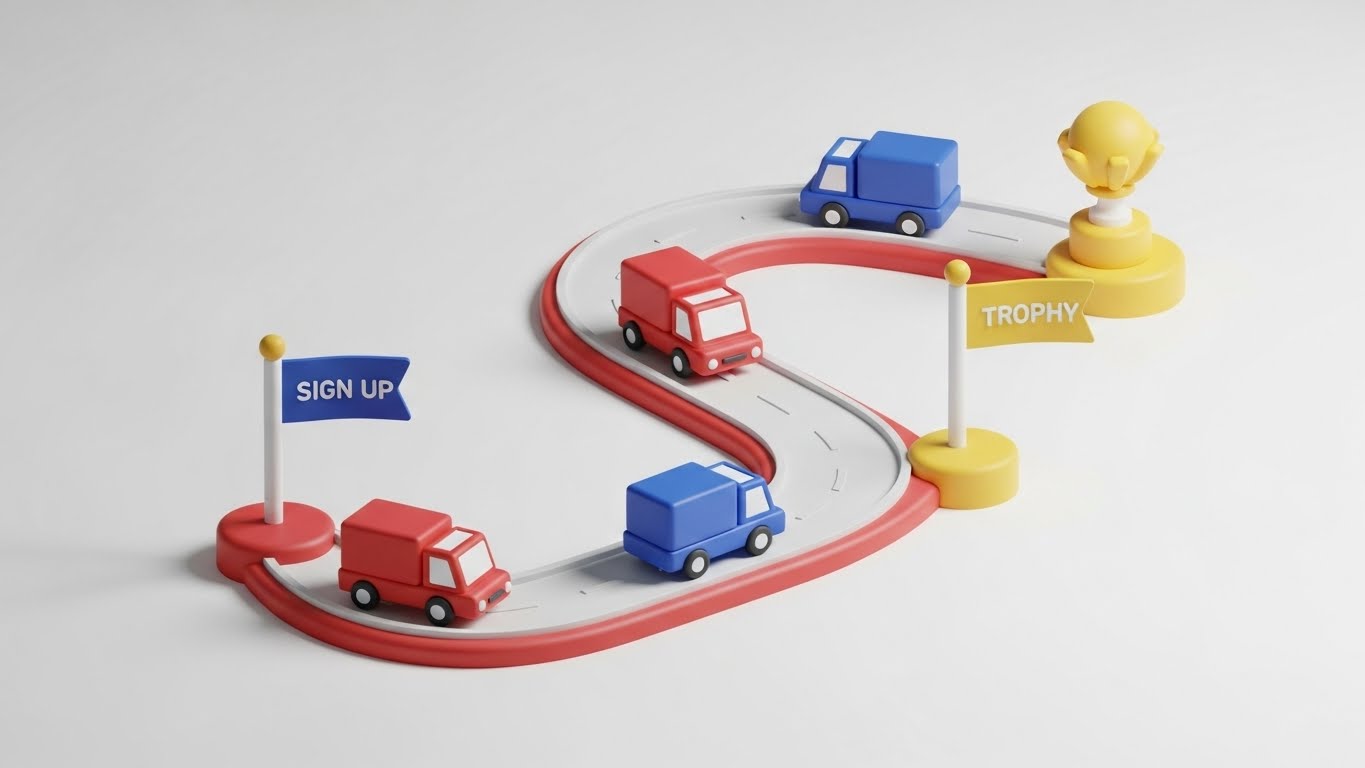
Visualization Scenario:
To combat onboarding fatigue, this style uses a playful "Claymorphism" aesthetic. Soft, rounded 3D shapes in Primary Red, Blue, and Yellow form a toy-like diorama on a clean white surface. A winding road connects a blue flag labeled "SIGN UP" to a golden trophy on a pedestal. Small, stylized delivery trucks travel along the road. The lighting is soft and shadowless, creating a friendly, non-threatening environment.
- Psychological Impact & KPI Focus
Niche Psychology:
New software can feel like "work." This style leverages Gamification psychology. By turning the setup process into a visual "level" to be beaten (with a Trophy at the end), it triggers the dopamine reward system. It reframes the "chore" of data entry as a "journey" toward a reward.
Operational Impact:
It visualizes "User Journey" and "Progress Tracking." It gives the user a bird's-eye view of the process, reducing anxiety by showing exactly where the finish line is.
- Strategic Implementation & Trade-offs
- Best For: Onboarding progress emails (e.g., "You're 50% there!") and Setup Wizards.
- Trade-off: It can feel "infantilizing" if used for serious compliance topics. Keep it strictly for "Getting Started" and celebration moments.
Companies using similar video content -
Carsforsale.com – Online shopping platform for vehicle shoppers.
FlickFusion – Video Marketing – Video marketing for automotive inventory.
23. Low-Poly 3D Modeling
Onboarding | TTV

- The Visual & Narrative Approach
Visualization Scenario:
A low-poly 3D landscape built from faceted triangular polygons. The environment uses a fresh palette of Mint Green and Coral. A simplified, faceted Blue car races along a poly-road towards a finish line tape. The background sky is a gradient of soft geometric shapes. The aesthetic borrows from indie video games—clean, fast, and modern.
- Psychological Impact & KPI Focus
Niche Psychology:
Dealers are impatient. They want Time-to-Value (TTV). This style visually communicates "Agility" and "Speed." The stripped-back, low-poly aesthetic subconsciously suggests that the software is lightweight, fast-loading, and bloat-free.
Operational Impact:
It visualizes "Rapid Deployment." It helps overcome the objection that "software takes months to install." The car crossing the finish line symbolizes the quick win of getting the system live.
- Strategic Implementation & Trade-offs
- Best For: Blog posts about implementation speed, "Quick Start" guides, and technical implementation timelines.
- Trade-off: It lacks detail. You cannot show actual UI or specific car models in this style. It is purely for conveying the feeling of speed.
Companies using similar video content -
DealerCenter – Manage, sell, and advertise vehicle inventory from one program.
AutoSoft DMS – Streamline dealership operations, boost efficiency and profits.
24. 2D Character-Driven Story
Onboarding | Activation

- The Visual & Narrative Approach
Visualization Scenario:
A clean, corporate 2D vector illustration designed to celebrate team adoption. A confident female character in a Yellow blazer stands on a white conference stage next to a projection screen displaying a rising "Leads" trend line. She is high-fiving a male colleague. The art style is flat, modern corporate vector with smooth lines and no outlines. The scene radiates positivity and collaboration.
- Psychological Impact & KPI Focus
Niche Psychology:
Software adoption is a cultural challenge, not just a technical one. This style focuses on Social Proof and Team Cohesion. It validates the user's effort by showing the social reward: recognition from peers and success for the team.
Operational Impact:
It visualizes "Cultural Adoption." It shifts the focus from "inputting data" to "celebrating results," encouraging managers to champion the software within their teams.
- Strategic Implementation & Trade-offs
- Best For: "Success Story" videos, internal dealership training kick-offs, and Quarterly Business Review (QBR) intros.
- Trade-off: Generic corporate art is common. To stand out, ensure the characters reflect the diversity and specific attire of a real dealership environment.
Companies using similar video content -
Autologica Sky DMS – Cloud DMS – Cloud-based DMS for automotive, truck, machinery.
DMS Navigator – Comprehensive dealership management system.
25. Holographic UI over 3D
Retention | Knowledge Base

- The Visual & Narrative Approach
Visualization Scenario:
This style visualizes the concept of "Smart Support." A 3D studio render features a physical Silver engine block as the centerpiece. Surrounding the engine is a floating, transparent holographic interface in Holographic Pink and Blue, displaying charts and a "Diagnostic" overlay. The background is a neutral studio dark blue. The hologram wraps protectively around the physical object.
- Psychological Impact & KPI Focus
Niche Psychology:
When users get stuck, they panic. This style uses the "Iron Man/HUD" aesthetic to frame support not as a "fix" for a broken thing, but as an Intelligence Layer. It suggests that help is always available, futuristic, and integrated directly into the workflow.
Operational Impact:
It visualizes "Knowledge Base Availability." It reassures the user that the software (the hologram) wraps around their core business (the engine) to provide answers instantly, reducing the need for support tickets.
- Strategic Implementation & Trade-offs
- Best For: Help Center headers, "New Feature" walkthroughs, and AI-Assistant launch videos.
- Trade-off: It looks expensive. Ensure your actual support experience (chatbots/articles) lives up to this high-tech promise, or you risk disappointing users.
Companies using similar video content -
DX1 – Dealership Management System – Dealership management system for powersports.
Frazer Auto Dealer Software – Manage accounting, inventory, sales, forms.
26. Abstract 3D AI Visualization
Retention | Reduce Churn

- The Visual & Narrative Approach
Visualization Scenario:
An abstract 3D visualization of a connected network. On a clean Deep Black background (to make the connections pop), a globe is spanned by a web of Sapphire Blue nodes connected by thin silver lines. At each node sits a tiny, stylized white car. The camera slowly rotates around the globe, showing the vastness and interconnectivity of the system.
- Psychological Impact & KPI Focus
Niche Psychology:
Churn happens when dealers feel isolated or see the tool as a single utility. This style visualizes the Network Effect. It reminds the dealer that they are part of a massive, data-rich ecosystem. Leaving the platform means losing access to this global intelligence.
Operational Impact:
It visualizes "Big Data Benchmarking." It suggests that your platform offers insights derived from thousands of other dealers, a value proposition that a standalone competitor cannot match.
- Strategic Implementation & Trade-offs
- Best For: "Year in Review" emails, retention campaigns, and market trends reports.
- Trade-off: It is abstract. It sells the company's scale, not the user's daily utility. Use it to reinforce long-term partnership value.
Companies using similar video content -
Elead – CRM – Enhance customer interactions, streamline sales processes.
Selly Automotive – Beginner-friendly solution for independent auto dealers.
27. Aspirational Stock Montage
Retention | Support Overhead

- The Visual & Narrative Approach
Visualization Scenario:
A high-quality, authentic stock photo captures a genuine moment of celebration. A diverse dealership team stands in a sunlit, modern showroom entrance. They are smiling, high-fiving, and looking at a tablet held by the manager which displays a "Goal Achieved" badge. A subtle Lens Flare graphic overlay adds a cinematic sense of victory. The lighting is warm natural daylight, radiating positivity.
- Psychological Impact & KPI Focus
Niche Psychology:
Emotional connection drives retention. This style moves beyond the software interface to the Human Outcome. It reminds the Dealer Principal that the ultimate goal of the software is a happy, productive, and winning team.
Operational Impact:
It visualizes "Employee Satisfaction." It subtly argues that using your platform makes the staff's lives easier and their work more rewarding, which is a key factor in reducing staff turnover.
- Strategic Implementation & Trade-offs
- Best For: Newsletters, Case Study thumbnails, and "Thank You" videos.
- Trade-off: Authenticity is key. If the stock photo looks staged or the diversity feels forced, it will be ignored. Use real client photos whenever possible.
Companies using similar video content -
Fullpath – AI-Powered Solutions – AI-powered solutions to boost sales, enhance experiences.
Impel AI – AI Webchat – AI for customer service, personalized marketing.
28. Futuristic Neon/Dark Mode
Expansion | Upsell
- The Visual & Narrative Approach
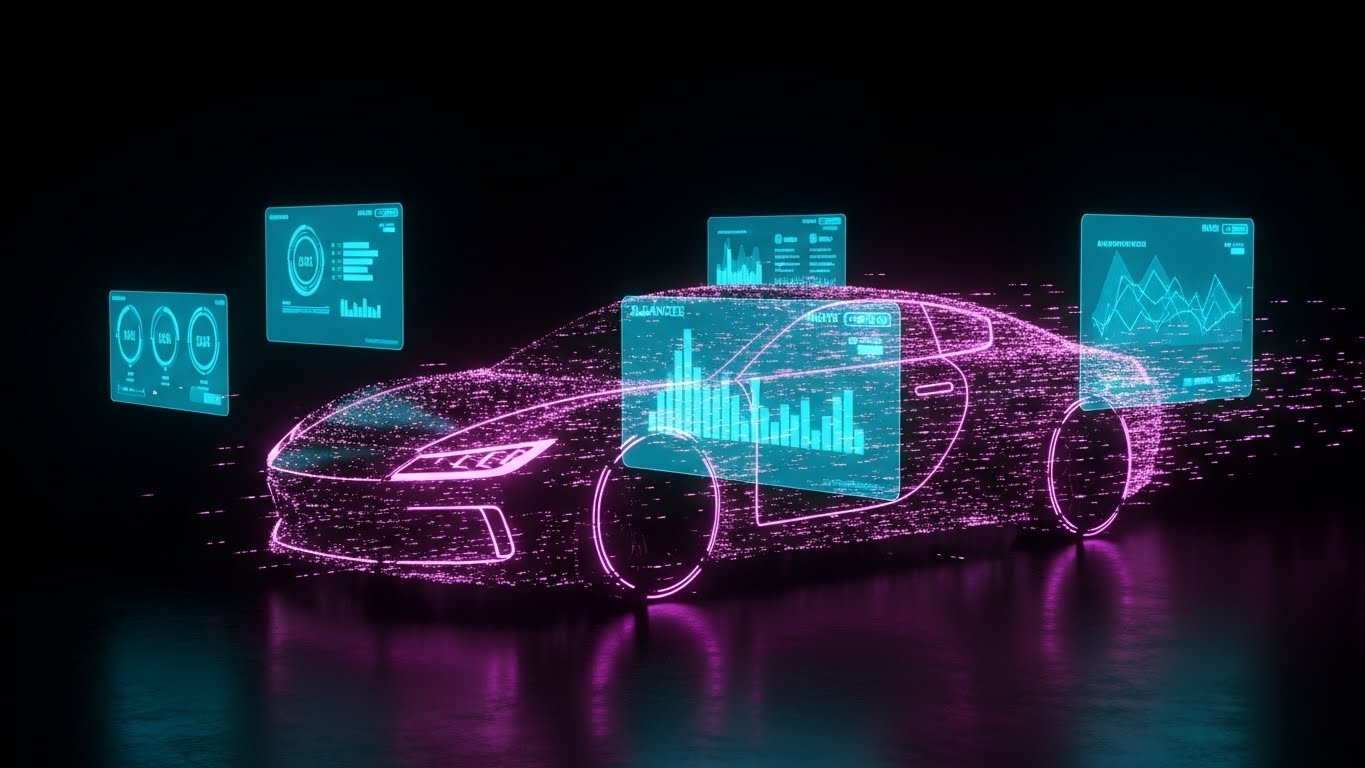
Visualization Scenario:
A striking "Dark Mode" composition designed to appeal to power users. A sleek, conceptual car is outlined in glowing Neon Pink lines against a Deep Black background. Surrounding the vehicle are floating UI widgets in Cyber Blue, displaying advanced metrics (predictive analytics, market heatmaps). The aesthetic is "Cyberpunk" meets "Enterprise Tech."
- Psychological Impact & KPI Focus
Niche Psychology:
Expansion sales (Upsells) require the user to feel they are "leveling up." This style signals Exclusivity and Power. It differentiates the "Basic" tier (often light/white) from the "Enterprise" tier (dark/neon), triggering the desire for the "Pro" toolset.
Operational Impact:
It visualizes "Predictive Analytics" and "AI Capabilities." The futuristic look implies that this tier of software doesn't just report the past—it predicts the future.
- Strategic Implementation & Trade-offs
- Best For: Launching new "Pro" modules, AI features, or Enterprise-tier upgrades.
- Trade-off: It is aggressive. It may alienate conservative users who prefer a simple, traditional interface. Use it strictly for the "Innovators" in your user base.
Companies using similar video content -
automotiveMastermind – Predictive Analytics – Predict consumer behavior, personalize engagement.
CDK Global – Drive DMS – Integrated computing solutions for dealerships.
29. Dark Mode UI Showcase
Expansion | Deep Feature

- The Visual & Narrative Approach
Visualization Scenario:
A detailed, high-fidelity close-up of a software screen in Dark Mode. The background is Charcoal Grey. The data elements (toggles, line graphs, code snippets) are rendered in high-contrast Electric Green and Cyan. A cursor clicks a "Run Analysis" button. The screen shows a complex "Admin Settings" or "API Configuration" panel.
- Psychological Impact & KPI Focus
Niche Psychology:
For Technical Directors and Marketing Ops leaders, "Simple" equals "Limited." They want control. This style appeals to the Technical Validator. It shows that under the hood, your platform offers deep configuration, API access, and granular data control.
Operational Impact:
It visualizes "Customization" and "Integration." It proves that the software is robust enough to handle complex, multi-rooftop enterprise requirements.
- Strategic Implementation & Trade-offs
- Best For: Developer Portals, API documentation videos, and "Advanced Settings" tutorials.
- Trade-off: It looks intimidating to the average sales manager. Keep this content gated for the technical users who specifically ask for it.
Companies using similar video content -
Podium – AI BDC – Improve lead response time, manage customer reviews.
DealerSocket – CRM – Manage customer data, automate marketing campaigns.
30. 3D X-Ray Visualization
Expansion | Referrals
- The Visual & Narrative Approach
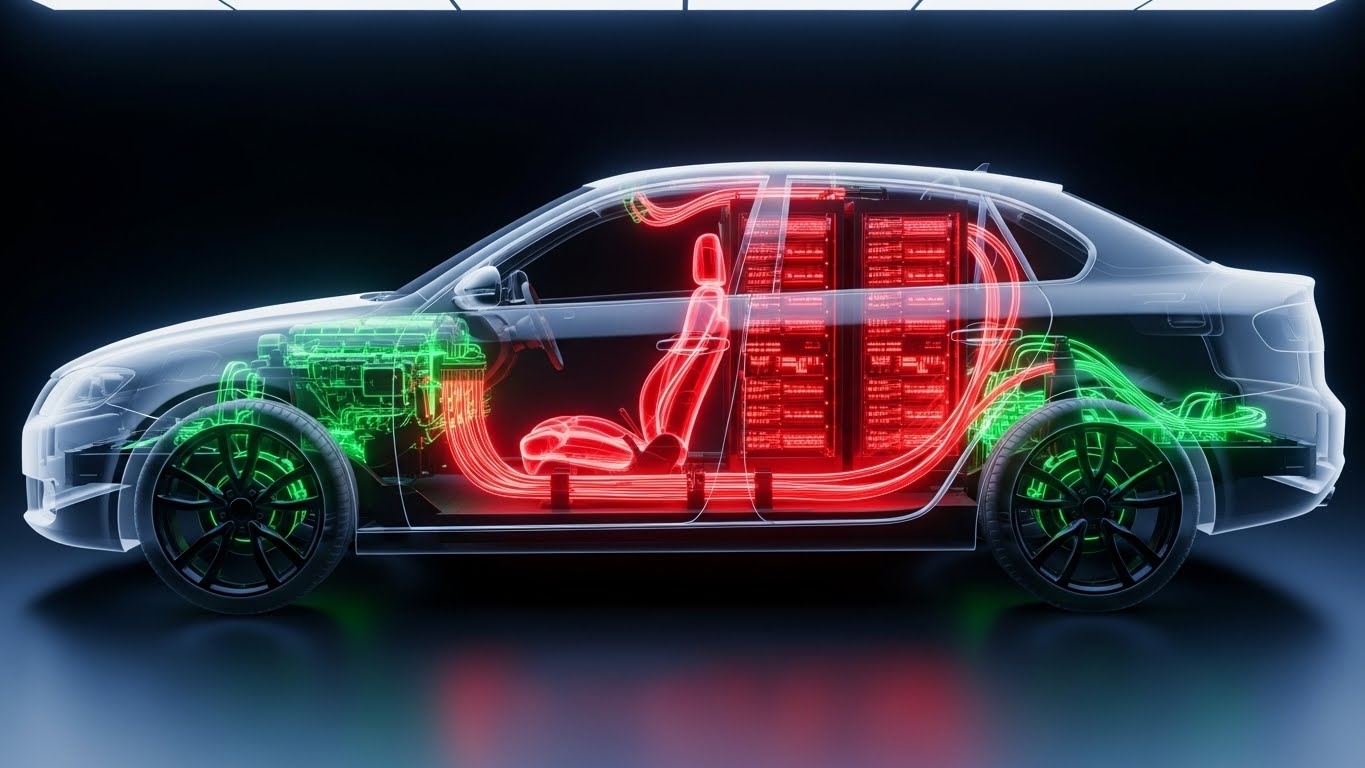
Visualization Scenario:
A side-profile view of a modern sedan rendered in a technical X-Ray style. The car's outer shell is a ghosted, semi-transparent Ghost White. Inside, instead of mechanical parts, we see glowing Red server racks and Green data cables running along the chassis, simulating the "nervous system" of a connected car. The background is a clean, clinical white.
- Psychological Impact & KPI Focus
Niche Psychology:
Trust is the ultimate driver of referrals. This style implies Transparency. It says, "We have nothing to hide; look how our technology permeates the entire vehicle lifecycle." It positions the software not as an add-on, but as the core infrastructure.
Operational Impact:
It visualizes "Full Lifecycle Management." It shows that the software connects everything—from the engine health (Service) to the customer data (Sales)—justifying why a dealer should recommend it to their peer group.
- Strategic Implementation & Trade-offs
- Best For: "Refer a Friend" campaigns, high-level brand videos, and partnership announcements (e.g., "Now integrating with X").
- Trade-off: It is conceptual. It effectively sells the vision of the connected dealership but requires supporting content to explain the mechanics.
STRATEGIC KNOWLEDGE BASE: The Visual Operations Doctrine
To transform your automotive software from a "tool" into an "infrastructure," you must move beyond making random videos. You need a Visual Operating System (VOS). This framework aligns your visual content with the cognitive needs of the dealership hierarchy.
Strategic Alignment & Visual Architecture
The "Pre-Production" Strategy – Why and Who.
- The Cognitive Load Audit: Before commissioning a video, audit the user's mental state. A Service Advisor with a line of cars needs "Glanceable" visuals (Style 5) that convey meaning in 3 seconds. A CFO reviewing quarterly results expects "Data Depth" (Style 14). Match the visual complexity to the user's available attention span.
- Role-Based Visual Mapping: Do not use the same style for everyone. Create a matrix:
- For Sales/Front-Line: High-energy, mobile-first, simple styles (Styles 1, 5, 20).
- For Ops/Admin: Detailed, clean, desktop-optimized styles (Styles 10, 29).
- For Owners/Investors: Metaphorical, high-production value styles (Styles 11, 16, 27).
- The "Glanceability" Standard: In a dealership, speed is currency. Define a standard for your instructional visuals: Can the core message be understood without audio? Can it be understood while walking across the showroom floor? If not, simplify the visual elements (as seen in Style 21 - Macro UI).
- Brand Voice Consistency: Your software might have 10 different modules (CRM, DMS, Website, Inventory). Use a consistent visual language (e.g., the same "Electric Blue" for data points) across all video styles. This creates a subconscious thread that ties the disparate tools into a unified platform.
- The Advids Strategic Audit: Establishing this VOS requires an outside eye. Partnering with a specialized agency like Advids allows you to audit your existing assets, identify visual inconsistencies, and define a scalable design language before you spend budget on production.
- Standardization vs. Customization: For core features (Login, Dashboard), use standardized "Clean UI" styles (Style 10) to build familiarity. For unique value propositions (e.g., proprietary Equity Mining), use bespoke, high-end "Abstract Motion" (Style 2, 11) to signal premium value.
- Legacy System Integration: Many dealers still use "Green Screen" legacy DMS tools. Use visual metaphors (Style 12 - Line Art) to show how your modern software "wraps around" or "feeds" these old systems, reducing the fear of a "Rip and Replace" nightmare.
- The Mobile-First Mandate: 60% of dealership staff (Sales, Techs) are not at a desk. Ensure all 30 styles—especially the Onboarding examples (21-24)—are legible on a 9:16 vertical mobile screen. Text must be large; contrast must be high.
- Cross-Departmental Bridge: Use visuals to unify terminology. If Sales calls it a "Lead" and Service calls it an "Appointment," use a "Split Screen" style (Style 6) to visually demonstrate that it is the same customer entity, bridging the silo.
- Accessibility: Dealerships are diverse workplaces. Ensure your motion graphics rely on universal icons and visual actions (Style 5), not just heavy text, to be effective for multi-lingual staff.
Operational Adoption & Implementation
The "Deployment" Phase – How to embed visuals into the workflow.
Great videos are useless if they sit in a hidden YouTube folder. This segment focuses on embedding your visual assets directly into the dealership's operational workflow to drive Adoption and Stickiness.
- Overcoming "Big Brother" Anxiety: CRM and Tracking tools often scare staff. Use "Empathy-First" visuals (Style 13) to frame these features as "Assistants" that automate busy work, rather than "Watchdogs" that monitor bathroom breaks.
- The Micro-Learning Shift: Kill the PDF manual. Replace 50-page documents with a library of 30-second "Macro UI" clips (Style 21). Embed these directly into the software's tooltips. When a user hovers over a button, they should see what it does.
- Just-in-Time (JIT) Support: Embed "Holographic UI" videos (Style 25) into the Help Center. When a user searches "How to desking," they get a video overlay that guides them through the process in real-time, reducing support ticket volume.
- Gamification of Training: Use "Isometric Workflow" styles (Style 22) to visualize training progress. Show the user moving along a path to a "Certified Pro" trophy. This increases completion rates for onboarding courses.
- Reducing Support Ticket Volume: There is a direct correlation between the quality of your visual self-serve content and your support costs. Investing in clear "Clean UI" tutorials (Style 10) pays for itself by deflecting Tier-1 support calls.
- Remote Onboarding: You cannot fly a trainer to every dealership. Use "3D Parallax" styles (Style 14) to create premium, immersive webinar experiences that make remote training feel like a high-end event.
- Visual SOPs: Transform Standard Operating Procedures (e.g., "The Morning Inventory Walk") from a checklist into a "Hyper-lapse" video (Style 20) that shows the pace and flow of the task, not just the steps.
- Feedback Loops: Use interactive video elements. At the end of a "Feature Montage" (Style 7), add a clickable polling card: "Was this helpful?" Use this data to refine your visual strategy.
- Scalable Localization: If you serve global markets, design your "Abstract Vector" styles (Style 2, 9) to be text-light. This allows you to swap out the voiceover and a few text labels for different regions without re-animating the entire video.
- Leadership Communication: When pitching a new feature to a Dealer Group CEO, do not use a screen recording. Use a "Photorealistic 3D Render" (Style 16) or "Aspirational Stock" (Style 27) to communicate the strategic value and vision, respecting their role as an investor.
Measuring Impact & Future-Proofing
The "ROI" Phase – Measuring success and looking ahead.
Finally, you must treat your visual content as a performance asset. Measure its impact on the business bottom line and prepare for the next wave of "Phygital" evolution.
- Beyond "Views": Vanity metrics (views, likes) are irrelevant in B2B. Measure Time-to-Competency (how fast a new hire learns the tool using video) and Feature Adoption Rate (how many users click a button after watching the "Macro UI" clip).
- The "Idle Time" Metric: Correlate better visualization with efficiency. If your "Clean UI" videos (Style 10) are working, the average time a user spends "idling" or searching in the software should decrease.
- Compliance Velocity: When new regulations (like FTC Safeguards) hit, measure how quickly your user base achieves compliance after you release an explanatory "Shield" video (Style 16). Speed = Safety.
- Retention and Churn: Track the correlation between video consumption and churn. Users who engage with your "Pro Tier" content (Style 28) are likely more invested and less likely to churn. Use this data to score account health.
- The AI Visual Frontier: Prepare for Generative AI. Soon, you will be able to personalize "Character" videos (Style 18) for every single dealership—using the GM's own name and likeness (with permission) to deliver monthly reports. Start building the data pipelines for this now.
- Scalability of Assets: Build a "Visual Lego Kit." Don't render flat videos; create libraries of 3D assets (cars, widgets, icons) that can be reassembled into new videos quickly.
- The Advids Partnership: Building a scalable, future-proof library of 3,000+ assets is not a solo job. A long-term partnership with Advids ensures that as your software evolves, your visual library grows in tandem, maintaining quality and consistency without the overhead of an in-house studio.
- Benchmarking Success: Compare your visual strategy to consumer apps, not B2B competitors. Your users spend their nights on Netflix and TikTok; their expectation for visual quality is set by Hollywood, not by the automotive industry.
- The ROI of Safety: For tools involving service bays, measure the reduction in liability or mistakes. Clear "Augmented Tech" videos (Style 19) should lead to fewer missed inspections and higher warranty compliance.
- Final Call to Innovation: The "Phygital" revolution is not coming; it is here. The winners will not be the companies with the most code, but the companies that make their code the most visible and understandable. Treat your visual strategy as critical infrastructure. Invest in it, measure it, and refine it. The engine is running—it’s time to drive.
Companies using similar video content -
DriveCentric – AI-Powered Automotive CRM – Accelerate lead response and sales velocity.
Matador AI – AI Sales Agent – Automate sales conversations, engage leads instantly.
Author & Editor Bio


