
Introduction: Visualizing the Infrastructure of Global Finance
The capital markets industry is currently navigating its most profound structural evolution since the advent of electronic trading. As the sector moves toward hyper-connected, cloud-native ecosystems, the challenge for technology vendors is no longer just about processing speed; it is about comprehension. In a market where global spending on financial market data and news hit a record $44.3 billion in 2024, the ability to visualize intangible value—liquidity pools, algorithmic logic, and risk models—has become the primary driver of competitive advantage.
We are witnessing a "Visual Trust Gap." The physical/digital divide—the conceptual distance between a rack of servers and a seamless trade execution—must be bridged visually. Institutional buyers, from Heads of Desk to CTOs, are looking for partners who can not only execute trades but also visualize the seamless flow of data that powers them. They demand transparency in the "Black Box."
The opportunity is immense. With the global capital markets technology market projected to reach $223.35 billion by 2032, the vendors who capture market share will be those who can reduce cognitive load and articulate their value instantly. A status quo of dense technical jargon and generic stock footage is no longer sufficient to compete for the attention of sophisticated stakeholders.
This guide serves as a strategic framework for Capital Markets SaaS platforms to elevate their visual communication. By adopting these expert-driven styles, marketing and product teams can translate complex algorithmic concepts into compelling visual narratives that resonate with the "Architects of Liquidity."
1. Abstract 2D Flat Vector Organic
TOFU | Brand Awareness

The Visual & Narrative Approach
Visualization Scenario: Imagine a pristine white digital canvas where a network of nodes—colored in Pure White, Cyan, and Silver—pulses gently. These nodes are not static points but active participants in a fluid system, connected by smooth, organic lines that curve and flow rather than intersecting at rigid angles. The camera pans slowly across this interconnected web, highlighting the seamless transfer of "energy" (data) from one node to another.
Narration Style and Tone: The voiceover is calm, polished, and visionary. It speaks not of technical specs, but of "ecosystems," "fluidity," and "seamless integration."
Psychological Impact & KPI Focus
Niche Psychology: Capital markets professionals often view liquidity as a "flow." This style taps into that mental model, using organic shapes to suggest that your software removes friction, allowing liquidity to move effortlessly. It counters the anxiety of fragmented, siloed systems.
Operational Impact: This visual approach addresses the "Interoperability" challenge. It visually proves that your platform plays well with others, acting as a unifying layer in a fragmented market stack.
Strategic Implementation & Trade-offs
Best Use Case: Top-of-Funnel (TOFU) Website Headers and Brand Awareness videos where the goal is to convey ease of use and modern connectivity.
Strategic Trade-offs: While excellent for high-level concepts, this style lacks the technical granularity needed for technical buyers (e.g., CTOs) who need to see the "engine" under the hood. It prioritizes feeling over function.
Companies using similar video content -
Genesis Global – Low-Code Platform – Rapid creation of interconnected financial apps.
Glue42 – Desktop Integration Platform – Seamlessly connects disparate financial applications.
Adaptive Financial Consulting – Aeron – High-throughput, low-latency messaging for data flow.
2. Abstract 2D Motion Graphics
TOFU | Category Creation

The Visual & Narrative Approach
Visualization Scenario: The frame begins with a chaotic scatter of geometric shapes—Triangles (Slate Blue), Circles (Coral), and Squares (White)—floating aimlessly on a soft white background. Suddenly, an invisible force (the algorithm) activates. The shapes snap into a magnetic alignment, spiraling rapidly into a perfect, radial formation. This transition from entropy to order happens in a split second, miming the speed of a matching engine.
Narration Style and Tone: The audio is rhythmic and precise. Sound design plays a crucial role here—using clicks, snaps, and digital "swish" sounds to emphasize the sorting and organizing capability of the software.
Psychological Impact & KPI Focus
Niche Psychology: Traders and operations managers crave order in a chaotic market. This style visually gratifies that desire by showing "Chaos Management." It reduces the cognitive load of understanding complex sorting algorithms by simplifying them into basic geometric interactions.
Operational Impact: Specifically targets "Order Management" and "Data Normalization." It demonstrates how the platform takes unstructured, messy market data and instantly standardizes it for execution.
Strategic Implementation & Trade-offs
Best Use Case: Market Education videos on YouTube or Explainer videos that need to simplify a complex algorithmic process (like Smart Order Routing) without showing code.
Strategic Trade-offs: This abstract approach can feel too "playful" if not executed with sharp, professional motion. It risks simplifying the technology to the point where it loses its "institutional grade" feel if the physics aren't snappy.
Companies using similar video content -
FlexTrade – FlexTRADER EMS – Algorithmic execution and order management.
Trading Technologies – TT Platform – Manages and routes orders with speed.
3. Generative AI Cinematic Video
TOFU | Market Education

The Visual & Narrative Approach
Visualization Scenario: We open with a breathtaking, high-key aerial drone shot of a futuristic metropolis. The buildings are constructed of crystalline white glass and polished steel, reflecting brilliant sunlight. Between the skyscrapers, beams of Pale Gold and Sky Blue light streak through the air, moving along designated invisible highways. These aren't just cars; they are data packets, moving at light speed across a global infrastructure.
Narration Style and Tone: Epic, grand, and cinematic. The narration uses words like "Global Scale," "Infrastructure of Tomorrow," and "Horizon."
Psychological Impact & KPI Focus
Niche Psychology: Institutional buyers invest in stability and scale. This style leverages "Social Proof" and "Authority Bias" by making the software feel massive, ubiquitous, and inevitable. It assuages the fear that a vendor might be too small or risky for a Tier-1 bank.
Operational Impact: Focuses on the "Physical/Digital Divide." It metaphors the digital software as the essential infrastructure (roads and bridges) of the modern financial city, validating the software's role as critical utility.
Strategic Implementation & Trade-offs
Best Use Case: TV/OTT Commercials or major Event Openers (e.g., SIBOS, FILS). It is designed purely for Brand Perception and emotional buy-in.
Strategic Trade-offs: High production value perception is great, but Generative AI can sometimes produce "uncanny valley" artifacts if not curated perfectly. It also offers zero insight into the actual UI or workflow.
Companies using similar video content -
LSEG – Refinitiv Eikon – Global financial data and analytics platform.
Bloomberg – Bloomberg Terminal – Ubiquitous global financial information system.
4. 2D Line Art Animation
TOFU | Brand Perception
The Visual & Narrative Approach
Visualization Scenario: The background is a subtle, technical grid paper texture, evoking an architectural blueprint. A single, confident line in "Blueprint Blue" begins to draw across the screen. It doesn't just draw a shape; it charts a financial trend, fluctuating with market volatility before trending decisively upward. The line moves with continuous, elegant precision, never lifting off the page, suggesting an unbroken chain of data custody.
Narration Style and Tone: Intellectual, analytical, and precise. The tone is that of a chief architect or a lead quantitative analyst explaining a theorem.
Psychological Impact & KPI Focus
Niche Psychology: This style appeals to the "Builder" persona—the quants and developers who value precision, logic, and transparency. It strips away marketing fluff to focus on the "purity" of the data and the logic of the strategy.
Operational Impact: Ideal for illustrating "Technical Analysis" or "Risk Modeling" features. It visually reinforces the concept of accuracy and the elimination of "noise" in data reporting.
Strategic Implementation & Trade-offs
Best Use Case: YouTube SEO content and educational "Deep Dives" where the viewer needs to focus on the logic of a specific feature or calculation method.
Strategic Trade-offs: Can be perceived as "dry" or academic. It lacks the excitement of motion graphics or the grandeur of cinematic video, making it less effective for emotional brand building.
Companies using similar video content -
FactSet – FactSet Workstation – Detailed financial analytics and charting.
S&P Global Market Intelligence – Capital IQ – Deep company and market data for analysis.
5. Bold Kinetic Typography
TOFU | YouTube SEO
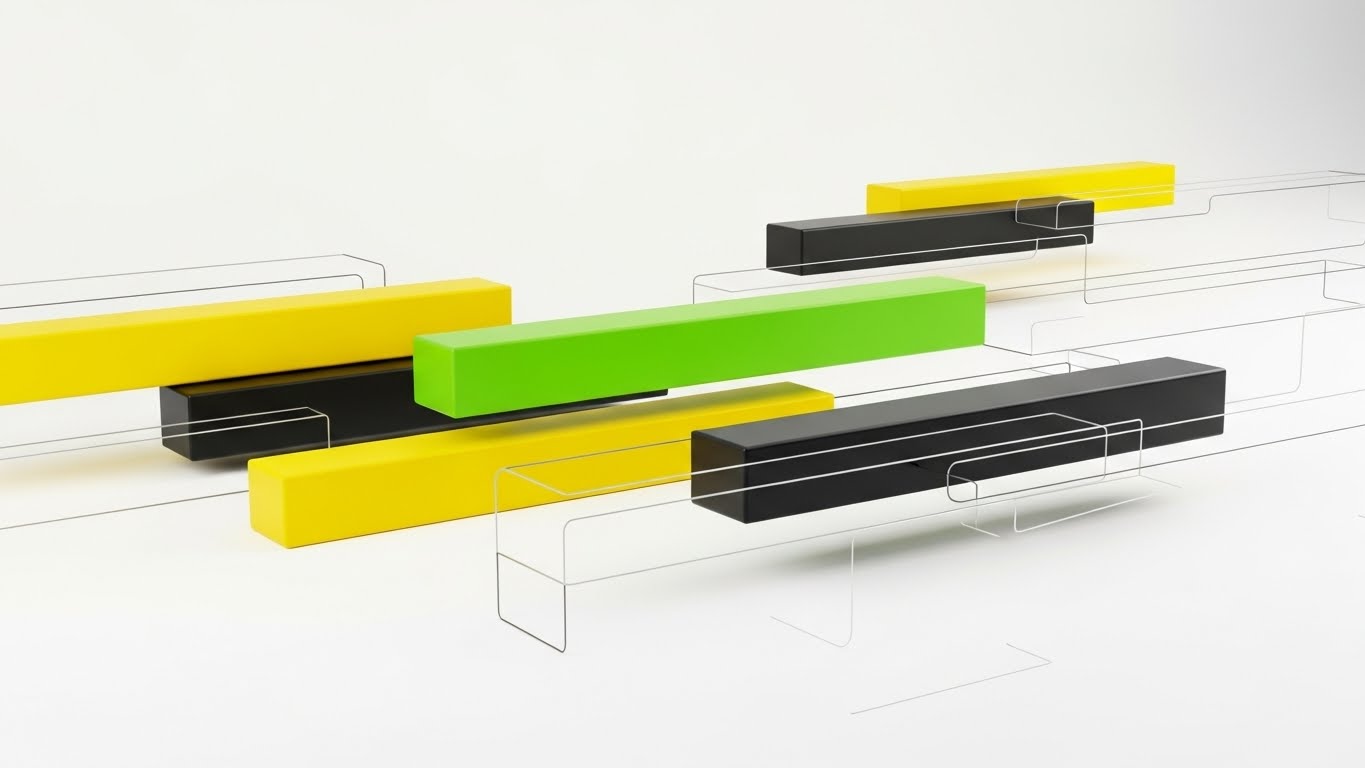
The Visual & Narrative Approach
Visualization Scenario: The screen is stark white. Suddenly, massive, heavy rectangular blocks in Electric Lime and Black slide diagonally across the frame. They move with such velocity that they are slightly motion-blurred. Inside these blocks, bold sans-serif text snaps into focus: "LOW LATENCY," "MICROSECONDS," "EXECUTION." The camera shakes slightly on impact, conveying the physical weight and speed of high-frequency trading.
Narration Style and Tone: Aggressive, punchy, and energetic. The audio is driven by a fast-tempo beat, with sound effects synchronizing perfectly with every text hit.
Psychological Impact & KPI Focus
Niche Psychology: For HFT (High-Frequency Trading) firms, speed is the only metric that matters. This style triggers a physiological response—an adrenaline hit—that aligns with the high-stakes, fast-paced nature of the trading floor. It communicates "Power" and "Urgency."
Operational Impact: Directly visualizes "Latency" and "Throughput." By using motion blur and kinetic impact, it turns an abstract millisecond metric into a tangible visual experience of speed.
Strategic Implementation & Trade-offs
Best Use Case: Pre-Roll Ads (YouTube/LinkedIn) designed to stop the scroll. The high contrast and large text ensure readability even on small mobile screens.
Strategic Trade-offs: Extremely fatiguing if overused. It is too aggressive for a long-form demo or a consultative sales meeting. It is a sprint, not a marathon.
Companies using similar video content -
Exegy – TICKERPLANT – Ultra-low latency market data solutions.
NovaSparks – FPGA Market Data – Delivers extreme low-latency market data.
6. Abstract 3D AI Visualization
TOFU | Pre-Roll Ad

The Visual & Narrative Approach
Visualization Scenario: We enter a bright, ethereal white void. Suspended in this space is a complex neural network made of translucent, glass-like nodes in Lavender and White. The camera utilizes a shallow depth of field, keeping the central "decision" node in sharp focus while the periphery blurs. Thin, glowing filaments pulse between the nodes, representing the firing of synapses in an AI model predicting a trade outcome.
Narration Style and Tone: Wonder-filled, futuristic, and intelligent. The narration focuses on "Intelligence," "Learning," and "Adaptation."
Psychological Impact & KPI Focus
Niche Psychology: AI is often viewed as a "black box" by skeptics. This style demystifies it by visualizing AI as a clean, transparent, and beautiful structure. It creates a sense of "Lucidity" and "Benevolence," countering fears of rogue algorithms.
Operational Impact: Perfect for "Predictive Modeling" and "Sentiment Analysis." It shows that the software doesn't just process data; it "thinks" and connects disparate data points to find alpha.
Strategic Implementation & Trade-offs
Best Use Case: LinkedIn Thought Leadership posts and MOFU (Middle-of-Funnel) content discussing the future of trading.
Strategic Trade-offs: It is highly abstract. If the viewer is a pragmatist looking for a specific button to click, this style will feel like "vaporware." It must be paired with concrete examples of utility.
Companies using similar video content -
Numerix – Oneview – AI-powered analytics for derivatives and risk.
IBM – Algorithmics – AI-driven risk management solutions.
7. Isometric 2D Motion Design
MOFU | Thought Leadership

The Visual & Narrative Approach
Visualization Scenario: A clean, 45-degree isometric angle reveals a stylized server rack sitting on a polished white floor. The server is rendered in flat, engaging shades of Orange and Grey, with sharp, geometric shadows. It doesn't look like a dusty basement server; it looks like a piece of high-design furniture. Small data packets (cubes) travel into the server and exit as organized stacks, visually explaining the hardware's function.
Narration Style and Tone: Practical, solution-oriented, and friendly. It simplifies the complexity of hardware infrastructure into a manageable, understandable concept.
Psychological Impact & KPI Focus
Niche Psychology: IT managers and CTOs need to visualize the "stack." Isometric design provides a "God's Eye View," giving the viewer a sense of control and total oversight. It makes complex infrastructure feel manageable and modular.
Operational Impact: Visualizes "Scalability" and "Deployment." The modular nature of isometric art implies that you can easily add more "racks" (capacity) as your business grows without disruption.
Strategic Implementation & Trade-offs
Best Use Case: Website "How it Works" pages and Differentiation assets that need to explain physical or cloud infrastructure clearly.
Strategic Trade-offs: Can look a bit "SaaS startup" generic if not branded correctly. It risks feeling too cute for very serious, high-risk institutional banking applications if the color palette isn't restrained.
Companies using similar video content -
Options Technology – Managed Colocation – Scalable cloud and infrastructure for finance.
Google Cloud for Financial Services – Cloud Infrastructure – Offers modular, scalable cloud services.
Microsoft Azure for Financial Services – Enterprise Support – Provides scalable cloud solutions for financial services.
8. Clean UI Workflow (Light)
MOFU | Differentiation
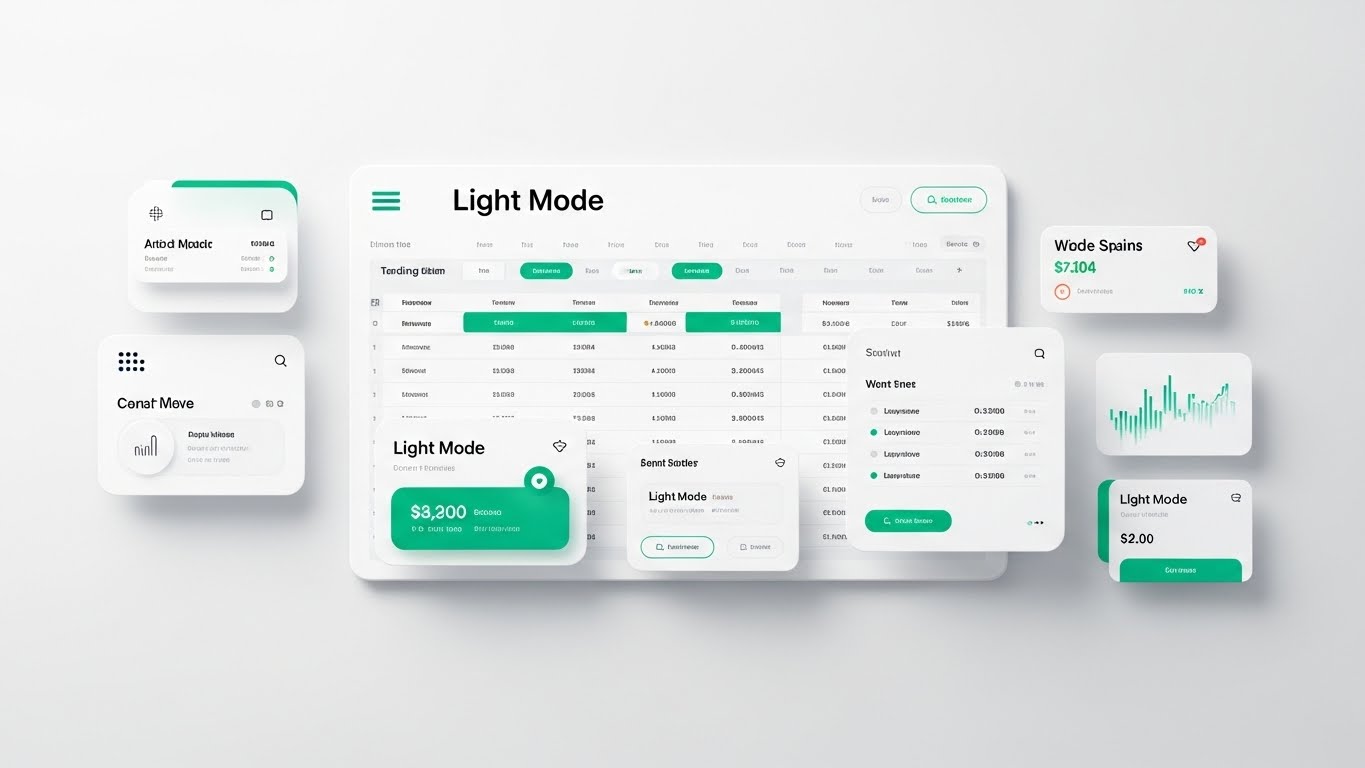
The Visual & Narrative Approach
Visualization Scenario: A directly top-down, "flat lay" view of a pristine UI dashboard. The interface is in Light Mode, utilizing a clean White background with Emerald Green data points and Soft Grey text. The dashboard displays a trading blotter. The rows are perfectly spaced, and the data is legible. Subtle drop shadows give the UI panels a slight "lift" off the white desk surface, creating depth without clutter.
Narration Style and Tone: Professional, instructive, and efficient. The focus is purely on "Workflow Optimization" and "Clarity."
Psychological Impact & KPI Focus
Niche Psychology: Traders stare at screens for 12 hours a day. Dark, cluttered interfaces cause eye strain and cognitive fatigue. This style sells "Relief." It promises a user experience that is breathable, organized, and designed for human capability.
Operational Impact: Directly targets "User Efficiency" and "Error Reduction." By highlighting the organized rows and clear data hierarchy, it visually proves that the software prevents costly "fat finger" errors.
Strategic Implementation & Trade-offs
Best Use Case: Feature Education videos and detailed Product Demos on the website. This is the "meat" of the product marketing.
Strategic Trade-offs: It exposes the actual product. If your UI is outdated or cluttered, this style will highlight those flaws. It requires a UI that is actually "clean" to be effective.
Companies using similar video content -
Enfusion – Cloud-Native Platform – Clean, unified UI for front-to-back office.
SimCorp – Dimension – Integrated, clean UI for investment management.
9. Photorealistic 3D Renders
MOFU | Feature Education

The Visual & Narrative Approach
Visualization Scenario: In a high-end, high-key studio environment, a hyper-realistic crystalline glass shield hovers, protecting a floating silver sphere (the asset/data) inside it. The lighting is bright white, creating sharp, pristine reflections and refractions on the glass surface. The shield has thickness and weight; it feels impenetrable.
Narration Style and Tone: Serious, authoritative, and reassuring. The keywords are "Security," "Protection," and "Integrity."
Psychological Impact & KPI Focus
Niche Psychology: Security is the number one anxiety for capital markets. This style uses the physical properties of glass (transparency) and the shield form (protection) to communicate "Transparent Security." It assures the client that the system is secure (shielded) but not opaque (glass).
Operational Impact: Visualizes "Risk Mitigation" and "Cybersecurity." It turns the invisible concept of a firewall or encryption protocol into a tangible, unbreakable physical object.
Strategic Implementation & Trade-offs
Best Use Case: Whitepapers (PDFs), Trust Center web pages, and high-level security overviews.
Strategic Trade-offs: Extremely expensive to produce well. Poor photorealism looks cheap and destroys trust. It is also static; it doesn't explain how the security works, only that it exists.
Companies using similar video content -
NICE Actimize – Financial Crime Platform – Visualizes robust fraud and compliance protection.
ComplyAdvantage – AI-driven AML – Renders a clear shield against financial crime.
11. Split Screen: Reality/UI
MOFU | Overcoming Objections
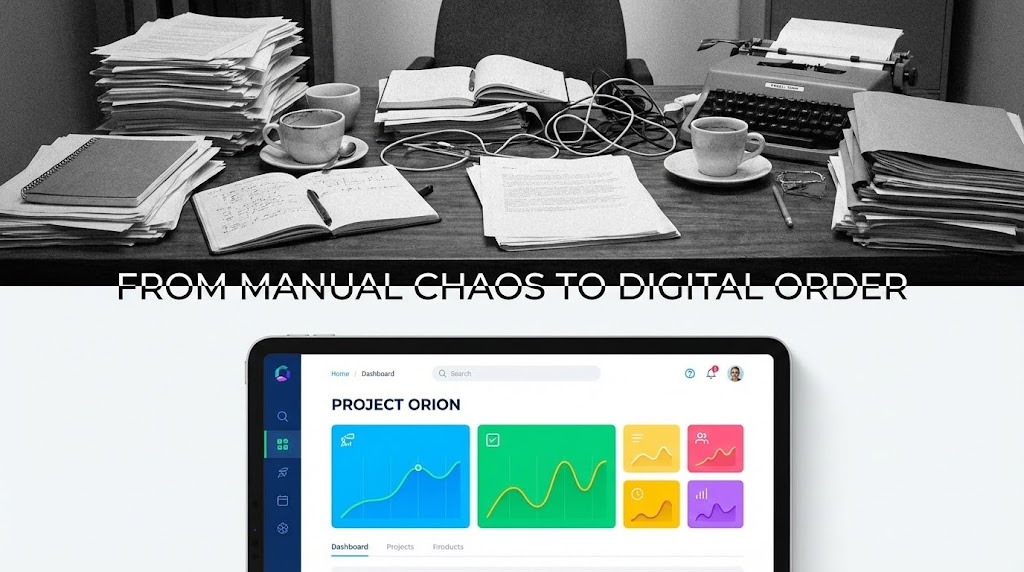
The Visual & Narrative Approach
Visualization Scenario: A horizontal split-screen composition. The top half depicts the "Old World": a desaturated, black-and-white moving image of a cluttered trader's desk—stacks of paper blotters, sticky notes, and disconnected phone lines. The bottom half juxtaposes this with the "New World": a vibrant, clean UI dashboard (in modern Grey/Colorful palette) where those same chaotic elements are organized into a streamlined digital workflow.
Narration Style and Tone: Transformational and empathetic. It acknowledges the pain of the legacy process without mocking it, then offers the digital solution as a natural evolution.
Psychological Impact & KPI Focus
Niche Psychology: Many firms are still trapped in "Excel Hell" or legacy infrastructure. This style validates their pain points (chaos, fragmentation) and offers an immediate visual cure. It leverages the "Contrast Principle" to make the software's value self-evident.
Operational Impact: Directly visualizes "Operational Alpha." It shows the elimination of manual reconciliation errors and the consolidation of disparate workflows into a Single Source of Truth (SSOT).
Strategic Implementation & Trade-offs
Best Use Case: Competitive Displacement campaigns and Case Study videos showing "Before & After" scenarios.
Strategic Trade-offs: You must be careful not to make the "Before" state look too exaggerated or comical, otherwise, it risks alienating potential clients who currently operate that way. It must feel authentic.
Companies using similar video content -
SteelEye – Compliance Platform – Provides comprehensive data lineage and audit trails.
S&P Global Market Intelligence – RegTek Solutions – Ensures traceable and auditable data for compliance.
12. Dynamic Data Visualization
MOFU | Competitive Displacement

The Visual & Narrative Approach
Visualization Scenario: We are in a bright, pristine 3D space. Data is not shown as flat numbers, but as physical objects. 3D bar charts composed of translucent glass and metallic elements (Magenta/Purple gradients) grow upwards from the floor like skyscrapers constructing a city. Coins or data tokens stack rapidly, reacting to market inputs. The camera angles are low and wide, emphasizing the magnitude and growth of the assets.
Narration Style and Tone: Energetic, growth-oriented, and celebratory. The focus is on "Performance," "Yield," and "Market Depth."
Psychological Impact & KPI Focus
Niche Psychology: Financial professionals are driven by growth—of assets, of margins, of liquidity. This style turns abstract percentages into tangible "wins." It triggers the "Reward System" in the brain, associating the software with financial success and abundance.
Operational Impact: Ideal for visualizing "Portfolio Performance" or "Liquidity Depth." It makes the concept of "market share" or "AUM growth" feel physical and substantial, rather than just a number on a spreadsheet.
Strategic Implementation & Trade-offs
Best Use Case: Year-in-Review videos for clients, or specific feature highlights regarding Analytics and Reporting modules.
Strategic Trade-offs: It is highly stylized and metaphorical. It does not show the actual interface, so it cannot be used to teach a user how to generate the report, only to celebrate the result of the report.
Companies using similar video content -
SS&C Technologies – Charles River IMS – Consolidates investment management workflows.
Finastra – FusionFabric.cloud – Bridges legacy systems with modern cloud solutions.
13. Rapid UI Feature Montage
MOFU | ABM Awareness
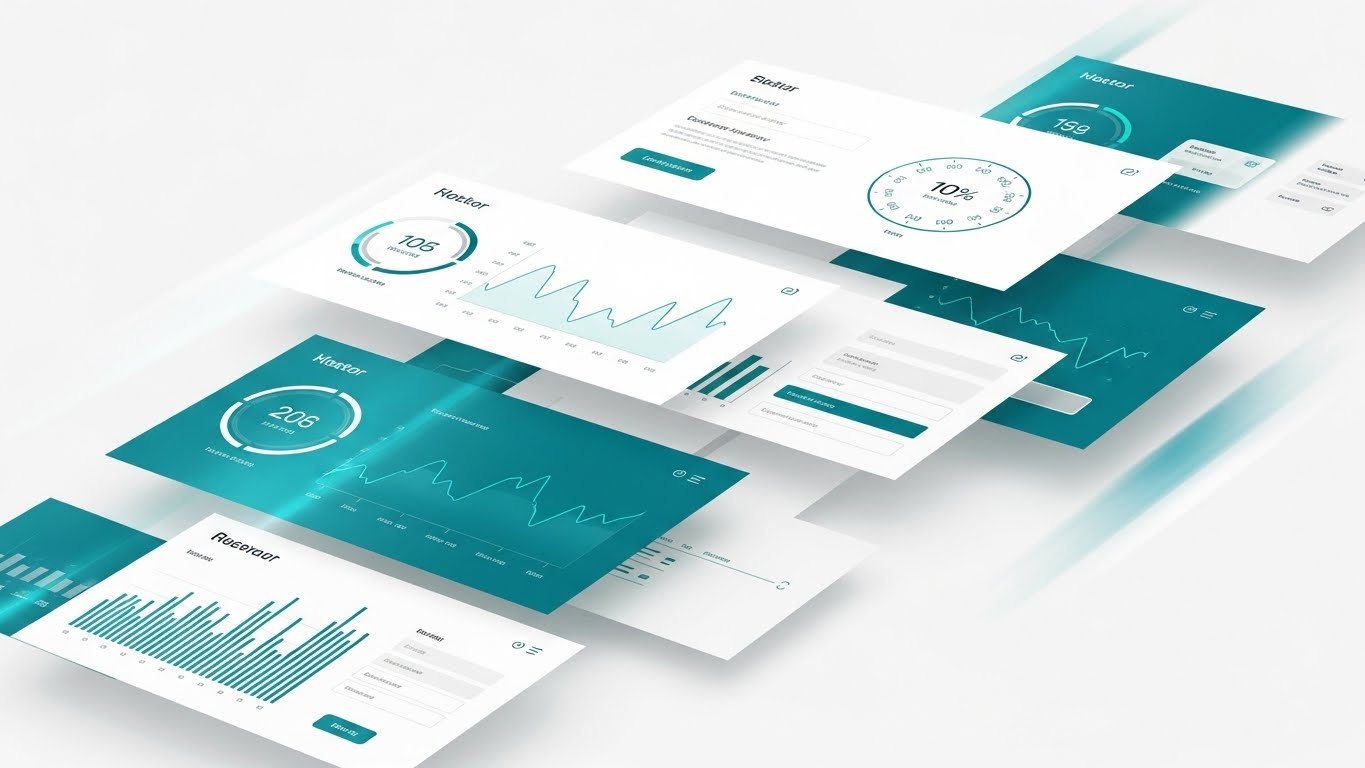
The Visual & Narrative Approach
Visualization Scenario: A high-energy sequence designed to convey speed and comprehensiveness. Diagonal slices of various UI screens (Teal and Silver accents) fly across the screen, layering over one another. We see flashes of an Equities blotter, then a Derivatives graph, then a FX spot rate—all moving with "whoosh" motion blur effects. The background remains a clean white to maintain focus on the UI slices.
Narration Style and Tone: Fast-paced, rhythmic, and confident. The script is a rapid-fire list of capabilities: "Equities. FX. Crypto. All in one execution layer."
Psychological Impact & KPI Focus
Niche Psychology: Traders value speed and multi-asset capability. They fear "toggle tax"—the time lost switching between different systems for different asset classes. This style visually demonstrates "Unified Execution," assuring the trader they can handle any market condition from a single pane of glass.
Operational Impact: Visualizes "Throughput" and "Asset Class Coverage." It effectively communicates that the platform is a comprehensive "One-Stop-Shop" rather than a point solution.
Strategic Implementation & Trade-offs
Best Use Case: Programmatic Display Video Ads and Social Media Retargeting (LinkedIn/Twitter) where attention spans are short (under 15 seconds).
Strategic Trade-offs: The pace is too fast for educational retention. Viewers won't remember specific features, just the feeling of speed and coverage. It is an impression play, not an education play.
Companies using similar video content -
Addepar – Wealth Management Platform – Visualizes complex portfolio analytics and growth.
Orion Advisor Solutions – Orion Platform – Dynamic reporting for portfolio performance.
14. Futuristic Neon/Dark Mode
MOFU | Programmatic Display
The Visual & Narrative Approach
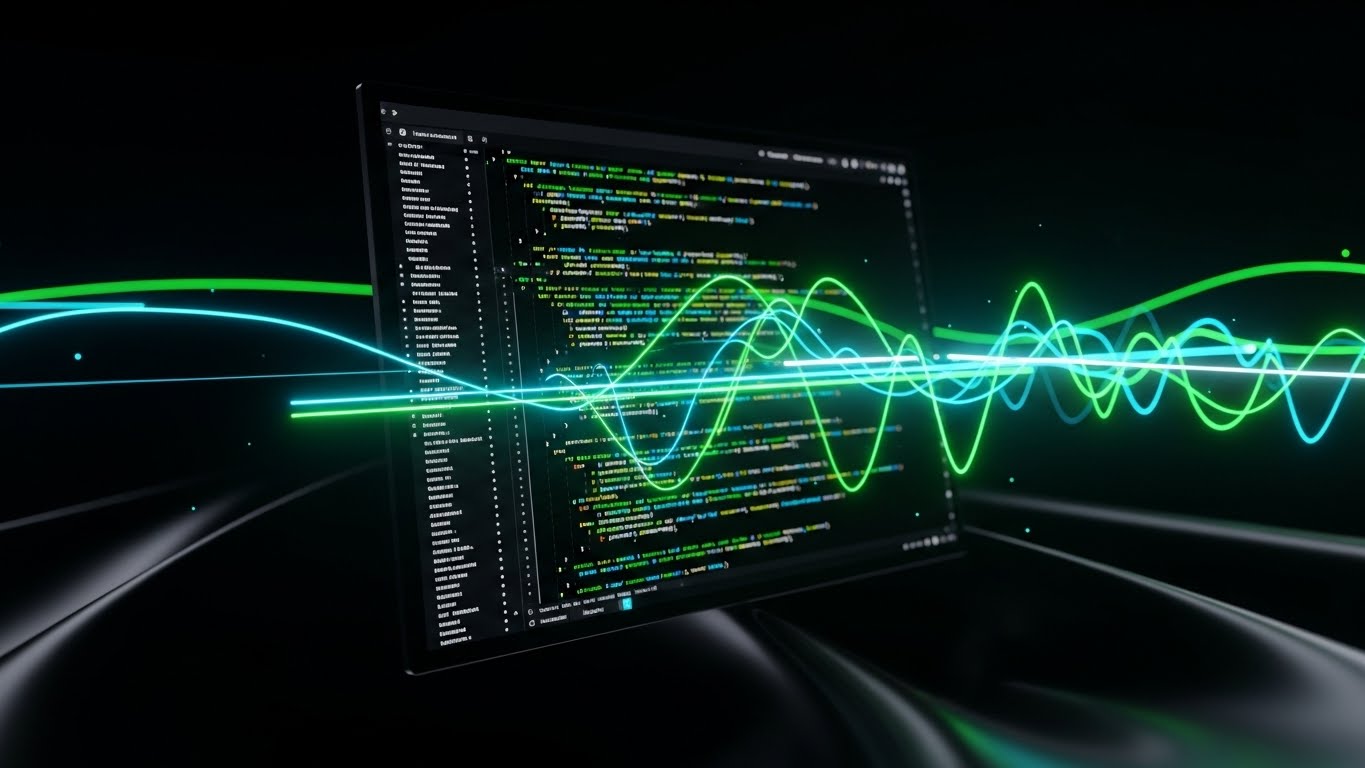
Visualization Scenario: The environment shifts to a deep, "Cyberpunk" Black. We adopt a First-Person POV looking at a developer's code editor or a terminal window. Syntax highlighting glows in Neon Green and bright White against the dark background. The code scrolls rapidly—representing a live API feed or FIX protocol message logs. Abstract "data waves" flow out from the code, connecting to the wider market.
Narration Style and Tone: Tech-savvy, developer-centric, and sophisticated. The tone speaks the language of the "Builder": APIs, SDKs, Latency, and Integration.
Psychological Impact & KPI Focus
Niche Psychology: For the CTO and the Quantitative Developer, the "UI" is often secondary to the API. They want to see the code. This style respects their expertise, signaling that the platform is "Developer First" and built for customization. It looks "cool" in a way that resonates with engineering culture.
Operational Impact: Directly targets "Interoperability" and "Customization." It proves that the "Black Box" is accessible and that the platform allows for deep, programmatic access to market data and execution venues.
Strategic Implementation & Trade-offs
Best Use Case: Developer Documentation portals, API product pages, and technical webinars tailored for Quant teams.
Strategic Trade-offs: This style can alienate non-technical buyers (e.g., a fundamental portfolio manager) who might find the code intimidating or irrelevant. It is a niche style for a specific buying persona.
Companies using similar video content -
Murex – MX.3 – Showcases multi-asset trading and risk capabilities.
Calypso Technology – Cross-Asset Platform – Highlights broad asset class support and speed.
Aquis – Liquidnet – Demonstrates rapid execution across diverse equities.
15. Low-Poly 3D Modeling
BOFU | Technical Buyer

The Visual & Narrative Approach
Visualization Scenario: A minimalist, clean aesthetic featuring low-poly 3D geometric shapes. We see stylized Gold bars and metallic ingots stacking neatly on a floating white pedestal. The lighting is soft and ambient, creating gentle shadows. The simplistic rendering strips away noise, focusing purely on the accumulation of value.
Narration Style and Tone: Simple, direct, and value-focused. The narrative simplifies complex financial gains into clear, understandable concepts: "Savings," "Efficiency," "Accumulation."
Psychological Impact & KPI Focus
Niche Psychology: In a complex market, simplicity is a luxury. This style appeals to the "Economic Buyer" (CFO/COO) who cares about the bottom line. It removes the noise of how the money is made and focuses entirely on the fact that money is saved or generated.
Operational Impact: Visualizes "Cost Savings" and "Capital Efficiency." It is perfect for illustrating margin offsets, collateral optimization, or the reduction of operational costs.
Strategic Implementation & Trade-offs
Best Use Case: ROI Calculators, Pitch Decks, and high-level conceptual slides where you need to illustrate "Value" without getting bogged down in technical details.
Strategic Trade-offs: It can feel too "cartoonish" for very high-stakes, risk-averse narratives (like cybersecurity). It works best for positive, gain-focused messages.
Companies using similar video content -
Alpaca – Trading API – Emphasizes developer-first approach with code.
QuantConnect – Lean Engine – Showcases algorithmic trading code and backtesting.
16. 3D X-Ray Visualization
BOFU | ROI Justification

The Visual & Narrative Approach
Visualization Scenario: A high-tech server rack or hardware component is presented in a sterile white lab environment. The outer shell of the server is rendered in Translucent Blue plastic. A "scan" light passes over it, revealing the internal architecture—glowing White cores, heat pipes, and secure enclaves. We see the "heartbeat" of the system, pulsating with red/green status indicators.
Narration Style and Tone: Clinical, forensic, and secure. The keywords are "Transparency," "Auditability," and "Deep Inspection."
Psychological Impact & KPI Focus
Niche Psychology: Risk Managers and Compliance Officers live in fear of what they can't see. This style offers "Total Visibility." It visually assures them that there are no hidden vulnerabilities, no backdoors, and that the system's internal logic is sound and robust.
Operational Impact: Perfect for "Cybersecurity" and "Hardware Acceleration" (FPGA) topics. It explains complex internal routing or encryption processes by physically showing the data moving "inside" the machine.
Strategic Implementation & Trade-offs
Best Use Case: Whitepapers on Security Architecture, Compliance Demos, and "Under the Hood" technical deep dives.
Strategic Trade-offs: It is technical and somewhat cold. It speaks to the "Guardian" persona (Risk/Compliance) but may fail to excite the "Hunter" persona (Sales/Trading) who focuses on speed and flow.
Companies using similar video content -
Adenza – AxiomSL – Simplifies complex regulatory reporting for cost efficiency.
Temenos – Banking Cloud – Visualizes simplified core banking operations and savings.
17. Lifestyle Stock with UI
BOFU | Risk Mitigation

The Visual & Narrative Approach
Visualization Scenario: A shift to the human side of trading. A cinematic, over-the-shoulder shot of a professional woman in a sun-drenched, high-end coffee shop. She is relaxed, holding a tablet. A sleek, semi-transparent UI overlay (Success Notification) floats subtly above the device screen. The lighting is warm and natural, contrasting with the usual dark trading floor imagery.
Narration Style and Tone: Aspirational, human, and liberating. It sells the "Lifestyle" of the modern financier—untethered from the desk, yet fully in control.
Psychological Impact & KPI Focus
Niche Psychology: The modern workforce demands flexibility. This style appeals to the desire for "Work-Life Balance" and "Mobility." It counters the stereotype of the chained-to-the-desk trader, promising freedom through superior mobile technology.
Operational Impact: Visualizes "Remote Access" and "Cloud Capability." It proves the system is not premise-bound and supports the "Anywhere, Anytime" workflow essential for global 24/7 markets.
Strategic Implementation & Trade-offs
Best Use Case: Careers pages, "About Us" videos, and features highlighting Mobile Apps or Cloud Portals.
Strategic Trade-offs: It can look like a generic bank ad if the UI overlay isn't specific and sharp. The integration of the UI must be perfect to avoid looking like cheap stock footage.
Companies using similar video content -
Enyx – FPGA Solutions – Reveals internal workings of hardware-accelerated trading.
KX (Kx Systems) – kdb+ – Visualizes deep internal processing of time-series data.
18. 3D Parallax UI Presentation
BOFU | Sales Acceleration

The Visual & Narrative Approach
Visualization Scenario: The camera explores a 3D space filled with floating, glass-like UI panels. These aren't flat screenshots; they are separated into layers (depth) using the "Glassmorphism" aesthetic (Soft Blue and White). The camera pans sideways, revealing the relationship between the Front Office (Trade Entry), Middle Office (Risk Check), and Back Office (Settlement) screens. They float in alignment, suggesting a connected ecosystem.
Narration Style and Tone: Holistic, integrated, and smooth. The narrative emphasizes "Connection," "Flow," and "End-to-End Visibility."
Psychological Impact & KPI Focus
Niche Psychology: Operations managers struggle with "siloed" data. This style visually dismantles those silos. By showing the screens floating together in the same space, it visually proves "Integration." It gives the viewer a "God's Eye View" of the entire trade lifecycle.
Operational Impact: Targets "Straight-Through Processing" (STP). It shows that data entered in screen A flows naturally to screen B and C without manual re-entry, reducing breaks and errors.
Strategic Implementation & Trade-offs
Best Use Case: Email Marketing (GIFs) and Demo Request landing pages. It creates a premium, high-tech feel that elevates the perceived value of the software suite.
Strategic Trade-offs: It requires high-fidelity design assets. If the base UI is ugly, floating it in 3D won't fix it. It requires a "Design-First" product to really shine.
Companies using similar video content -
Envestnet – Financial Wellness Platform – Showcases mobile access for wealth management.
BlackRock – Aladdin – Demonstrates flexible, cloud-based access to portfolio insights.
19. Generative AI Realistic Character
BOFU | Demo Requests

The Visual & Narrative Approach
Visualization Scenario: A medium shot of a confident, silver-haired CEO or Senior Partner in a navy suit, standing in a bright, modern office with a skyline view (London or New York). They are looking at a holographic projection of a globe, interacting with data points that span continents. The lighting is natural and premium. The character exudes experience and stability.
Narration Style and Tone: Leadership-focused, global, and authoritative. The voice is that of a peer—a fellow leader discussing "Global Strategy," "Macro Trends," and "Resilience."
Psychological Impact & KPI Focus
Niche Psychology: Institutional buyers (Tier-1 Banks) buy from people, not just algorithms. They need to feel that the vendor understands the gravity of their business. This style leverages "Authority Bias" and "Social Proof." It mirrors the client's own self-image of sophistication and control.
Operational Impact: Visualizes "Global Reach" and "Strategic Partnership." It moves the conversation beyond features and bugs to partnership and long-term industry vision.
Strategic Implementation & Trade-offs
Best Use Case: LinkedIn Thought Leadership videos, "Message from the CEO," and Account-Based Marketing (ABM) campaigns targeting the C-Suite.
Strategic Trade-offs: The AI character must be flawless. Any "uncanny valley" jitter will destroy credibility instantly. It is often safer to use real actors for this, but AI allows for rapid localization (lip-syncing in different languages) which is a massive strategic advantage for global vendors.
Companies using similar video content -
ION Group – OpenLink – Visualizes integrated treasury and risk management.
Broadridge – Post-Trade Solutions – Shows seamless flow across the trade lifecycle.
21. Minimalist Flat 2D Vector
BOFU | ROI Hook

The Visual & Narrative Approach
Visualization Scenario: A minimalist vector illustration set against a calming Pale Green background. Three crisp, white icons—a Gear, an Arrow, and a Checkmark—are connected by a simple horizontal line. This represents a linear 1-2-3 progression. There is zero visual noise; the design uses "negative space" to create a sense of breathing room and simplicity.
Narration Style and Tone: Calm, reassuring, and methodical. The voiceover emphasizes "Simplicity," "Speed," and "Ease of Implementation."
Psychological Impact & KPI Focus
Niche Psychology: "Implementation Friction" is a massive barrier to sale. Buyers fear a 6-month integration nightmare. This style visually counters that fear by presenting the onboarding process as a simple, linear, finite journey. It promises "Cognitive Ease."
Operational Impact: Visualizes "Time-to-Value." It demonstrates that the path from purchase (Gear) to value realization (Checkmark) is short, direct, and manageable.
Strategic Implementation & Trade-offs
Best Use Case: Onboarding Welcome videos and "Implementation Roadmap" slides in the final sales deck.
Strategic Trade-offs: It is highly stylized and reductive. It represents the concept of the process, not the actual complexity of API integration, so it must be backed by detailed documentation.
Companies using similar video content -
MSCI – ESG & Climate Solutions – Features thought leaders discussing global impact.
Moody's Analytics – Risk & Finance Solutions – Presents expert insights on market trends.
22. 2D Animation & UI
Onboarding | Implementation Friction

The Visual & Narrative Approach
Visualization Scenario: A friendly, 2D character rendered in Vibrant Pink stands on a white surface with a subtle abstract dot pattern. The character smiles and points enthusiastically at a floating, semi-realistic UI button labeled "Self Serve." The visual combines the charm of a mascot with the literal representation of a UI element, acting as a bridge between the user and the software.
Narration Style and Tone: Helpful, encouraging, and guiding. It sounds like a helpful colleague showing you a shortcut.
Psychological Impact & KPI Focus
Niche Psychology: Users often ignore powerful features because they are afraid to break something. This style uses the "Guide" archetype to encourage "Exploration." The friendly character reduces the intimidation factor of complex trading dashboards.
Operational Impact: Targets "Feature Adoption" and "Self-Sufficiency." By visually guiding the user to "Self-Serve" tools, it encourages behaviors that reduce dependency on support teams.
Strategic Implementation & Trade-offs
Best Use Case: In-App Product Tours, Feature Release announcements, and Learning Management System (LMS) modules.
Strategic Trade-offs: If the character is too "cute," it might feel patronizing to senior traders. It is best used for operational or junior staff training rather than C-suite strategy overviews.
Companies using similar video content -
FactSet – Portfolio Analysis – Enables interactive exploration of portfolio scenarios.
S&P Global Market Intelligence – Kensho – Provides interactive AI-driven insights.
23. Macro UI Micro-Interactions
Onboarding | Self-Serve Onboarding

The Visual & Narrative Approach
Visualization Scenario: An extreme close-up (macro) 3D render of a single circular button. The button is Red with a polished Silver bezel, sitting on a pristine white surface. A finger (slightly blurred to maintain focus on the button) is poised to press it. The text "GO" is crisp on the button face. The lighting highlights the texture and the tactile "clickability" of the element.
Narration Style and Tone: Anticipatory, decisive, and exciting. Sound design is critical here—the "click" must sound satisfying and solid.
Psychological Impact & KPI Focus
Niche Psychology: This style zooms in on the "Moment of Truth." It creates a visceral, tactile connection to the software. It triggers the impulse to act, to click, to engage. It transforms a digital action into a physical sensation.
Operational Impact: Visualizes "User Activation." It is designed to trigger a specific behavior—getting the user to take the first step, launch the first trade, or activate the account.
Strategic Implementation & Trade-offs
Best Use Case: Call-to-Action (CTA) sequences at the end of videos, and "Welcome" emails encouraging the first login.
Strategic Trade-offs: It is a specific shot, not a full narrative. It serves as visual punctuation—an exclamation point—rather than a full sentence.
Companies using similar video content -
Calastone – Distributed Market Infrastructure – Simplifies fund transaction processing.
Adaptive Financial Consulting – Streamlines complex financial processes.
24. Holographic UI over 3D
Onboarding | User Activation

The Visual & Narrative Approach
Visualization Scenario: A sleek, metallic tabletop device sits in a blurred, bright corporate conference room. It projects a rotating, translucent Blue hologram of the Earth. The globe glows, indicating active connections. This futuristic display suggests that support and connectivity are not just software features, but a tangible presence in the room with the client.
Narration Style and Tone: Global, reassuring, and constant. The focus is on "24/7 Availability," "Follow-the-Sun Support," and "Ubiquity."
Psychological Impact & KPI Focus
Niche Psychology: In global markets, "downtime" is a dirty word. Clients need to know that support is awake when they are. This style visualizes "Omnipresence." It assures the client that the vendor's presence surrounds them, protecting their operations globally.
Operational Impact: Visualizes "Support Availability" and "Network Reliability." It counters the fear of being left alone during a critical Asia-Pacific or European trading session.
Strategic Implementation & Trade-offs
Best Use Case: Help Center headers, Support Page videos, and "Contact Us" sections.
Strategic Trade-offs: It frames support as high-tech, which is good, but it must be backed by actual human availability. The visual promises a premium tier of service.
Companies using similar video content -
Iress – QuantHouse – Guides users through market data and trading features.
Vela Trading Technologies – Market Data & Execution – Simplifies complex data consumption.
25. Aspirational Stock Montage
Retention | Support Overhead

The Visual & Narrative Approach
Visualization Scenario: A cinematic shot of a senior executive (male, silver fox) standing in a high-rise office with floor-to-ceiling windows. He looks out over a dense city skyline (New York or Hong Kong). A subtle, high-tech holographic globe floats in the reflection of the window, overlaying his view. The lighting is natural, cool, and premium. He looks contemplative and in control.
Narration Style and Tone: Visionary, high-level, and strategic. The narrative ignores features to talk about "Market Leadership," "Foresight," and "Legacy."
Psychological Impact & KPI Focus
Niche Psychology: This style mirrors the self-image of the "Strategic Buyer" (CEO/CIO). It appeals to their desire to be seen as visionaries who use technology to conquer markets. It moves the conversation from "software" to "competitive advantage."
Operational Impact: Visualizes "Long-Term Partnership" and "Churn Reduction." By aligning the software with the client's high-level success, it makes the vendor essential to their strategic identity.
Strategic Implementation & Trade-offs
Best Use Case: Quarterly Business Reviews (QBRs), Client Newsletters, and "State of the Market" thought leadership videos.
Strategic Trade-offs: It is generic. If the holographic overlay isn't branded, it could be an ad for any consulting firm. It needs strong brand voiceover to claim ownership.
Companies using similar video content -
Nasdaq – TradeGuard – Focuses on critical action points for market integrity.
MarketAxess – Open Trading – Highlights key interaction points for bond trading.
26. Isometric 3D Workflow
Retention | Reducing Churn
The Visual & Narrative Approach
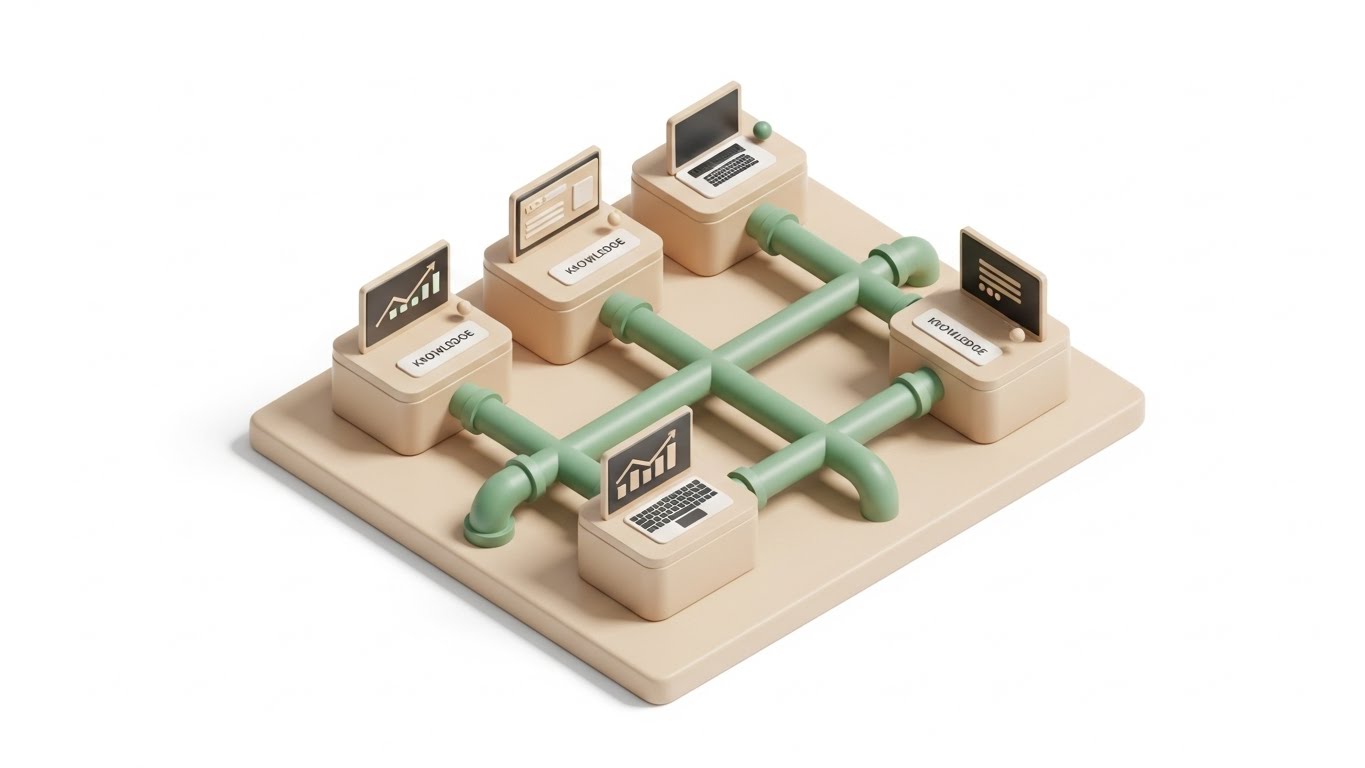
Visualization Scenario: An isometric 3D render of a "Knowledge Factory." Miniature workstations in Sage Green and Beige are connected by green pipes. Floating screens above each station show charts and data. The "pipes" visually represent the flow of information between learning modules. The style is soft, tactile (almost like clay), and inviting.
Narration Style and Tone: Educational, structured, and clear. It explains how information moves and how users learn.
Psychological Impact & KPI Focus
Niche Psychology: Training is often seen as a chore. This style "gamifies" the concept of learning. The toy-like aesthetic makes the acquisition of knowledge feel constructive and building-block simple, rather than academic and tedious.
Operational Impact: Visualizes "Knowledge Base" and "LMS Structure." It encourages users to engage with training materials by framing the system as an interconnected, logical ecosystem.
Strategic Implementation & Trade-offs
Best Use Case: Knowledge Base landing pages, "How to Use this Guide" videos, and Educational Series intros.
Strategic Trade-offs: It is very stylized. It works for explaining the concept of the workflow, but not for showing the actual UI buttons to click.
Companies using similar video content -
AWS for Financial Services – Global Network – Visualizes worldwide infrastructure and support.
Microsoft Azure for Financial Services – Enterprise Support – Showcases global reach for financial clients.
27. Dark Mode UI Showcase
Retention | Knowledge Base
The Visual & Narrative Approach
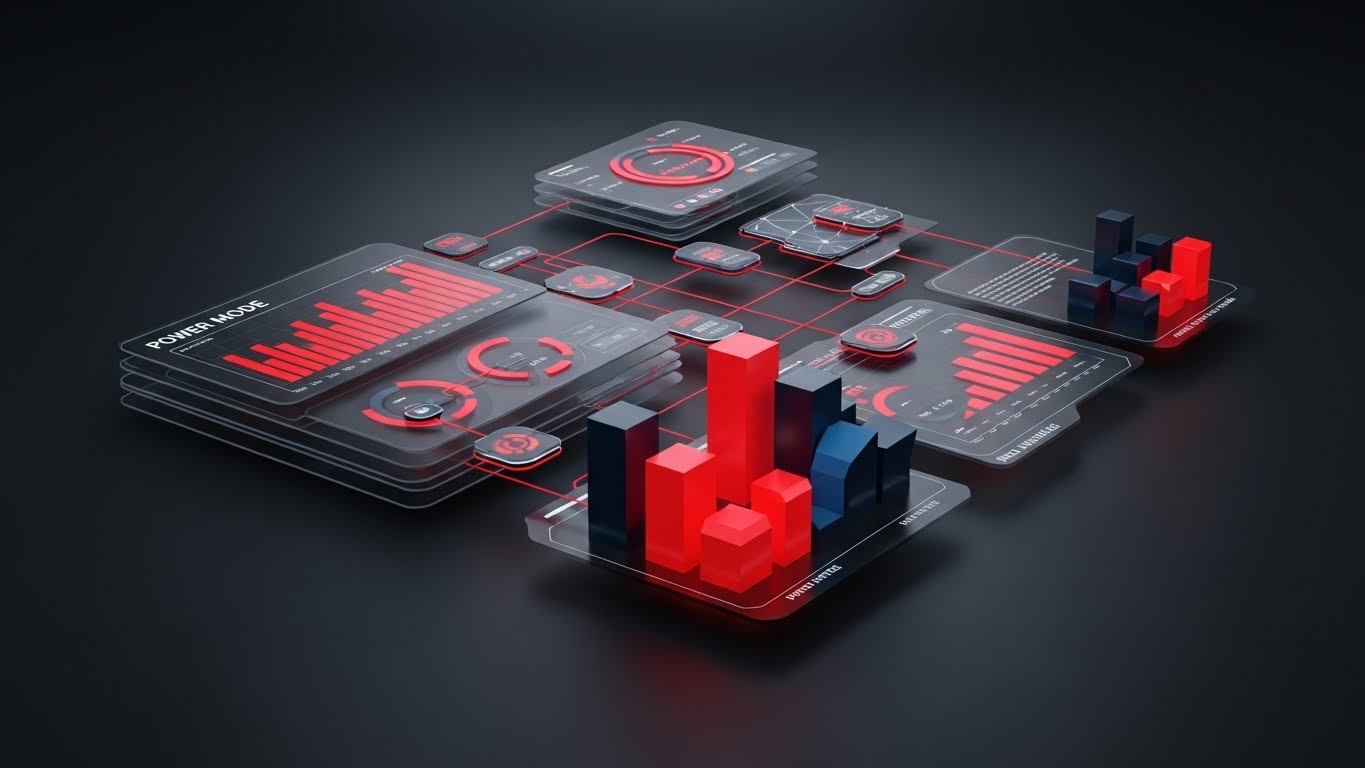
Visualization Scenario: A sleek, high-contrast "Dark Mode" UI showcase. The background is a deep Charcoal Grey. Complex 3D bar charts and data panels float in the space, highlighted in Red and Dark Blue. The perspective is dynamic and tilted, suggesting depth. This is not the "lite" version; this is the pro-grade cockpit for the power user.
Narration Style and Tone: Intense, sophisticated, and expert. The keywords are "Deep Dive," "Analytics," "Pro," and "Insight."
Psychological Impact & KPI Focus
Niche Psychology: "Power Users" (Quants, Senior Traders) often reject "fisher-price" interfaces. They want density and contrast. This style signals respect for their expertise. It tells them: "This tool can handle your complexity."
Operational Impact: Targets "Deep Feature Adoption" and "Expansion." It entices existing users to upgrade or explore advanced modules by making them look powerful and exclusive.
Strategic Implementation & Trade-offs
Best Use Case: New Feature Launches (Upsell), Advanced Training Webinars, and "Pro Tier" product pages.
Strategic Trade-offs: It can be intimidating for a novice user. It should be segmented specifically for the advanced cohort of the user base.
Companies using similar video content -
FIS – Omni-Channel Solutions – Positions itself as a strategic partner for growth.
SS&C Technologies – Global Wealth & Asset Management – Emphasizes long-term client success.
28. 2D Graphics Over Live Action
Expansion | Deep Feature Adoption

The Visual & Narrative Approach
Visualization Scenario: A static, front-on photo of a sleek laptop on a white desk. Suddenly, an explosion of colorful 2D vector icons—Stars, Gears, and Lightbulbs—bursts out from the screen. A banner reading "UNLOCK NEW FEATURES!" appears. The mix of the real world (laptop) and the illustrated "magic" creates a sense of surprise and delight.
Narration Style and Tone: Energetic, surprising, and celebratory. It is a "Wake Up!" call to the user base.
Psychological Impact & KPI Focus
Niche Psychology: Users get bored with software. They suffer from "feature blindness." This style breaks that monotony with a "Pattern Interrupt." It triggers curiosity and the dopamine hit of getting something new.
Operational Impact: Targets "Upsell" and "Feature Awareness." It screams that there is something valuable waiting to be discovered, prompting the user to click the upgrade button.
Strategic Implementation & Trade-offs
Best Use Case: Email Marketing campaigns for new releases, and "What's New" webinars.
Strategic Trade-offs: It is very "marketing-heavy." It lacks the gravitas of the other styles, so it should be used sparingly, specifically for announcements, not for core brand identity.
Companies using similar video content -
SimCorp – SimCorp Academy – Visualizes structured learning paths for its platform.
Adenza – Learning & Certification – Explains knowledge transfer for regulatory solutions.
29. Hyper-lapse Stock Footage
Expansion | Upsell

The Visual & Narrative Approach
Visualization Scenario: A vertical (9:16) hyper-lapse video of a financial city (NY or London) during the day. White and yellow traffic lines blur into continuous streams of light. Clouds race across the blue sky. The city is alive, moving at high speed. The visual conveys the constant, pulsating energy of the market.
Narration Style and Tone: Fast, rhythmic, and connecting. "Momentum," "Network," "Referral," "Movement."
Psychological Impact & KPI Focus
Niche Psychology: Markets never sleep. Traders want to feel plugged into the "Main vein" of the industry. This style visualizes the "Pulse" of the market. It implies that by referring others to the platform, the user is building a stronger, faster network for everyone.
Operational Impact: Visualizes "Referrals" and "Market Activity." It is used to drive advocacy programs, suggesting that the platform is the central nervous system of this bustling city.
Strategic Implementation & Trade-offs
Best Use Case: Social Media Shorts (TikTok/Reels/LinkedIn Stories) and Referral Program landing pages.
Strategic Trade-offs: It is a mood piece. It conveys energy but zero information. It must be paired with text overlays to have any specific meaning.
Strategic Knowledge Base: The Visual Operations Doctrine
To bridge the gap between "looking good" and "working well," Capital Markets firms must adopt a strategic framework for visual communication. This is not about decoration; it is about Operational Clarity. The following three segments outline how to deploy these 30 styles to drive adoption, efficiency, and ROI.
Strategic Alignment & Visual Architecture
The "Pre-Production" Strategy – Why and Who.
- The Cognitive Load Audit: Before commissioning a single pixel, audit the "Visual Noise" of your current training materials. Does a trader need to read 500 words to understand a trade break, or can a Clean UI Workflow (Style 8) explain it in 5 seconds?
- Role-Based Visual Mapping: Differentiate your visual strategy by persona. A Head of Desk needs the "God's Eye View" of Isometric 2D Motion (Style 7) to see infrastructure, while a Quant needs the precise logic of 2D Line Art (Style 4). Don't use "Marketing Fluff" for "Technical Buyers."
- The "Glanceability" Standard: In HFT and active trading environments, screens are dense. Marketing visuals must mimic the "glanceability" of a good trading blotter. Use Bold Kinetic Typography (Style 5) to prove that your software respects the trader's visual attention economy.
- Brand Voice Consistency: Your visual language must be consistent across the stack. Ensure the "Human" tone of your 2D Character (Style 21) videos matches the "Helpful" tone of your support documentation.
- The Advids Strategic Audit: A fragmented visual identity suggests a fragmented platform. Engaging with partners like Advids early allows for the creation of a "Visual Operating System," ensuring that Sales, Product, and Success teams speak the same visual language.
- Standardization vs. Customization: For Tier-1 bank clients, white-labeling is key. Use Minimalist Flat Vector (Style 22) for standardized processes to keep costs low, but ensure your Rapid UI (Style 14) assets can be easily re-colored to match a bank's specific brand palette for ABM campaigns.
- The Cross-Departmental Bridge: Use visuals to unify terminology. A 3D Parallax UI (Style 18) video can help Sales, Ops, and Support teams visualize the exact same trade lifecycle, eliminating communication silos.
- Legacy System Integration: Visualizing the cloud is easy; visualizing the connection to a 30-year-old mainframe is hard. Use Split Screen (Style 11) visuals to respectfully validate the client's current legacy "Excel Hell" before pivoting to your modern solution.
- Accessibility in Global Markets: Capital markets are global. Ensure Motion Graphics (Style 2) rely on universal visual symbols (arrows, nodes, locks) rather than heavy on-screen text to reduce localization costs.
- The Mobile-First Mandate: Decision-makers are mobile. All 30 styles, especially Lifestyle Stock (Style 17), must be legible on a smartphone screen. If your value prop isn't clear on a 6-inch screen, it won't sell to a traveling CTO.
Operational Adoption & Implementation
The "Deployment" Phase – How to embed visuals into the workflow.
- Overcoming "Black Box" Anxiety: Use Abstract 3D AI Visualization (Style 6) to demystify your algorithms. Showing the "thinking" process builds trust with Risk Managers who fear what they can't see.
- The Micro-Learning Shift: Replace 50-page PDF manuals with a library of 30-second Rapid UI Feature Montages (Style 13). Traders will watch a 30-second clip; they will not read a manual.
- Just-in-Time Support: Embed 2D Animation & UI (Style 23) directly into the platform's "Help" widgets. Visual support at the moment of error prevents a support ticket.
- Gamification of Performance: Use Dynamic Data Visualization (Style 12) to show traders their own performance metrics. Visualizing "Alpha" generation increases engagement with the analytics modules.
- Reducing Support Ticket Volume: There is a direct correlation between the quality of your Isometric 3D Workflow (Style 27) videos and the volume of "How do I...?" support tickets. Proactive education is cheaper than reactive support.
- Remote Onboarding: Leverage Holographic UI (Style 25) concepts to conduct virtual onboarding sessions. Make the remote experience feel as high-touch as an on-site visit.
- Standard Operating Procedures (SOPs): Transform static text SOPs into linear Minimalist Flat Vector (Style 22) flows. Visual checklists reduce operational errors in settlement and reconciliation.
- Feedback Loops: Use interactive video elements to poll users on feature utility immediately after they watch a feature update (using Style 29 concepts).
- Scalable Localization: When expanding to APAC or EMEA, use Abstract Motion (Style 2) which requires minimal text translation, speeding up your go-to-market time in new regions.
- Leadership Communication: Use Generative AI Realistic Character (Style 19) or high-end stock to deliver CEO messages. In times of market volatility, the "face" of the company matters as much as the tech.
Measuring Impact & Future-Proofing
The "ROI" Phase – Measuring success and looking ahead.
- Beyond "Views": Don't measure video success by views. Measure "Feature Adoption Rate" after a Dark Mode UI Showcase (Style 28) campaign. Did usage of the Pro features go up?
- The "Idle Time" Metric: Correlate better visualization with reduced software navigation time. If Macro UI (Style 24) training saves a trader 5 minutes a day, that is massive ROI across a floor of 100 traders.
- Compliance Velocity: Measure how fast new regulations (e.g., T+1 Settlement) are understood by staff when explained via 3D X-Ray (Style 16) versus a text memo. Visuals should accelerate regulatory compliance.
- Retention and Churn: High-quality Aspirational Stock (Style 26) content reinforces the client's decision to stick with you. It reminds them they are part of a premium ecosystem.
- The AI Visual Frontier: Prepare for real-time generative video. In the future, your Abstract AI (Style 6) visualizations might be generated live based on the client's actual portfolio data.
- Scalability of Assets: Build a modular asset library. The nodes from your Network Visualization (Style 1) should be reusable in your Security Shield (Style 9) videos.
- The Advids Partnership: Scale is the challenge. Partnering with Advids allows you to turn this "Visual Operations Doctrine" into a continuous production line, ensuring your visual assets grow as fast as your code base.
- Benchmarking Success: Compare your "Visual Trust" against competitors. If they are using Cinematic AI (Style 3) and you are using screen recordings, you are losing the perception war.
- The ROI of Safety: Quantify the value of error prevention. If a Clean UI Workflow (Style 8) video prevents one "fat finger" trade error, the video has paid for itself 100x over.
- Final Call to Innovation: Treat video as infrastructure, not content. In a world of invisible algorithms, your Visual Identity is the only thing your client actually sees. Make it count.
Companies using similar video content -
ICE Data Services – Analytics Platform – Showcases advanced data visualization for power users.
Tradeweb – Dealerweb – Presents sophisticated trading analytics in a dark mode interface.
Author & Editor Bio


