
Introduction: Visualizing the Future of Financial Resilience
The landscape of corporate finance is undergoing a silent but massive tectonic shift. We are moving away from the era of reactive "scorekeeping" and entering the age of the Strategic Treasury—a future where liquidity is visible, capital is fluid, and decisions are instantaneous. For leaders in the Debt Management and SaaS space, the opportunity is no longer just about building better software; it is about visualizing the bridge between complex legacy debt and the clarity of digital freedom.
The challenge, however, is substantial. Finance has historically been a domain of opacity, dominated by the "Physical/Digital Divide"—where modern aspirations collide with manual realities. The risk of the status quo is quantifiable and staggering. Research indicates that 94% of business spreadsheets used in decision-making contain errors, creating invisible fault lines in corporate balance sheets. This reliance on manual tools is not just risky; it is an operational drain, with manual data entry costing businesses an estimated $28,500 per employee annually.
This is where strategic video visualization becomes your most powerful Go-To-Market asset. By translating abstract financial algorithms into tangible, reassuring visual metaphors, you can bypass skepticism and speak directly to the aspirations of the modern CFO.
This guide presents 30 expert-curated visualization styles designed to dismantle operational anxiety and build immediate trust. From the reassuring solidity of photorealistic renders to the clarifying simplicity of flat vector motion, these examples are not just aesthetic choices—they are strategic tools engineered to reduce cognitive load and accelerate the adoption of your financial technology.
Let us explore how to visualize the transformation of debt into opportunity.
1. Abstract 2D flat vector organic modern motion graphics with glossy textures
TOFU | Brand Awareness

The Visual & Narrative Approach
This style utilizes "Abstract 2D Flat Vector Organic" shapes to tell a powerful transformation story. The visual creates a satisfying "Before and After" narrative within a single frame. It begins with a tangled, chaotic knot of "Vivid Coral" tubes—representing the stress and complexity of unmanaged debt structures. These tubes then flow smoothly to the right, morphing into perfectly parallel, organized lines in "Soft White." The motion is fluid and elastic, visualizing the concept of "unraveling complexity" without needing a single line of code or text.
Psychological Impact & KPI Focus
This metaphor addresses the psychological state of Overwhelm. Treasurers often feel trapped by "spaghetti code" processes and tangled intercompany loans. This visualization offers a cathartic release, promising Resolution and Order. It appeals to the human desire for symmetry and organization, subconsciously linking the software brand with the capability to streamline chaos. It effectively communicates "We straighten out your mess."
Strategic Implementation & Trade-offs
- Best Use Case: Social Media (LinkedIn/Instagram) and Brand Awareness spots. The visual is "scroll-stopping" because of its satisfying geometry.
- Duration: 10-15 Seconds (Loop).
- Strategic Trade-off: It is purely metaphorical. It creates a feeling of relief but does not explain how the disentanglement happens. It must be paired with copy that elaborates on the solution.
Companies using similar video content -
Kyriba – Liquidity Performance Platform – Untangling complex global debt structures.
Nomentia – Treasury & Cash Management – Organizing diverse financial flows smoothly.
Finastra – Fusion Treasury – Visualizing interconnected open finance systems.
2. Minimalist Flat 2D Vector
TOFU | Market Education

The Visual & Narrative Approach
This style employs a "Minimalist Flat 2D Vector" aesthetic to visualize the concept of verification. Rather than a literal ledger, the visual focuses on the outcome of digitization: Truth. We see a composition of sharp, geometric shards in Deep Indigo and Earth Tones assembling into a unified, solid "Checkmark" symbol. The use of negative space and hard edges conveys precision and binary certainty (Valid/Invalid), stripping away the "grey areas" of manual accounting.
Psychological Impact & KPI Focus
For a finance audience, ambiguity is a risk. This style leverages Cognitive Ease by presenting a clear, unmistakable symbol of success. It addresses the anxiety of "Hidden Errors" (referenced in our intro stats). By visualizing the chaotic shards coalescing into a perfect checkmark, the software positions itself as the ultimate arbiter of accuracy, directly appealing to the Treasurer's need for Compliance and Audit Readiness.
Strategic Implementation & Trade-offs
- Best Use Case: "How it Works" website sections or short explainer videos about automated reconciliation.
- Duration: 15-30 Seconds.
- Strategic Trade-off: While excellent for clarity, this style lacks "emotional weight." It communicates function efficiently but may struggle to convey value or prestige compared to 3D styles.
Companies using similar video content -
Trintech – Cadency – Validating automated reconciliation and financial close.
BlackLine – Financial Close & Reconciliation – Ensuring data integrity with clear, minimalist visuals.
AutoRek – Automation Platform – Streamlining reconciliation with precise data matching.
3. Bold Kinetic Typography (Visual)
TOFU | Vertical Social Organic

The Visual & Narrative Approach
Designed for the vertical scroll, this "Bold Kinetic Typography" style abandons traditional legibility for pure energy. The frame is densely packed with chunky, geometric blocks and 3D extruded letterforms in a high-contrast Stark Black and Electric Yellow palette. The composition features a rapid "crash zoom" effect with motion blur, creating a sensation of high velocity. The central shapes expand outward, symbolizing the explosion of liquidity and the rapid release of trapped capital.
Psychological Impact & KPI Focus
The psychology here is Momentum. In the debt management sector, speed is often synonymous with opportunity. This style triggers a "Fear of Missing Out" (FOMO) response but frames it positively as an abundance of activity. It aligns with KPIs related to Speed of Execution and Market Responsiveness. The aggressive color scheme suggests that the software is a powerful, industrial-grade tool for modern finance.
Strategic Implementation & Trade-offs
- Best Use Case: High-energy social teasers (TikTok, Shorts) intended to disrupt the scroll pattern of a younger demographic of finance professionals.
- Duration: 5-10 Seconds.
- Strategic Trade-off: This style prioritizes vibe over information. It is a "hook" mechanism, designed to grab attention before a more substantive message is delivered.
Companies using similar video content -
Trovata – Cash Management Platform – Accelerating cash visibility with dynamic text.
Modern Treasury – Payment Operations Software – Highlighting instant money movement and API speed.
Centime – Treasury Management – Showcasing accelerated financial insights for SMBs.
4. Abstract 2D Motion Graphics
TOFU | Skippable Pre-Roll Ad

The Visual & Narrative Approach
"Abstract 2D Motion Graphics" are used here to visualize the abstract concept of Cash Flow Stabilization. The visual features smooth, amorphous "blobs" in a calming palette of Pastel Purple, Mint Green, and Blue. These shapes interact like liquid mercury—colliding and then smoothing out into a perfect, calm surface. The 45-degree flow directs the eye forward, reinforcing the idea of progress and continuity.
Psychological Impact & KPI Focus
This style is designed to induce Calm. Financial volatility is inherently stressful; this visual acts as a "digital sedative," reassuring the viewer that the software brings tranquility to the chaos. It leverages the Halo Effect, implying that if the interface is this smooth, the backend operations must be equally frictionless. It effectively positions the software as a "stabilizing agent" in a chaotic market.
Strategic Implementation & Trade-offs
- Best Use Case: YouTube Pre-roll ads (first 5 seconds) where the goal is to mesmerize and hook the viewer visually without needing audio.
- Duration: 10-15 Seconds.
- Strategic Trade-off: The abstraction allows for broad interpretation. It is crucial to pair this visual with a clear headline (e.g., "Stabilize your cash flow") to ensure the metaphor is understood.
Companies using similar video content -
HighRadius – Treasury & Risk Suite – Stabilizing cash flow with fluid, amorphous shapes.
Atlar – Cash & Liquidity Control – Conveying seamless bank and ERP integration.
Tidely – Liquidity Management – Smoothing cash flow planning and reporting.
5. Wireframe to Reality Transition
TOFU | Product/Solution Differentiation

The Visual & Narrative Approach
This split-screen technique offers a "behind-the-scenes" versus "customer experience" narrative. The left side reveals the technical schematic—a green wireframe of a bank vault door—representing the rigorous code and structural logic. The right side unveils the "product"—a sleek, rendered silver and cyan shield icon. A "scanline" effect moves across the image, constantly updating the wireframe into the solid object.
Psychological Impact & KPI Focus
Trust is the currency of this industry. This style leverages Transparency to build credibility. By showing the "wireframe," you are proving to the skeptical CTO that the software isn't just a pretty interface; it has robust engineering underneath. It addresses the Security/Compliance anxiety directly. The contrast between the complex, technical wireframe and the simple, strong shield communicates that the software handles the complexity so the user enjoys the security.
Strategic Implementation & Trade-offs
- Best Use Case: LinkedIn Ads targeting CTOs and Risk Officers. It is ideal for "Feature Deep Dives" regarding encryption standards.
- Duration: 15-20 Seconds.
- Strategic Trade-off: It can feel "technical" or "cold." It appeals more to the logical/rational brain (System 2 thinking) than the emotional brain.
Companies using similar video content -
FIS – Treasury and Risk Manager – Revealing robust architecture transitioning to secure interface.
SAP – Treasury and Risk Management – Modernizing ERP integration into user-friendly solutions.
Hazeltree – Treasury Solutions – Showing engineering behind transparent liquidity and risk.
6. Abstract 3D AI Visualization
TOFU | Shaping Brand Perception
The Visual & Narrative Approach
This style visualizes the invisible network of global finance. It features a constellation of glowing nodes and connecting lines in "Bioluminescent Blue" and "Deep Navy." The nodes, representing global currencies and debt instruments, are interconnected in a complex but organized web. The rendering utilizes a macro depth of field, blurring the background into a dark data void, suggesting a focus on specific, actionable insights within a vast sea of data.
Psychological Impact & KPI Focus
The aesthetic is unapologetically Futuristic. It positions the platform as an "AI-First" solution, appealing to the aspiration of Modernization. For a Treasurer managing cross-border debt, this visual confirms that the system is capable of handling global complexity. It impacts the Perceived Value of the software, making it look like a high-end enterprise solution rather than a basic bookkeeping tool.
Strategic Implementation & Trade-offs
- Best Use Case: Website Hero Sections (Headers). It creates an immediate impression of sophistication the moment a user lands on the page.
- Duration: 10-20 Seconds (Loop).
- Strategic Trade-off: It is a common trope in tech. To avoid looking "generic," the visualization must be high-quality and high-resolution.
Companies using similar video content -
ION Treasury – Wallstreet Suite – Mapping global financial instrument connectivity.
Intellect Design Arena – eMACH.ai Treasury – Depicting AI-driven global banking networks.
3V Finance – titanTreasury™ – Visualizing interconnected risk management and compliance.
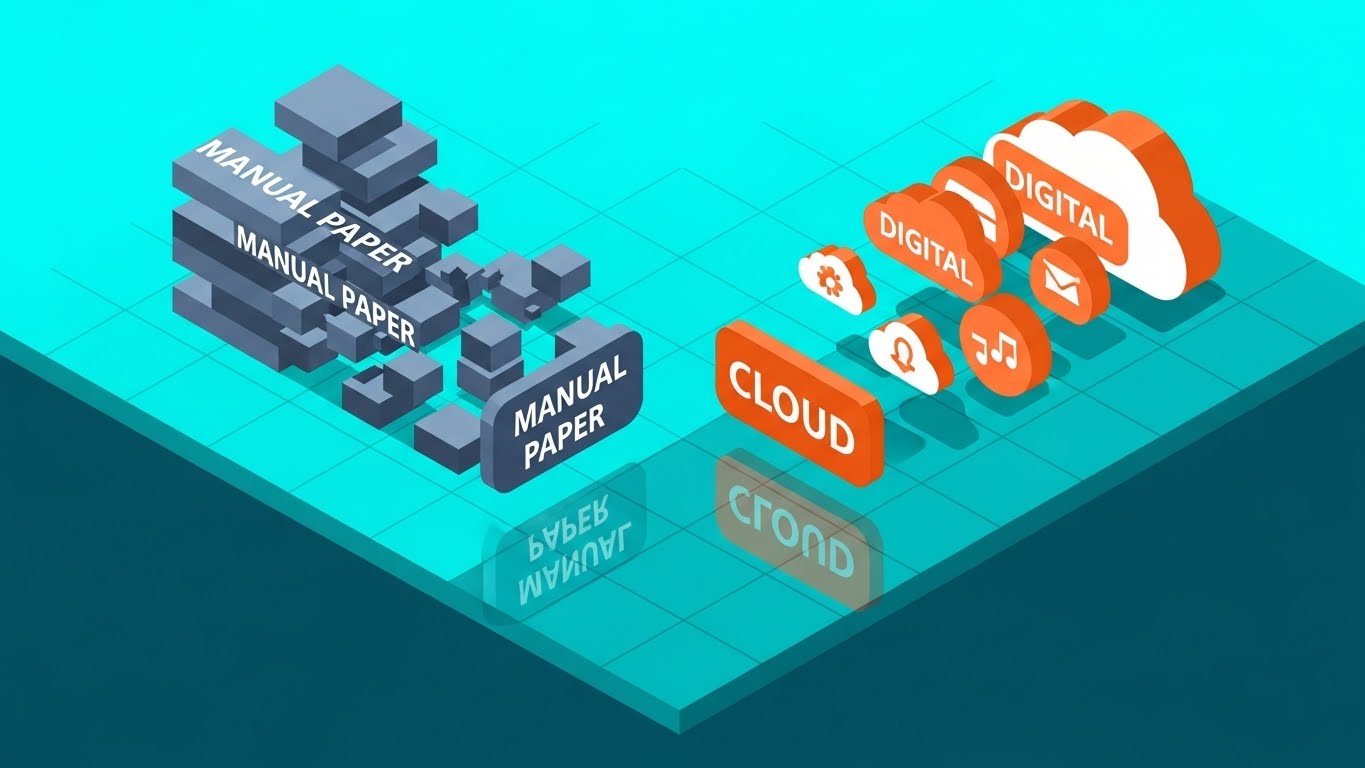
7. Isometric 2D Motion Design
TOFU | Category Creation
The Visual & Narrative Approach
The isometric perspective (30-degree angle) provides a "God's Eye View" of a system. This visual juxtaposes the "Old World" vs. the "New World." On the left, stacks of abstract "Manual Paper" blocks in Slate Grey are shrinking. On the right, "Digital Cloud" icons in Burnt Orange are expanding. The clean grid floor provides a sense of mathematical order. The narrative is strictly Transformational: moving from physical burden to digital lightness.
Psychological Impact & KPI Focus
This style reduces Operational Anxiety. It visualizes the messy reality of manual finance (paper stacks) and offers a tidy, organized alternative. It appeals to the Operations Manager's desire for Efficiency. The clear separation between the grey (dull, heavy) and the orange (bright, active) utilizes Color Psychology to subconsciously favor the digital solution.
Strategic Implementation & Trade-offs
- Best Use Case: Whitepapers, Blog headers, and "About Us" pages. It works well for static illustrations that accompany dense text.
- Duration: 30-45 Seconds.
- Strategic Trade-off: It can appear "playful." It may not carry the gravitas required for a strictly corporate banking presentation but is excellent for SaaS marketing where "ease of use" is the primary selling point.
Companies using similar video content -
Coupa – Treasury & Cash Management – Optimizing spend management to streamlined treasury.
Serrala – Treasury Solutions – Migrating manual SAP processes to automated cloud treasury.
Kuhlekt – Accounts Receivable – Organizing the flow from order to cash.
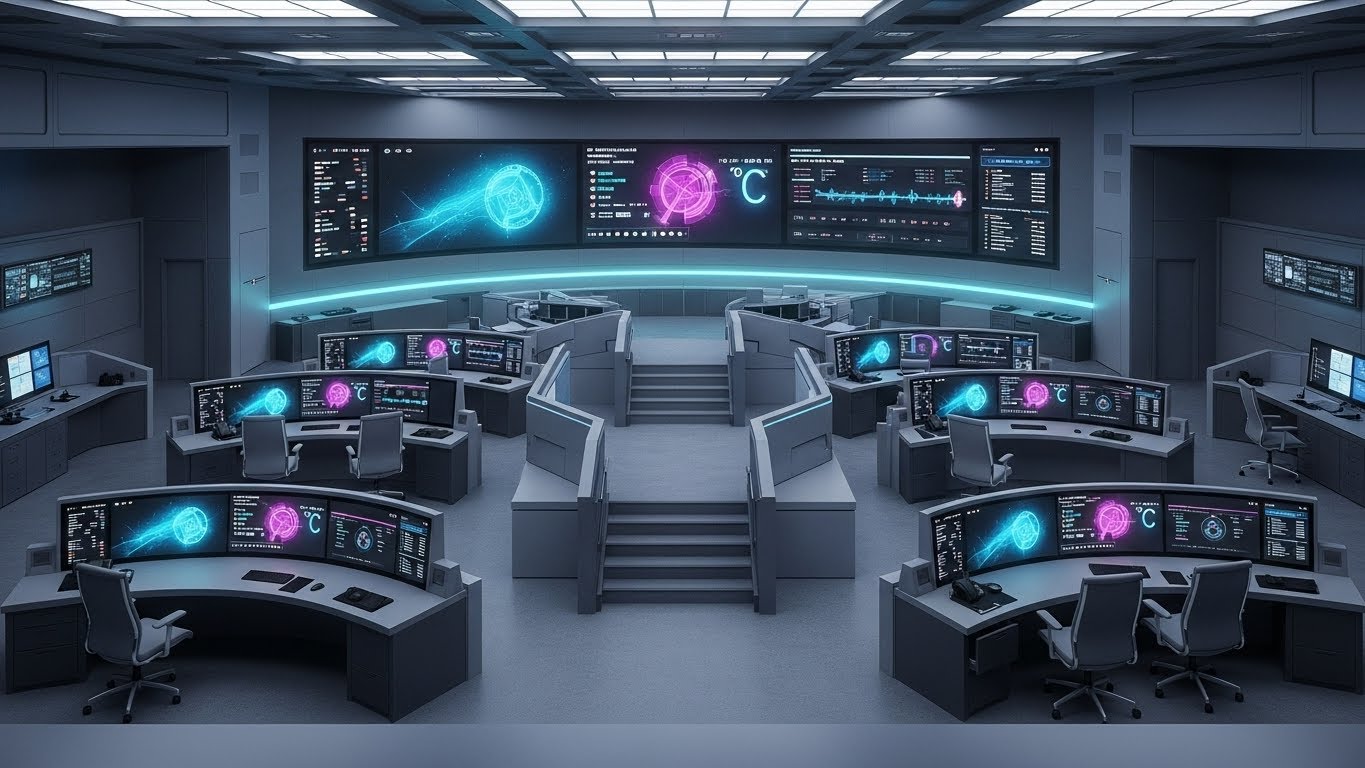
8. Photorealistic 3D Renders
MOFU | ABM Awareness

The Visual & Narrative Approach
This visualization moves into hyper-realism to depict a sophisticated "Command Center" environment. Instead of a single desk, we see a panoramic array of high-definition screens displaying complex financial charts and heat maps in a cool, sleek architectural setting. The lighting is cinematic, highlighting the screens as the source of illumination. The narrative is Total Control. It frames the software as the mission control for the enterprise.
Psychological Impact & KPI Focus
The psychological trigger here is Authority. It simulates the environment of a high-frequency trading floor or a security operations center (SOC), elevating the role of the Treasurer to that of a strategic commander. It appeals to the ego and the aspiration for Visibility. It suggests that the software can handle the volume and velocity of enterprise-grade data.
Strategic Implementation & Trade-offs
- Best Use Case: Account Based Marketing (ABM) campaigns targeting Enterprise-level clients. It signals "We are big enough to handle your scale."
- Duration: Static or Cinemagraph (5-10 Seconds).
- Strategic Trade-off: High production cost. Creating photorealistic 3D environments requires significant design expertise to avoid looking like a video game.
Companies using similar video content -
GTreasury – TMS – Projecting global oversight from a command center.
Oracle – Cash and Treasury Management – Depicting a modern financial control room.
Profile Software – Acumen.plus – Rendering comprehensive financial services platform.
9. Split Screen: Optimized Reality and UI
MOFU | Building Trust & Credibility
The Visual & Narrative Approach
This composition bridges the gap between the human user and the digital tool. The left half features a high-quality photo of a professional female executive (Persona: The Confident Treasurer) making direct eye contact. The right half displays a crisp, vector-based icon of a shield with a checkmark and analytics charts. The vertical divider connects the two worlds. The narrative is Empowerment: the human is supported by the system, not replaced by it.
Psychological Impact & KPI Focus
This style builds Relatability and Trust. Pure abstract tech can feel alienating; seeing a confident human face triggers mirror neurons. The UI element reinforces the reason for her confidence: she has the right tools. It targets the User Experience (UX) aspect of the sale, suggesting that the software is a "force multiplier" for the finance team.
Strategic Implementation & Trade-offs
- Best Use Case: Email Marketing and Case Studies. "See how [Name] improved efficiency by X%."
- Duration: Static or subtle Parallax.
- Strategic Trade-off: It relies heavily on the quality of the stock photo. Generic photos can degrade the brand; custom photography is the "Gold Standard" here.
Companies using similar video content -
Centime – Treasury Management – Empowering executives with human-software collaboration.
Quantios – Trust & Corporate Services SaaS – Highlighting efficiency and risk reduction.
Fyorin – Financial Operations Platform – Streamlining cross-border payments with UI overlay.
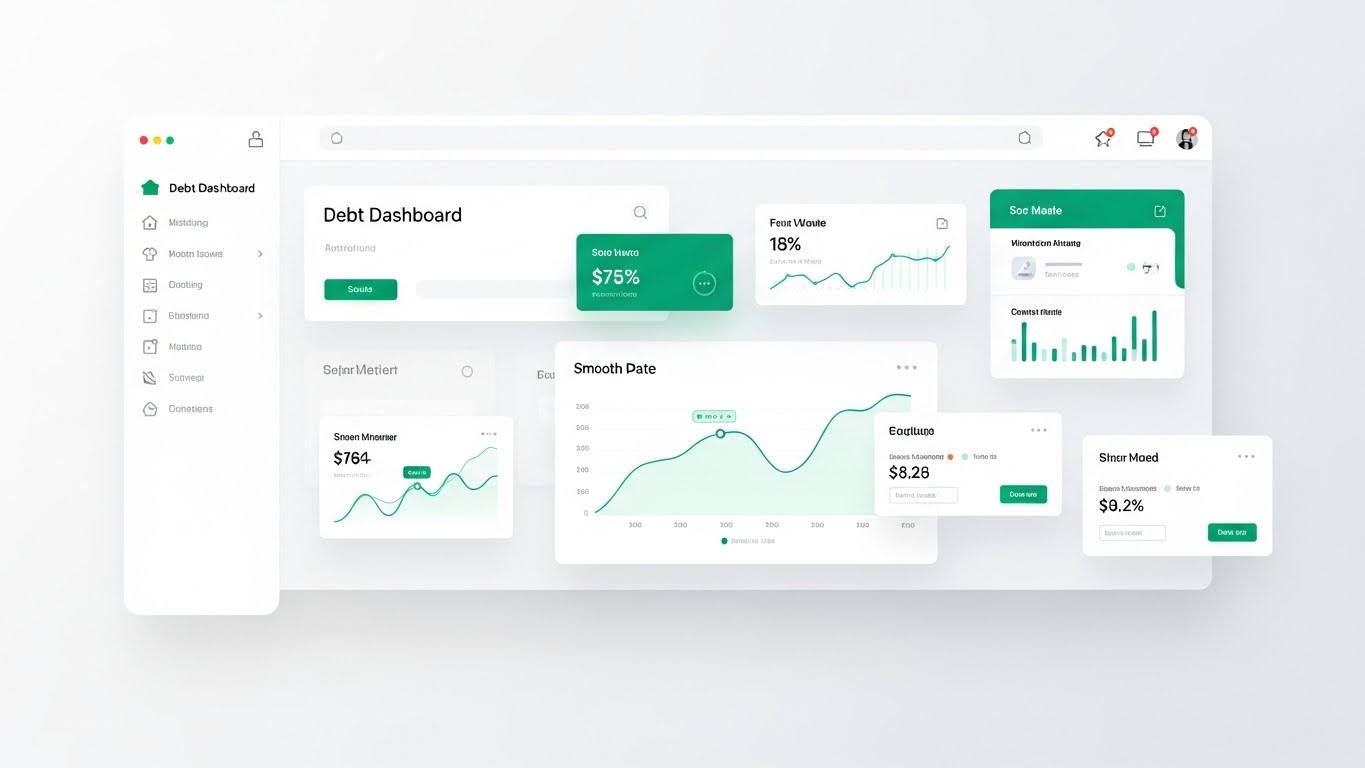
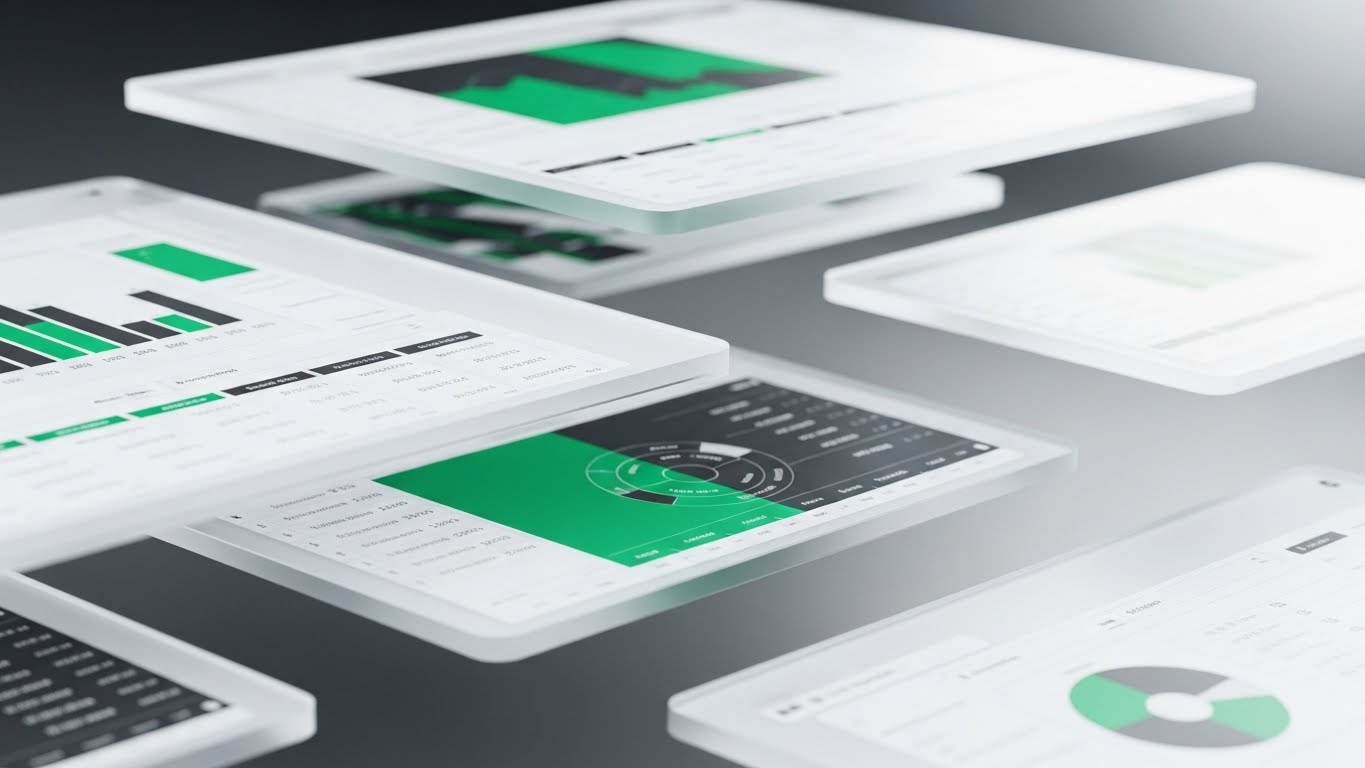
10. Clean UI Workflow (Light Mode)
MOFU | Feature Education & Demonstration

The Visual & Narrative Approach
This is the most literal representation of the product. It showcases a pristine, "Light Mode" user interface with a heavy emphasis on white space and Emerald Green accents. The dashboard features floating cards with soft drop shadows, displaying trend lines and debt summaries. The layout is balanced and airy. The narrative is Simplicity. It promises that despite the complexity of debt management, the daily experience of using the tool will be clean and stress-free.
Psychological Impact & KPI Focus
The dominant white and green palette signals Financial Health. Green is the universal color of "Profit" and "Go." The use of "Light Mode" aligns with Productivity. It reduces the fear of "Excel Hell"—the dread of dense, grey grids. By visualizing a UI that looks like a modern consumer app, it lowers the Barrier to Entry, suggesting a low learning curve.
Strategic Implementation & Trade-offs
- Best Use Case: Product Pages and Demo Videos. This is the "Evidence" layer of the funnel.
- Duration: 30-60 Seconds.
- Strategic Trade-off: It must be accurate. You cannot show a UI that is significantly better than the actual product, or you risk "Expectation Gap" churn.
Companies using similar video content -
FloQast – Accounting Transformation Platform – Showcasing automated reconciliation and close.
Aico – Financial Close Software – Demonstrating streamlined financial close processes.
QuickBooks – Accounting Software – Providing user-friendly small business accounting.
11. 2D Line Art Animation
MOFU | Competitive Displacement

The Visual & Narrative Approach
This style embraces extreme minimalism to visualize the "switch" from a competitor. Against a bold "Solid Neon Pink" background—chosen to disrupt the conservative blue/grey palette of traditional finance—a single "Charcoal Grey" line tells the story. The animation begins on the left with a frantic, scribbled knot, representing the messy, "spaghetti code" reality of legacy systems or spreadsheet dependency. As the line flows to the right, it untangles itself, smoothing out into a perfectly straight, horizontal vector. The motion is continuous and mono-weight, symbolizing a seamless, unbroken journey to clarity.
Psychological Impact & KPI Focus
This metaphor addresses Cognitive Friction. Prospects often delay switching vendors because they fear the migration will be messy. This visual validates their current pain (the knot) and promises an immediate release of tension (the straight line). It targets the Cost of Complexity bias. By simplifying the visual input to just two elements (pink and grey), it subconsciously reinforces the message that your platform is the "Occam’s Razor" of debt management—the simplest, most effective solution. This directly supports Time-to-Value and Churn Reduction narratives.
Strategic Implementation & Trade-offs
- Best Use Case: Social Media Carousels (LinkedIn) and "Us vs. Them" comparison slides. The high contrast stops the scroll.
- Duration: 5-10 Seconds (Loop).
- Strategic Trade-off: Its simplicity is its strength and weakness. It is a powerful hook but offers no data density. It must be paired with specific copy (e.g., "Untangle your Intercompany Loans") to anchor the metaphor.
Companies using similar video content -
Trintech – Adra – Untangling messy manual processes into clear workflows.
Multiview ERP – Financial ERP – Streamlining month-end close with simple animation.
Chaser – Accounts Receivable Automation – Visualizing untangling overdue invoice processes.
12. 2D Animation & UI Composition
MOFU | Overcoming Objections

The Visual & Narrative Approach
To counter the objection that enterprise software is "clunky" or "hard to learn," this style adopts a friendly "Cel-Shaded" aesthetic. A geometric, non-realistic character in "Sky Blue" and "Sand Beige" interacts confidently with a floating, simplified UI panel. The narrative focuses on ease of action: the character points to a "Red Block" (representing a covenant breach or error), which instantly transforms into a "Green Block" (resolved). The composition is open and inviting, utilizing soft shapes to make the complex debt management process appear approachable.
Psychological Impact & KPI Focus
The primary goal here is to lower the Barrier to Entry. CTOs and Treasurers often worry about "Implementation Drag"—the fear that their team won't adopt the new tool. By using a friendly, abstract character, we trigger Social Proof and the Warmth-Competence effect. It signals that the software is designed for humans, not just mainframes, directly addressing User Adoption Rates and reducing the perceived need for extensive training.
Strategic Implementation & Trade-offs
- Best Use Case: YouTube Explainer videos, Help Center intros, and "Onboarding Preview" content.
- Duration: 30-60 Seconds.
- Strategic Trade-off: The "cartoon" style can risk appearing less "enterprise-grade." It is crucial to ensure the UI elements within the animation remain accurate to the product's logic to maintain professional credibility.
Companies using similar video content -
Kolleno – Accounts Receivable Platform – Humanizing debt collection automation.
Upflow – AR Management – Simplifying accounts receivable management.
13. Rapid UI Feature Montage
MOFU | Website Visitor Re-engagement
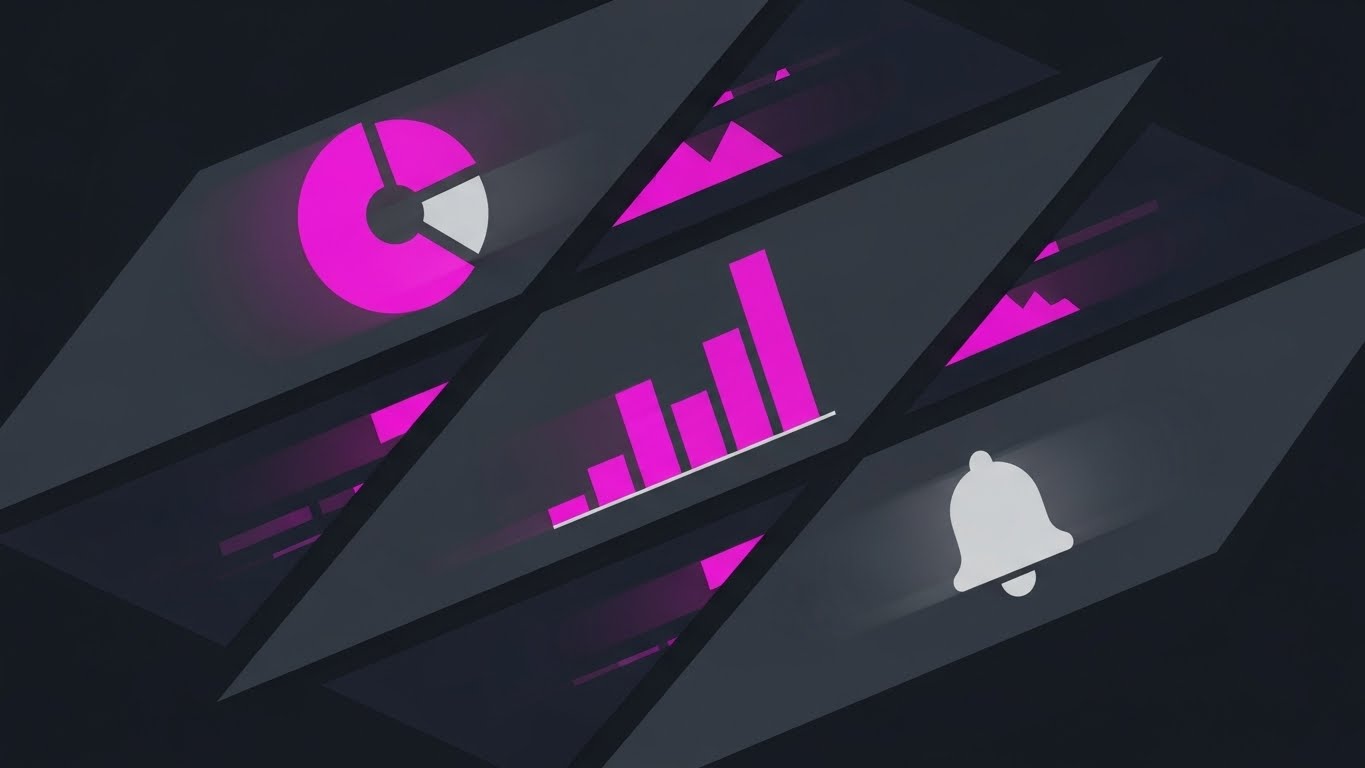
The Visual & Narrative Approach
Designed for speed, this style abandons linear storytelling for pure visual velocity. The frame is sliced diagonally, creating dynamic windows into the software’s capabilities. We see flashes of abstract "Vibrant Magenta" and "Dark Grey" UI elements: a pie chart analyzing allocation, a bar graph tracking trends, and a notification bell signaling alerts. Motion blur is applied to the edges of the slices to simulate high speed, while the center data points remain sharp. The narrative is Urgency: "We move as fast as the market."
Psychological Impact & KPI Focus
This style exploits the Availability Heuristic. By flashing multiple features in quick succession, you create an impression of Robustness and Comprehensiveness. For a retargeting audience that has already visited your site, this serves as a rapid-fire reminder of the value they missed. It drives Click-Through Rates (CTR) by signaling that the platform is a complete toolkit, not a point solution, re-igniting the Evaluation phase.
Strategic Implementation & Trade-offs
- Best Use Case: Remarketing Ads (Google Display Network, LinkedIn Sponsored Content) targeting users who bounced from the pricing page.
- Duration: 6-8 Seconds (Fast Cuts).
- Strategic Trade-off: It is overwhelming by design. It creates an impression of capability but does not teach the user how to use the features. It is purely a recall mechanism.
Companies using similar video content -
HighRadius – Accounts Receivables – Showcasing various AR automation features rapidly.
Gaviti – Accounts Receivable Management – Highlighting automated dunning and payment tracking.
14. Dynamic Data Visualization
MOFU | ROI Justification Hook

The Visual & Narrative Approach
Here, the data itself becomes the hero. We abandon the dashboard for a cinematic, low-angle view of 3D extruded bar charts towering upwards like skyscrapers. The "Electric Lime" bars gleam against a "Matte Black" void, emphasizing growth and profit. The perspective is key: looking up at the charts makes the numbers feel monumental. The narrative is purely about Scale and Upward Trajectory, symbolizing the financial gains accessible through optimized debt management.
Psychological Impact & KPI Focus
This style targets the Gain Motivation of the Economic Buyer. It visualizes ROI (Return on Investment) not as a flat number, but as a physical structure that dominates the screen. It appeals to the CFO's desire for Capital Efficiency. The solid, glossy texture of the bars implies that the gains are tangible and secure, not theoretical. It validates the software cost by visually dwarfing it with the projected returns.
Strategic Implementation & Trade-offs
- Best Use Case: LinkedIn Feed (Organic or Paid) and Slide Decks for the "Financial Impact" section of a proposal.
- Duration: 10-15 Seconds.
- Strategic Trade-off: It is abstract. Without specific labels (e.g., "$ saved" or "% yield"), it remains a general symbol of growth. It works best when overlaid with a specific, hard-hitting statistic.
Companies using similar video content -
Tesorio – Cash Flow Performance Platform – Illustrating ROI from improved cash flow.
Growfin – B2B Finance Platform – Showcasing reduced DSO and increased cash recovery.
15. Isometric 3D Workflow
BOFU | ROI Justification

The Visual & Narrative Approach
Transitioning to the Bottom of the Funnel, we use this "Clay-style" render to offer a soft, holistic view of the finance department. The isometric angle reveals a floorplan of connected desks and server blocks in "Teal," "Grey," and "Terracotta." Grey pipes physically connect the workstations, visualizing the flow of data between the Treasury, Accounting, and Audit teams. The lighting is soft and global. The narrative is Interconnectivity: showing how the software unites siloed teams into a single, functioning organism.
Psychological Impact & KPI Focus
This appeals to the Operations Manager's need for Order and Collaboration. It visualizes the removal of "Data Silos." The soft, clay-like texture reduces the perceived rigidity of corporate finance, suggesting a workflow that is flexible and organic. It supports KPIs related to Operational Efficiency and Headcount Optimization, visually proving that the software bridges the gap between different stakeholders.
Strategic Implementation & Trade-offs
- Best Use Case: Sales Decks (The "Before vs. After" slide) and detailed "How it Works" pages.
- Duration: 20-40 Seconds.
- Strategic Trade-off: The detail level requires viewing on a larger screen (Desktop/Tablet). It may lose impact on a small mobile screen where the "pipes" become hard to see.
Companies using similar video content -
TIS – Treasury Intelligence Solutions – Orchestrating data flow between treasury, banks, ERPs.
Financial Navigator by A352 – Integrated Financial Data Management – Unifying financial planning across departments.
16. Lifestyle Stock with UI Overlay
BOFU | The Economic Buyer

The Visual & Narrative Approach
This style places the viewer in the shoes of the decision-maker. We see an over-the-shoulder POV of a silver-haired executive (The CFO Persona) holding a glass tablet. The background is a blurred, high-end corporate office with city views. Overlaid on the tablet are glowing "Cyan" holographic charts floating in the air. The narrative is Visionary Leadership. It doesn't show the grunt work of data entry; it shows the result: high-level strategic analysis used to make billion-dollar decisions.
Psychological Impact & KPI Focus
This visual targets Ego and Status. It reflects the Economic Buyer's self-image as a strategic leader, not a back-office administrator. By using a "glass tablet" (future tech), it implies that choosing this software is a forward-thinking move. It reinforces the value of Strategic Oversight and Executive Reporting, validating the software as a C-Suite asset that justifies a premium budget.
Strategic Implementation & Trade-offs
- Best Use Case: LinkedIn Ads targeting C-Level Job Titles and personalized Account Based Marketing (ABM) landing pages.
- Duration: Static Image or subtle Cinemagraph (blinking city lights).
- Strategic Trade-off: It feels "staged." It works for aspiration but fails if the actual product UI is clunky. It sets a very high bar for the expected user experience.
Companies using similar video content -
Kyriba – Liquidity Performance Platform – Empowering CFOs with strategic liquidity insights.
Brex – Financial Platform – Enabling executive strategic decisions with financial health UI.
17. 3D X-Ray Visualization
BOFU | Risk Mitigation

The Visual & Narrative Approach
To visualize security, we must look inside. This style uses an "X-Ray" aesthetic to reveal the internal architecture of a data vault. The outer shell is a translucent "Electric Blue," protecting a glowing white core (the asset). A red node, representing a specific financial risk or cyber threat, is shown being isolated and neutralized by a protective ring. The look is clinical, precise, and high-tech, utilizing glass refraction and glowing edges.
Psychological Impact & KPI Focus
This directly addresses the Fear of Breach and Compliance Failure. Security is often an invisible feature; this style makes it visible and active. By showing the mechanism of protection (the ring neutralizing the red sphere), it builds confidence in the system's Robustness. It appeals to the Risk Officer's need for Containment and Control, supporting KPIs regarding Data Sovereignty and Fraud Prevention.
Strategic Implementation & Trade-offs
- Best Use Case: The "Security & Compliance" page of the website and technical whitepapers.
- Duration: 15-20 Seconds.
- Strategic Trade-off: It is cold and mechanical. It creates distance rather than emotional connection, which is appropriate for security discussions but not for relationship building.
Companies using similar video content -
C&R Software – Debt Manager – Neutralizing hidden debt-related risks internally.
Pega Collections – Debt Collection Software – Revealing internal mechanisms for secure debt recovery.
18. Futuristic Neon/Dark Mode
BOFU | The Technical Buyer

The Visual & Narrative Approach
This style speaks the language of the IT buyer: speed, throughput, and modern architecture. Set in a "Dark Mode" environment, the visual features streams of "Matrix Green" and "Cyan" light moving rapidly along digital highways. While the metaphor evokes the movement of payloads—like packets of data on a fiber optic network—the aesthetic is purely cyber-dynamic. The "Dutch angle" (tilt) adds a sense of aggressive momentum. The narrative focuses on Throughput and Latency, visualizing the system's ability to handle massive transaction volumes without lag.
Psychological Impact & KPI Focus
For the CIO, the primary anxieties are Downtime and Latency. This visual proves that the platform is built on a modern stack (API-first). It visualizes Connectivity and Real-Time Data Flow, distinguishing the solution from sluggish, legacy on-premise systems. It confirms that the software is "Enterprise Ready" and scalable.
Strategic Implementation & Trade-offs
- Best Use Case: API Documentation portals, Developer Docs, and Technical Specification sheets.
- Duration: 10-30 Seconds (Looping background).
- Strategic Trade-off: It creates a "Cyber" vibe that may feel alien to a traditional Accountant. It must be framed strictly as a visualization of data velocity to avoid looking unprofessional.
Companies using similar video content -
Modern Treasury – Payment Operations Software – Validating infrastructure speed with neon data streams.
Intellect Design Arena – eMACH.ai Treasury – Showcasing rapid data flow in banking.
19. 2D Graphics Over Live Action
BOFU | Sales Cycle Acceleration

The Visual & Narrative Approach
This style combines the real world with the digital result. We see a high-quality photo of a hand signing a contract. The moment the pen touches the paper, animated 2D "Sparks" and "Checkmarks" in "Warm Beige" and "Forest Green" explode from the contact point. This Mixed Reality technique visualizes the consequence of the signature: it's not just ink on paper; it's the activation of success. The narrative is Immediate Action.
Psychological Impact & KPI Focus
This is a Closing tool. It associates the act of buying (signing) with a dopamine hit of positive reinforcement. It reframes the contract from a "legal burden" to a "start line" for success. It targets the Anticipation of Relief, suggesting that as soon as the deal is done, the improvements begin. It supports Sales Cycle Velocity by subliminally rewarding the decision to close.
Strategic Implementation & Trade-offs
- Best Use Case: The final email in a sales sequence ("Ready to get started?") or the proposal cover page.
- Duration: Static image or short GIF (3 seconds).
- Strategic Trade-off: It relies on the "stock photo" base. If the hand/suit looks dated or cheap, the effect fails. The animation must be crisp and high-frame-rate to look premium.
Companies using similar video content -
Billtrust – Collections Platform – Triggering immediate payment automation value.
Versapay – Collaborative AR Platform – Activating collaboration and payment processing.
20. 3D Parallax UI Presentation
BOFU | Driving Demo Requests
The Visual & Narrative Approach
To showcase the depth of the platform, we use a 3D Parallax effect. Multiple semi-transparent UI screens float in a layered stack, rendered in "Emerald Green," "Obsidian Black," and "White." The camera moves sideways, creating a parallax shift where the top screens move faster than the bottom ones. This reveals that the software isn't just a surface-level tool; it has deep, interconnected layers of functionality. The focus shifts from the front dashboard to the back analytics, suggesting a rich user experience.
Psychological Impact & KPI Focus
This visualizes Substance. It tells the prospect that there is "more to explore," directly driving the desire for a Demo. It combats the fear of "Vaporware" (software that looks good but does nothing). The depth cue implies a robust, mature product architecture. It appeals to the Analytical buyer who wants to peel back the layers and see the details, increasing the Conversion Rate from visitor to lead.
Strategic Implementation & Trade-offs
- Best Use Case: Landing Page Hero sections (specifically the "Request Demo" page).
- Duration: 10-15 Seconds (Loop).
- Strategic Trade-off: It obscures the actual data. It sells the complexity and richness of the UI, but you cannot read the specific numbers. It is a "teaser," not a "reader."
Companies using similar video content -
HighRadius – Treasury & Risk Suite – Demonstrating comprehensive control with layered UI.
OneStream – Financial Consolidation Platform – Revealing deep financial reporting and analysis.
21. Low-Poly 3D Modeling
Onboarding | Reducing Implementation Friction

The Visual & Narrative Approach
Implementation is the highest hurdle in SaaS adoption; clients fear a long, painful integration. This style combats that fear using "Low-Poly 3D Modeling" with Primary Colors (Blue, Red, Yellow). The visual shows a "server block" self-assembling from falling geometric triangles and cubes. The geometry is simple, friendly, and modular. The narrative is Self-Assembly. It suggests that setting up the software isn't a heavy engineering lift—it’s as easy as snapping building blocks together.
Psychological Impact & KPI Focus
This style leverages Gamification psychology. By presenting the setup process as a toy-like construction, it lowers the Perceived Effort. It addresses the anxiety of "Technical Debt" and complex integrations. For the implementation team, this visual reinforces the idea of a "Plug-and-Play" architecture, directly supporting Time-to-Live and Onboarding Completion Rate KPIs.
Strategic Implementation & Trade-offs
- Best Use Case: "Getting Started" guides, Setup Wizards, and Welcome Emails.
- Duration: 10-20 Seconds (Loop).
- Strategic Trade-off: It is stylized and playful. It works perfectly for process visualization (showing how things fit) but should not be used to represent detailed financial data, as the "low-poly" look lacks precision.
Companies using similar video content -
DOKKA – Financial Close Automation – Simplifying implementation with modular self-assembly.
Solvexia – Spreadsheet Automation – Visualizing simplified data integration with building blocks.
22. 2D Character-Driven Story
Onboarding | Self-Serve Onboarding

The Visual & Narrative Approach
To support self-serve users, we strip away the corporate veneer and use a warm, "2D Vector Illustration" style with textured noise. We see a relatable character (e.g., a Junior Analyst) with a messy bun and glasses, sitting at a stylized home office desk. The palette uses soft "Pastel Blue" and "Peach." She smiles at a monitor displaying a simple "Welcome" shape, reacting positively to the software. The narrative is Accessibility: "If she can do it from home, so can you."
Psychological Impact & KPI Focus
This triggers Empathy and Social Proof. The "Home Office" setting acknowledges the reality of modern hybrid finance teams. It reduces Operational Anxiety by showing a relaxed, happy user, contrasting with the stressed stereotype of a debt manager. It drives User Activation by making the software feel like a helpful colleague rather than a demanding tool.
Strategic Implementation & Trade-offs
- Best Use Case: In-App "Welcome" modals and "First Login" walkthrough videos.
- Duration: 30-60 Seconds.
- Strategic Trade-off: The "Casual" aesthetic might seem too informal for strict banking clients. It is best used for the users (Analysts/Managers) rather than the buyers (CFOs).
Companies using similar video content -
FloQast – Accounting Transformation Platform – Humanizing the learning curve for accountants.
Xero – Cloud Accounting Software – Guiding users through easy accounting processes.
23. Hyper-lapse Stock Footage with Data
Onboarding | Accelerating Time-to-Value
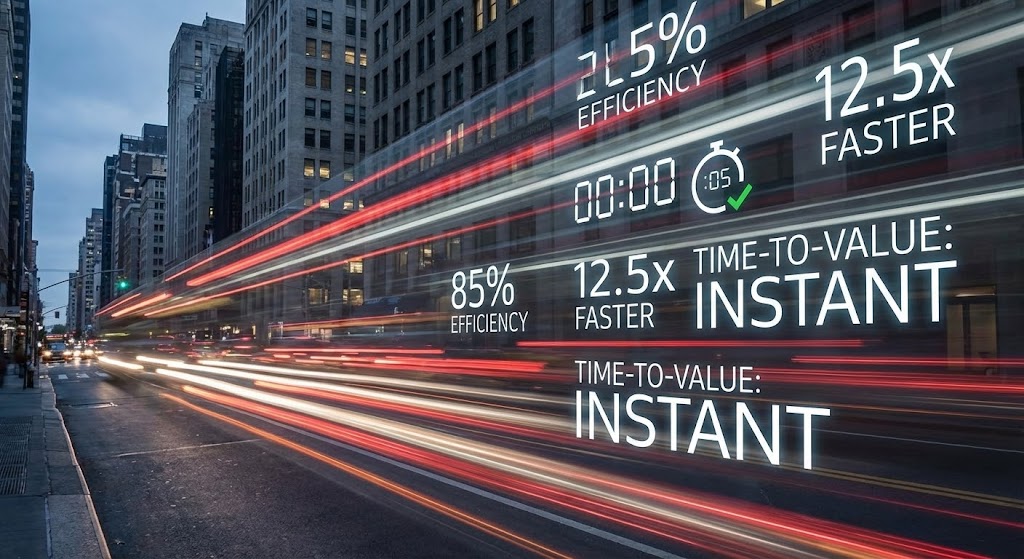
The Visual & Narrative Approach
This style contrasts the chaotic speed of the real world with the static clarity of data. We use a "Hyper-lapse" of a busy city street at dusk, with light trails from cars streaking in "Traffic Light Red" and "Urban Grey." Superimposed over this motion is a sharp, static "Bright White" data overlay showing "Time-to-Value: INSTANT" and efficiency percentages. The background moves fast; the data stands firm. The narrative is Anchoring: In a fast-moving market, your data remains the stable source of truth.
Psychological Impact & KPI Focus
The visual creates a sense of Urgency and Modernity. It appeals to the "Hustle" culture of high-growth firms. By showing the data overlay as stable amidst the blur, it subconsciously communicates Reliability. It supports the Time-to-Value metric, promising that the software delivers actionable insights the moment it is deployed, keeping pace with the market.
Strategic Implementation & Trade-offs
- Best Use Case: Social Stories (Instagram/LinkedIn) and "Success Milestone" emails (e.g., "You've saved 10 hours this week!").
- Duration: 6-10 Seconds (Loop).
- Strategic Trade-off: The text must be large and legible. The busy background can compete with the data if the contrast isn't pushed to the extreme.
Companies using similar video content -
Trovata – Cash Management Platform – Visualizing instant impact with urban velocity data.
re:cap – Liquidity Management – Highlighting rapid time-to-value for liquidity.
24. Macro UI Micro-Interactions
Retention | Knowledge Base & FAQ Videos

The Visual & Narrative Approach
When teaching features, clarity is king. This style uses an extreme close-up (Macro) of a single UI element—a "Sapphire Blue" action button with a brushed metal texture. We see a digital "ripple effect" radiate from the center upon a click. The background is blurred (bokeh), forcing the eye to focus solely on the interaction. The narrative is Precision Control. It glorifies the small moments of interaction, making the tool feel premium and responsive.
Psychological Impact & KPI Focus
This leverages the Quality Cue. High-fidelity micro-interactions signal that the software is well-engineered. It reduces Cognitive Load during training by removing all peripheral distractions, focusing the learner on exactly what to click. This directly impacts Support Ticket Reduction and Feature Adoption, as users feel confident in the specific mechanics of the interface.
Strategic Implementation & Trade-offs
- Best Use Case: Help Center articles (GIFs) and "New Feature" tooltips.
- Duration: 3-5 Seconds.
- Strategic Trade-off: It lacks context. You cannot see where on the dashboard this button is. It must be used in conjunction with a wider shot or text instructions.
Companies using similar video content -
Trintech – Cadency – Reinforcing system responsiveness with tactile precision.
Aico – Financial Close Software – Highlighting UI element precision and responsiveness.
25. Dark Mode UI Showcase
Retention | Reducing Support Overhead
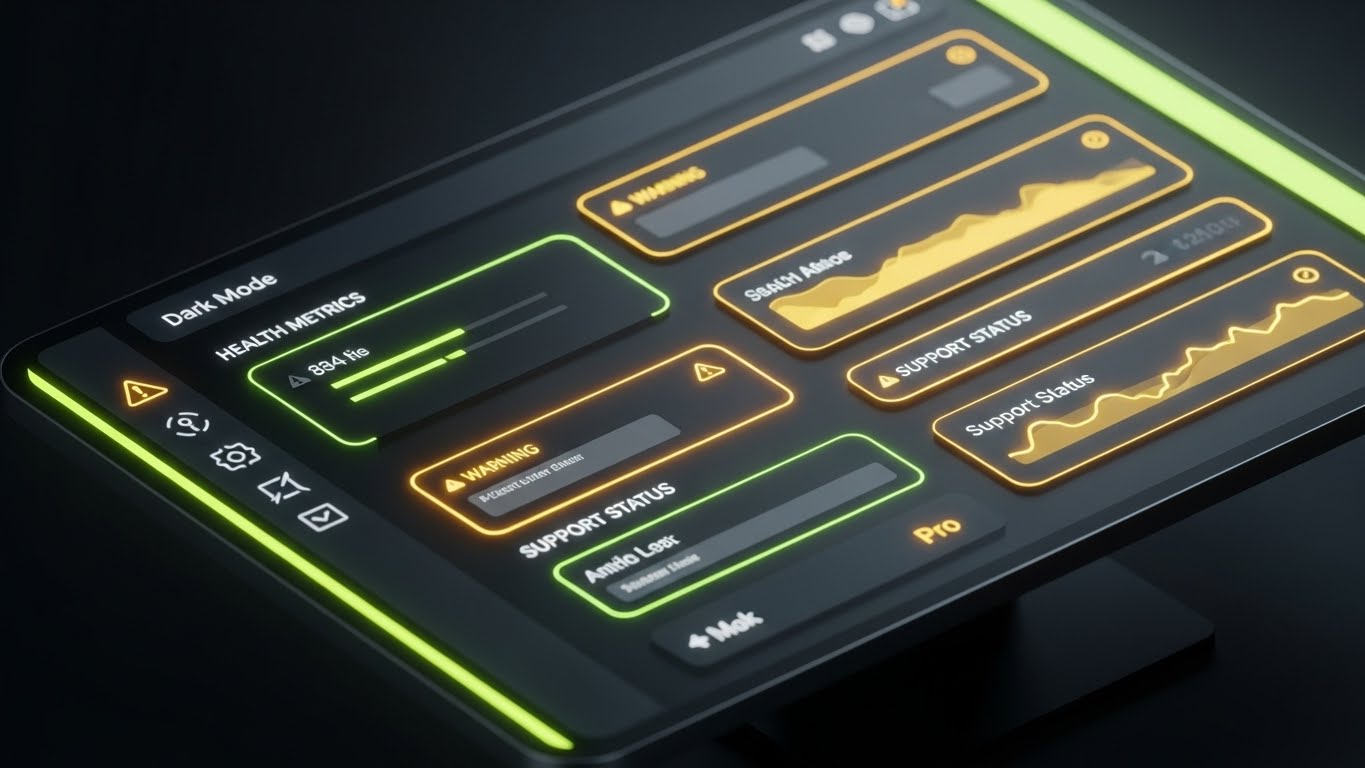
The Visual & Narrative Approach
"Dark Mode" is the preferred environment for power users. This style showcases a "Dark Slate" dashboard with glowing "Amber Warning" and "Neon Green" indicators. The framing includes the dark bezel of a monitor, grounding it in reality. The specific screen shows "Health Metrics" and "Support Status." The narrative is Vigilance. It mimics the look of a developer’s IDE or a trading terminal, framing the user as a "Pro" who monitors their own system health.
Psychological Impact & KPI Focus
The dark aesthetic reduces eye strain and implies Seriousness. The glowing amber alerts draw immediate attention to issues (e.g., a covenant breach risk), encouraging Proactive Resolution before contacting support. This visual style conditions the user to rely on the dashboard for answers, driving down Support Costs and increasing User Autonomy.
Strategic Implementation & Trade-offs
- Best Use Case: In-App Dashboards, "System Status" pages, and technical update newsletters.
- Duration: Static or subtle pulse animation.
- Strategic Trade-off: Dark mode can feel "technical." Ensure the typography is high-contrast to maintain legibility for users who prefer standard light interfaces.
Companies using similar video content -
BlackLine – Financial Close & Reconciliation – Encouraging self-correction with pro-level monitoring.
SAP – Treasury and Risk Management – Showcasing professional financial risk monitoring.
26. Aspirational Stock Montage
Retention | Reducing Churn

The Visual & Narrative Approach
To fight churn, you must remind the client of the human value you provide. This style uses high-key, "Fresh Green" and "Warm Sunlight" photography. We see a diverse corporate team in an open-plan office, laughing and pointing at a laptop screen showing a positive trend. The lighting is airy and natural. The narrative is Organizational Success. It connects the software not to "debt," but to "team harmony" and "stress-free operations."
Psychological Impact & KPI Focus
This targets the Emotional Brain. It associates the brand with the feeling of relief and camaraderie. In the retention phase, customers often forget the pain you solved; this visual reminds them of the result of that solution: a happy, collaborative team. It reinforces Customer Sentiment and Net Promoter Score (NPS) by visualizing the "After" state of your service.
Strategic Implementation & Trade-offs
- Best Use Case: Quarterly Business Review (QBR) decks, Newsletters, and "Year in Review" videos.
- Duration: 15-30 Seconds.
- Strategic Trade-off: Generic stock photos are the enemy here. The images must feel candid and authentic, not stiff "handshake" photos, to build genuine connection.
Companies using similar video content -
FloQast – Accounting Transformation Platform – Visualizing team harmony and stress-free operations.
Sage Intacct – Cloud Financial Management – Depicting happy, collaborative finance teams.
27. Holographic UI over 3D Render
Retention | Trial/Freemium User Activation
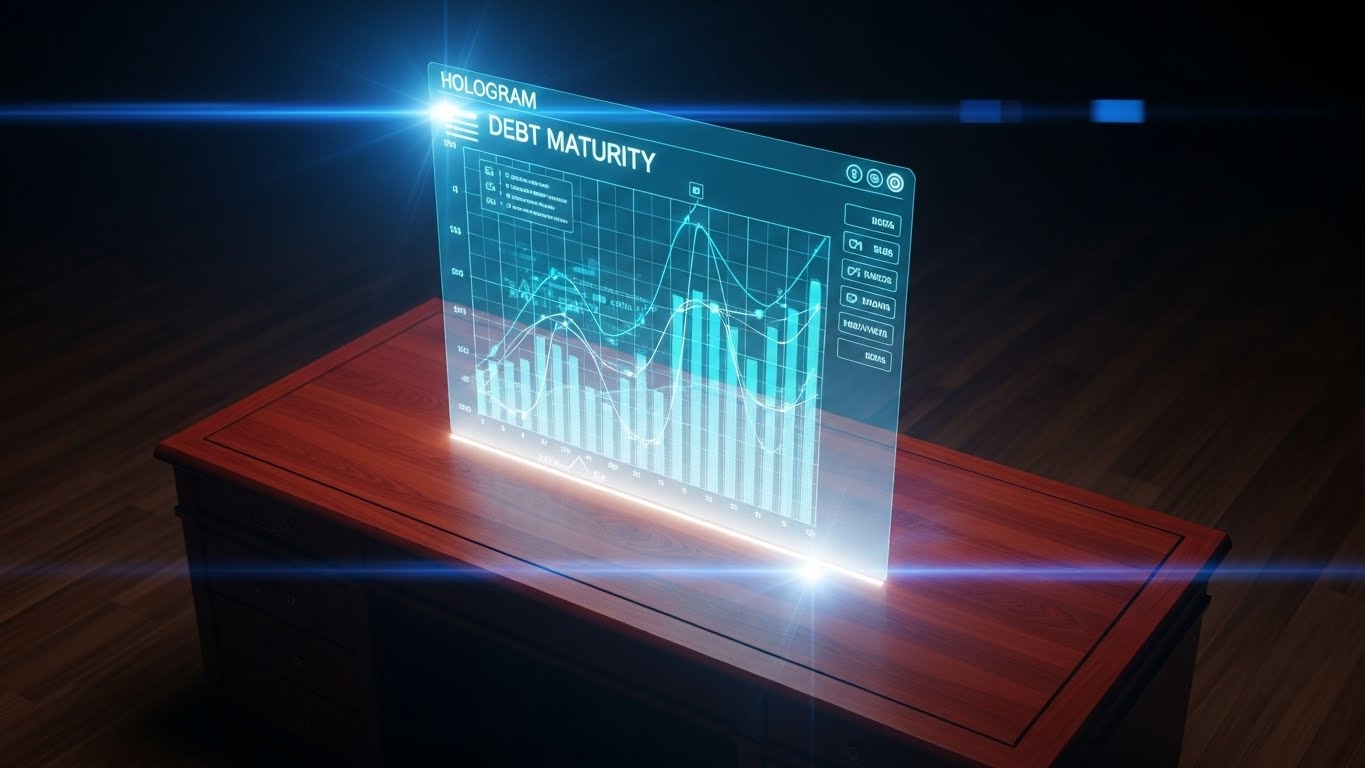
The Visual & Narrative Approach
This style targets the freemium user stuck in old habits. We use a photorealistic render of a classic "Mahogany" executive desk—symbolizing traditional banking stability. Projecting upwards from the surface is a futuristic "Hologram Blue" 3D chart showing "Debt Maturity" curves. The contrast is stark: the old world supports the new. The narrative is Evolution. It visualizes the upgrade path: "Keep your foundation, but upgrade your insights."
Psychological Impact & KPI Focus
This creates a Desirability Gap. The hologram represents the "Premium" features (predictive analytics, AI) that the free user is missing. It appeals to the desire for Modernization without discarding the past. It effectively drives Upsell Conversions by making the premium features look like "superpowers" that float above the mundane physical work.
Strategic Implementation & Trade-offs
- Best Use Case: Retargeting Ads for free users and "Unlock Premium" paywalls inside the app.
- Duration: 5-10 Seconds (Loop).
- Strategic Trade-off: It is highly conceptual. It sells the idea of advanced features rather than the specific workflow. It works best as a "teaser."
Companies using similar video content -
Kyriba – Liquidity Performance Platform – Activating premium modernization with holographic analytics.
HighRadius – Treasury & Risk Suite – Displaying predictive cash flow insights holographically.
28. 3D Glassmorphism & Data Flow
Expansion | Driving Deep Feature Adoption

The Visual & Narrative Approach
To cross-sell a new module (e.g., Cash Flow Forecasting to a Debt Management client), we use "3D Glassmorphism." Two distinct glass spheres—one "Teal" (Debt) and one "Violet" (Cash)—merge fluidly. Inside the glass, particles of light flow freely between the two, symbolizing data integration. The texture is frosted and premium. The narrative is Synergy: "These tools are powerful alone, but seamless together."
Psychological Impact & KPI Focus
This addresses the Silo Effect. Clients often buy point solutions; this visual convinces them of the value of an Integrated Ecosystem. The fluid merging suggests that adding a new module won't add complexity; it will simply expand the flow of value. It drives Expansion Revenue and increases Customer Lifetime Value (LTV) by visualizing the "whole" as greater than the sum of its parts.
Strategic Implementation & Trade-offs
- Best Use Case: Product Launch videos for new modules and "Ecosystem" pages.
- Duration: 10-15 Seconds.
- Strategic Trade-off: It is abstract. It needs concrete copy (e.g., "Connect Debt to Cash Flow") to ground the visual in a specific business benefit.
Companies using similar video content -
OneStream – Financial Consolidation Platform – Visualizing module integration with fluid glass.
CCH Tagetik – Intelligent Platform – Showing data flow between financial close and planning.
29. Split-Screen Kinetic Case Study
Expansion | Driving Upsell/Cross-sell

The Visual & Narrative Approach
To convince a client to move to an Enterprise tier, we use social proof. The screen is split vertically. The left side features bold "Kinetic Typography" of a client testimonial ("Saved $2M in interest"). The right side shows a high-speed screen recording of the specific Enterprise feature that achieved that result (e.g., Automated Hedging). The motion is synchronized: as the text hits the screen, the UI highlights the relevant data point.
Psychological Impact & KPI Focus
This targets Risk Aversion. Upgrading is a financial risk; seeing a peer achieve a specific dollar result mitigates that risk. By pairing the quote directly with the UI, you validate the claim—it’s not just marketing fluff; here is the tool doing the work. It supports Upsell Velocity and builds Credibility for the higher price point.
Strategic Implementation & Trade-offs
- Best Use Case: Case Study pages and personalized email campaigns to "High Potential" accounts.
- Duration: 15-30 Seconds.
- Strategic Trade-off: It requires client permission for the quote. Without a real name/logo, the impact is significantly reduced.
Companies using similar video content -
GTreasury – TMS – Validating upgrades with kinetic testimonials and feature highlights.
Coupa – Treasury & Cash Management – Proving results with testimonials and feature demos.
30. Realistic Character Video
Expansion | Driving Referrals & Advocacy
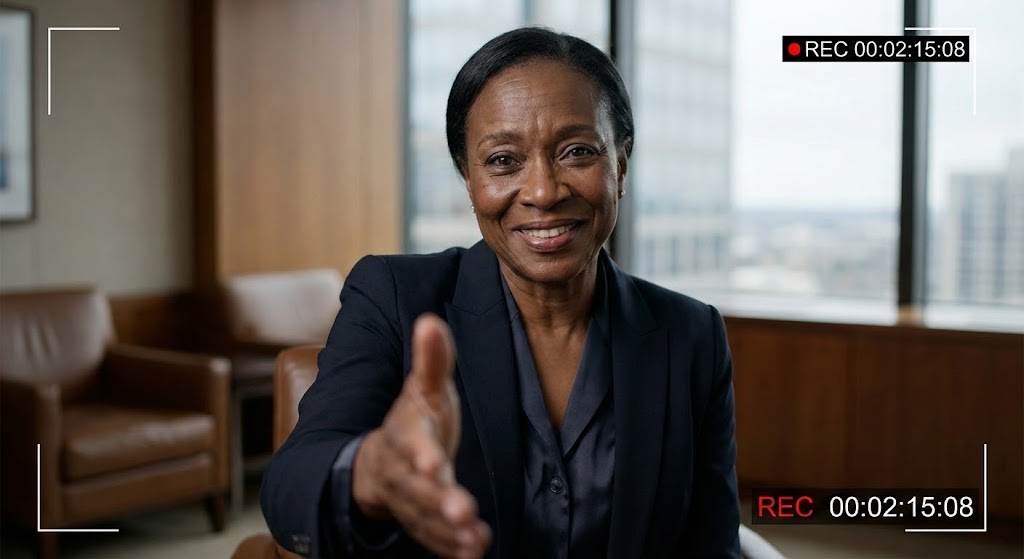
The Visual & Narrative Approach
The ultimate goal is advocacy. This style uses cinematic, 85mm portrait footage of a "Distinguished Female CFO." She stands in a soft-focus executive office, smiling genuinely and extending her hand towards the camera for a handshake. The lighting is warm and premium. The narrative is Partnership. It breaks the fourth wall, welcoming the viewer (or the referral) into the circle of trust. It signifies the transition from "Vendor" to "Partner."
Psychological Impact & KPI Focus
This triggers Reciprocity and Trust. It humanizes the brand at the highest level. For a satisfied customer, this image mirrors their own feelings of success. It is designed to encourage Referrals and Testimonials. It positions the brand not as a software tool, but as a member of the executive team.
Strategic Implementation & Trade-offs
- Best Use Case: "Thank You" pages after a renewal, Referral Program landing pages, and Case Study headers.
- Duration: Static or Cinemagraph (breathing/blinking).
- Strategic Trade-off: Authenticity is paramount. If the model looks too "stock," it feels manipulative. Diversity and genuine expression are critical.
Strategic Knowledge Base: The Visual Operations Doctrine
To transform these 30 visual styles from "marketing assets" into a cohesive business strategy, we must implement a Visual Operations Doctrine. This framework aligns your visual language with your operational goals, ensuring that every pixel serves a purpose in the Debt Management lifecycle.
Strategic Alignment & Visual Architecture
The "Pre-Production" Strategy: Why and Who
- The Cognitive Load Audit: Before creating assets, audit your current training materials. If a concept (e.g., "Intercompany Netting") takes 5 paragraphs to explain, it is a candidate for Style 1 (Abstract 2D). Replace dense text with visual shorthand to reduce user fatigue.
- Role-Based Visual Mapping: Differentiate your visual strategy. For the CFO (Economic Buyer), use Style 16 (Lifestyle Stock with UI) to sell vision and strategy. For the Senior Analyst (User), use Style 25 (Dark Mode UI) to sell precision and control. One size does not fit all.
- The "Glanceability" Standard: In a high-stakes Treasury environment, data must be readable in milliseconds. Apply Style 2 (Minimalist Vector) principles to your in-app notifications—use clear shapes (Checks/Alerts) rather than text to communicate status instantly.
- Brand Voice Consistency: Your marketing videos (TOFU) and your support tutorials (BOFU) often look like they come from different companies. Use a unified color palette (e.g., "Emerald Green" for success) across Style 3 (Kinetic Type) and Style 24 (Macro UI) to create a seamless brand experience.
- The Advids Strategic Audit: Partner with Advids to define this "Visual Operating System" before production begins. A fragmented visual library confuses users; a cohesive one builds subconscious trust.
- Standardization vs. Customization: For core features (e.g., Login, Dashboard), use high-fidelity, standardized assets like Style 10 (Clean UI). For client-specific QBRs, use customizable templates like Style 14 (Dynamic Data) where specific ROI numbers can be inserted easily.
- The Cross-Departmental Bridge: Use visuals to unify terminology. If Sales calls it "Liquidity Planning" and Product calls it "Cash Forecasting," create a Style 15 (Isometric Workflow) animation that visually links the terms, ensuring everyone speaks the same language.
- Legacy System Integration: Visualizing the invisible link between old on-premise ERPs and your SaaS is critical. Use Style 5 (Wireframe to Reality) to show the "bridge," reassuring IT that their legacy data is safe while being modernized.
- Accessibility in Finance: Finance teams are global. Design Style 22 (2D Character) animations without text or with easy localization in mind. Rely on universal visual metaphors (Green = Good, Red = Bad) to transcend language barriers.
- The Mobile-First Mandate: Even Treasurers check balances on the go. Ensure Style 8 (Photorealistic) assets are legible on small screens. Complex dashboards must be simplified into "Card Views" for mobile consumption.
Operational Adoption & Implementation
The "Deployment" Phase: Embedding Visuals into Workflow
- Overcoming "Big Brother" Anxiety: Automated debt monitoring can feel like surveillance to junior staff. Use Style 17 (3D X-Ray) to frame the technology as a "Protective Shield" (Risk Mitigation) rather than a "Spyglass," fostering trust and adoption.
- The Micro-Learning Shift: Nobody reads the 100-page implementation manual. Break it down into 30-second clips using Style 21 (Low-Poly) for setup and Style 24 (Macro UI) for specific tasks. Embed these directly in the software.
- Just-in-Time Support: Don't force users to leave the app to find help. Embed Style 25 (Dark Mode UI) walkthroughs in a side panel that triggers when a user hovers over a complex feature like "Covenant Compliance."
- Gamification of Training: Use Style 23 (Hyper-lapse) energy to celebrate training milestones. Visualizing progress bars and "Level Ups" encourages users to complete the boring but necessary onboarding modules.
- Reducing Support Ticket Volume: There is a direct correlation between proactive visual guides and reduced call center load. If "Password Reset" is a top ticket, create a Style 2 (Minimalist Vector) GIF that solves it in 10 seconds.
- Remote Onboarding: For distributed finance teams, you cannot rely on in-person seminars. Use Style 26 (Aspirational Montage) and Style 30 (Realistic Character) to build human connection and culture remotely through video.
- Standard Operating Procedures (SOPs): Transform text-based SOPs into visual process flows using Style 7 (Isometric 2D). A visual map of the "Month-End Close" process is far less prone to error than a checklist.
- Feedback Loops: Use interactive video elements (e.g., "Click the error in this video") to test user knowledge. This turns passive watching into active learning, increasing retention of complex debt concepts.
- Scalable Localization: When expanding to new markets (e.g., EMEA vs. APAC), use Style 6 (Abstract 3D) maps to visualize global connectivity. Keep text overlays separate from the video file to allow for cheap, fast translation.
- Leadership Communication: Empower your champion (The Treasurer) to sell your value internally. Provide them with Style 16 (Lifestyle Stock) slide decks that they can present to the Board, making them look visionary and your software indispensable.
Measuring Impact & Future-Proofing
The "ROI" Phase: Measuring Success and Looking Ahead
- Beyond "Views": Vanity metrics don't matter. Measure Time-to-Competency (how fast a user learns a feature via video) and Feature Adoption Rate (do they use the tool after watching?).
- The "Closing Time" Metric: In debt management, speed is money. Correlate better visualization (e.g., Style 13 Rapid UI Montage) with a reduction in the "Days to Close Books." If clarity speeds up the process, video has a hard ROI.
- Compliance Velocity: When regulations change (e.g., new IFRS standards), measure how fast the team adapts. Video explains changes 60,000x faster than text. Use Style 11 (2D Line Art) to visualize the "Old Rule" vs. "New Rule" switch.
- Retention and Churn: High-quality UX visualization improves Perceived Value. Track the LTV (Lifetime Value) of cohorts exposed to your "Premium Visual Onboarding" vs. those who got the PDF. The visual cohort almost always retains longer.
- The AI Visual Frontier: Prepare for Generative UI. Soon, interfaces will adapt to the user. Your video content must be modular (like Style 21) so AI can reassemble it on the fly for custom tutorials.
- Scalability of Assets: Build a library, not a landfill. Tag every asset (Style 1, Style 20, etc.) so they can be reused. A Style 4 (Abstract Motion) background used in a TOFU ad can be reused as a header for a BOFU whitepaper.
- The Advids Partnership: Visual styles evolve. What is "Modern" today is "Retro" tomorrow. Partner with Advids to maintain a "Living Library" of assets that evolves with your product, ensuring you never look outdated.
- Benchmarking Success: "Good enough" is a competitive risk. If your competitor uses Style 8 (Photorealism) and you use basic screenshots, you lose authority. Regularly audit your visual standard against the market leaders.
- The ROI of Error Reduction: In debt management, a decimal error is a disaster. Quantify the insurance/risk cost reduction achieved by better training visuals. If Style 24 (Macro UI) prevents one major reconciliation error, it pays for the entire video budget.
- Final Call to Innovation: Treat video as Infrastructure, not content. It is the fiber-optic cable that carries understanding from your code to your customer's brain. Invest in it with the same rigor you invest in your backend database.
Companies using similar video content -
FIS – Treasury and Risk Manager – Cementing long-term partnership with executive handshake.
Oracle – Cash and Treasury Management – Conveying trust and long-term collaboration.
Author & Editor Bio


