
Introduction: Visualizing the Nervous System of Healthcare Finance
In the high-stakes world of healthcare, the most critical infrastructure is often the one you cannot see. It is the digital nervous system that connects a patient’s care journey to the provider’s financial sustainability. For modern SaaS platforms, the challenge is no longer just processing claims; it is about visualizing "Revenue Intelligence" in a way that builds immediate trust with skeptical CFOs and overburdened RCM directors.
The operational reality is stark. As the physical demands of patient care grow, the digital friction of reimbursement is compounding. Recent data indicates that the initial denial rate increased to 11.8% in 2024, a trend that threatens to erode the thin margins of healthcare providers. This is not merely an administrative nuisance; it is a systemic blockage. However, the opportunity for correction is equally massive. The industry currently holds the potential to save upwards of $20 billion annually by transitioning from manual interventions to fully automated, intelligent workflows.
For marketing leaders and founders in the HealthTech space, this presents a unique communication challenge. How do you visualize an API call? How do you make "interoperability" look like a tangible asset? This guide is your strategic blueprint. We have curated 30 distinct video visualization styles designed to bridge the gap between complex backend logic and clear, front-end value. These styles do not just decorate your message; they reduce the cognitive load for your decision-makers, proving that your platform is the stable, secure bridge to financial health.
1. Minimalist Flat 2D Vector
TOFU | Brand Awareness

The Visual & Narrative Approach
Imagine a simplified, symmetrical view of a healthcare facility. We strip away the noise of the real world, leaving only clean lines and crisp white and slate gray geometry. As the camera holds steady, a "clean claim"—represented by a golden coin icon—floats effortlessly from the hospital structure up toward a protective shield in soft coral. This is not about the chaos of the ER; it is about the stability of the finance department.
Psychological Impact & KPI Focus
- Niche Psychology: This style leverages cognitive ease. By removing textures and gradients, we signal to the viewer that the platform is "uncluttered" and "straightforward." For a CFO tired of complexity, this visual simplicity serves as a metaphor for a frictionless implementation process.
- Operational Impact: Directly addresses the KPI of Brand Recall and Trust. It visually declutters the RCM process, implying that the vendor simplifies complexity.
Strategic Implementation & Trade-offs
- Best Use Case: TOFU Landing Pages and "About Us" sections where establishing instant credibility is paramount.
- Duration: 15-20 Seconds (Looping).
- Trade-off: Ideal for explaining high-level concepts (like "Security" or "Stability"). It lacks the detail needed for a product UI walkthrough but excels at establishing an initial feeling of competence and order on a landing page.
Companies using similar video content -
Waystar – Simplifies healthcare payments and accelerates financial results.
Optum – Improves healthcare system effectiveness and promotes healthier lives.
2. Bold Kinetic Typography (Visual)
TOFU | Market Education

The Visual & Narrative Approach
The screen is a high-contrast canvas of electric blue and lime green blocks. These aren't just shapes; they mimic the structure of heavy data packets. They cascade down the screen like a waterfall, representing the sheer volume of claims your software processes per second. The movement is rhythmic and precise—no collisions, no lag. It visualizes the "throughput" of your engine without needing a single screenshot.
Psychological Impact & KPI Focus
- Niche Psychology: The "waterfall" effect triggers a sense of velocity. It reassures the viewer that the platform can handle volume without breaking. The hard edges and high contrast communicate modernity and speed, directly countering the audience's fear of "slow" legacy systems.
- Operational Impact: Targets Processing Speed and First-Pass Rate. It turns the concept of batch processing into an exciting visual event.
Strategic Implementation & Trade-offs
- Best Use Case: LinkedIn organic feeds where sound-off motion is critical to stopping the scroll.
- Duration: 6-10 Seconds.
- Trade-off: This is a "feeling" style, not a "learning" style. It builds excitement on social feeds but should not be used when you need to explain how the feature works.
Companies using similar video content -
Availity – Connects healthcare with real-time network and intelligent workflows.
Infinx – Automates payment lifecycle with AI for preauthorization.
3. Abstract 2D flat vector organic modern motion graphics
TOFU | Shaping Brand Perception

The Visual & Narrative Approach
Healthcare is organic (biological); Finance is digital (linear). This style bridges the two. We see fluid, glossy shapes in cyan and magenta that resemble biological cells. As they drift across the screen, they morph seamlessly into structured digital nodes. This metamorphosis visualizes the "Revenue Cycle": the transformation of a patient's physical care episode into a digital, reimbursable event.
Psychological Impact & KPI Focus
- Niche Psychology: The fluid motion softens the brand image. RCM is often seen as cold and punitive; this style paints it as an adaptable, living ecosystem. It suggests that your software adapts to the patient journey rather than forcing the hospital to adapt to rigid constraints.
- Operational Impact: Supports Interoperability and Patient Experience KPIs. It visualizes the smooth transfer of data between clinical and financial systems.
Strategic Implementation & Trade-offs
- Best Use Case: Meta & General Social Ads aiming to humanize the brand.
- Duration: 20-30 Seconds.
- Trade-off: Perfect for "Vision" videos, but too abstract for technical buyers who want to see the dashboard. Use this to set the mood before diving into the hard specs.
Companies using similar video content -
MEDITECH – Provides interoperable digital health solutions for care delivery.
DrChrono – Seamlessly integrates clinical workflows and patient engagement.
4. Abstract 2D Motion Graphics
TOFU | Skippable Pre-Roll Ad

The Visual & Narrative Approach
We enter a tunnel of high-velocity lines and chevron patterns in intense tangerine and royal purple. The camera moves forward aggressively toward a central vanishing point. This is the "Warp Speed" effect. It visually translates the concept of reducing Days Sales Outstanding (DSO). We aren't just moving data; we are accelerating cash flow from the payer back to the provider.
Psychological Impact & KPI Focus
- Niche Psychology: The forward momentum creates a "visual pull," keeping the viewer's eye locked on the center of the screen. It subliminally communicates that your platform is the fastest route to the destination (payment).
- Operational Impact: Focuses on Cash Flow Velocity and Reduced A/R Days. It promises a faster time-to-value.
Strategic Implementation & Trade-offs
- Best Use Case: YouTube Skippable Pre-Roll Ads (5 seconds to hook).
- Duration: 15 Seconds.
- Trade-off: High energy, but low nuance. Use this for re-targeting ads to remind prospects that you are the "fast" solution. Avoid for compliance topics where "speed" implies "carelessness."
Companies using similar video content -
Experian Health – Accelerates claims management and improves revenue recovery.
CureAR – Delivers AI-first automation across the entire billing lifecycle.
5. Isometric 2D Motion Design
TOFU | Vertical Social Organic

The Visual & Narrative Approach
An isometric smartphone floats in a clean, white grid space. Suddenly, notifications don't just appear on the screen—they physically "pop out" as 3D vector bubbles in sapphire blue. "Instant Claim," "Payment Alert," and "Denial Warning" hover in the air above the device. This dimensional approach proves that your mobile app pushes critical data out to the user, rather than hiding it in a menu.
Psychological Impact & KPI Focus
- Niche Psychology: Isometric projection implies precision and architectural control. It tells the RCM Director, "We give you a god's-eye view of your operations." The pop-out elements visualize "proactive alerts," addressing the pain point of missing critical deadlines.
- Operational Impact: Demonstrates Real-Time Visibility and Mobile Responsiveness. It appeals to the need for control outside the office.
Strategic Implementation & Trade-offs
- Best Use Case: Vertical Social (TikTok, Reels) targeting mobile-first professionals.
- Duration: 15-30 Seconds.
- Trade-off: Excellent for highlighting features, but requires precise design to look "clean." Keep the background stark white to maintain the "clinical" feel.
Companies using similar video content -
pMD – Offers an easy-to-use mobile app for charge capture.
Carepatron – Provides mobile-first practice management and billing.
6. Generative AI cinematic video
TOFU | Category Creation

The Visual & Narrative Approach
We drift down a hospital corridor that feels more like a spaceship than a clinic. It is pristine, polished, and hyper-realistic. But instead of nurses carrying clipboards, we see streams of ethereal gold and blue light flowing through the walls and along the floor. These light streams represent the "Revenue Intelligence Ecosystem"—the invisible data network that powers the facility.
Psychological Impact & KPI Focus
- Niche Psychology: This style elevates your software from a "tool" to an "infrastructure." By visualizing the data as light, we make it feel essential, pure, and omnipresent. It appeals to the C-Suite's desire to be on the cutting edge of "Future Health."
- Operational Impact: Aligns with Strategic Transformation and Category Leadership. It positions the solution as a long-term investment in the hospital's future.
Strategic Implementation & Trade-offs
- Best Use Case: Connected TV (CTV) / OTT ads and Conference Openers.
- Duration: 30-60 Seconds.
- Trade-off: High production value sets a very high expectation. It works best for "Who We Are" videos, not "How It Works" videos.
Companies using similar video content -
CombineHealth – Offers an autonomous AI RCM platform for revenue challenges.
Thoughtful – Delivers AI solutions for a seamless, hybrid RCM service.
7. Dynamic Data Visualization
TOFU | Demand Gen & Lead Capture

The Visual & Narrative Approach
This is a celebration of metrics. On a crisp white background, emerald green bar charts rise aggressively. They aren't static; they pulse with growth. Neon trend lines weave through the bars like currents of electricity. It visualizes the result of using your platform: optimized revenue capture. The symmetry and upward trajectory communicate absolute financial control.
Psychological Impact & KPI Focus
- Niche Psychology: Finance leaders think in charts. This speaks their native language. The use of Green (money/go) and upward motion triggers a dopamine response associated with "profitability" and "success."
- Operational Impact: Visualizes ROI, Net Collection Rate, and Revenue Growth. It provides the visual evidence CFOs need to justify the purchase.
Strategic Implementation & Trade-offs
- Best Use Case: LinkedIn Video Ads and Lead Gen Forms.
- Duration: 15-20 Seconds.
- Trade-off: Can look generic if not branded. Ensure your specific UI colors and fonts are used in the chart elements to maintain brand consistency.
Companies using similar video content -
RevSpring – Optimizes patient satisfaction and financial outcomes with analytics.
Athenahealth – Provides automated RCM workflows with predictive claim intelligence.
8. Futuristic Neon/Dark Mode
TOFU | ABM Awareness

The Visual & Narrative Approach
The lights go down, and the "Dark Mode" engages. We zoom in on a digital circuit board layout, glowing in neon chartreuse and electric violet against deep black. The interconnected web resembles a hospital network map, with glowing nodes pulsing at intersections. This is the "Cyber-Medical" aesthetic, portraying the software as a sophisticated, secure neural network.
Psychological Impact & KPI Focus
- Niche Psychology: Dark mode is associated with developer tools and high-end tech. This style targets the IT Director and CTO influencers within the buying committee. It reassures them that the backend is robust, encrypted, and modern.
- Operational Impact: Highlights Cybersecurity, Data Encryption, and System Uptime. It addresses anxieties about data breaches and system fragility.
Strategic Implementation & Trade-offs
- Best Use Case: Programmatic & ABM Display targeting technical stakeholders.
- Duration: 10-15 Seconds (Looping).
- Trade-off: It can feel "too techy" for a generalist audience. Use this specifically for ABM campaigns targeting technical roles.
Companies using similar video content -
ENTER – Delivers secure, scalable RCM with enterprise-grade encryption.
Promantra – Offers cybersecurity best practices for RCM with AI threat detection.
9. Wireframe to Reality Transition
MOFU | Product Differentiation

The Visual & Narrative Approach
A split-screen composition. On the left, a chaotic, wireframe blueprint of stacked papers is rendered in technical blue lines—representing the "old way." A glowing vertical laser scans across the screen. As it passes to the right, the wireframe instantly resolves into a photorealistic, pristine white server rack or organized digital dashboard.
Psychological Impact & KPI Focus
- Niche Psychology: This is a powerful visual metaphor for Digital Transformation. It validates the current pain (chaos/paper) and instantly offers the cure (structure/SaaS). The "scan" effect implies that your software is the catalyst for this change.
- Operational Impact: Visualizes Process Optimization and Legacy Migration. It shows the tangible "Before and After" of adopting the platform.
Strategic Implementation & Trade-offs
- Best Use Case: Website & Landing Pages (Hero Section).
- Duration: 20-30 Seconds.
- Trade-off: Great for explaining the onboarding process. It visualizes the "Implementation" phase, showing that the transition is seamless.
Companies using similar video content -
TruBridge – Streamlines revenue cycle and improves efficiency for healthcare.
Vee Technologies – Aids process optimization and cash flow increase with RPA.
10. 3D X-Ray Visualization
MOFU | Building Trust & Credibility

The Visual & Narrative Approach
We look inside the technology. A stylized microchip processor is rendered in beautiful, translucent glass and silver. Deep inside the chip, glowing with a warm inner light, is a golden padlock. This X-ray view tells the viewer that security and HIPAA compliance aren't "add-ons"; they are baked into the very core architecture of the processor.
Psychological Impact & KPI Focus
- Niche Psychology: Transparency builds trust. By making the object translucent, we subliminally suggest "we have nothing to hide." It visually answers the skeptical question: "Is security a priority?" The padlock inside the chip confirms it is foundational.
- Operational Impact: Focuses on Compliance Architecture and Risk Management. It positions the platform as a secure fortress for patient data.
Strategic Implementation & Trade-offs
- Best Use Case: "Trust Center" pages and Product Deep Dives.
- Duration: 15-20 Seconds.
- Trade-off: This is a static, slow-moving style. It projects stability and depth, making it ideal for MOFU/BOFU content where trust is the primary barrier to conversion.
Companies using similar video content -
RCM Centric – Safeguards IT infrastructure and ensures stable IT processes.
MedSys Group – Specializes in IT security consulting for RCM vendors.
11. 2D Line Art Animation
MOFU | YouTube
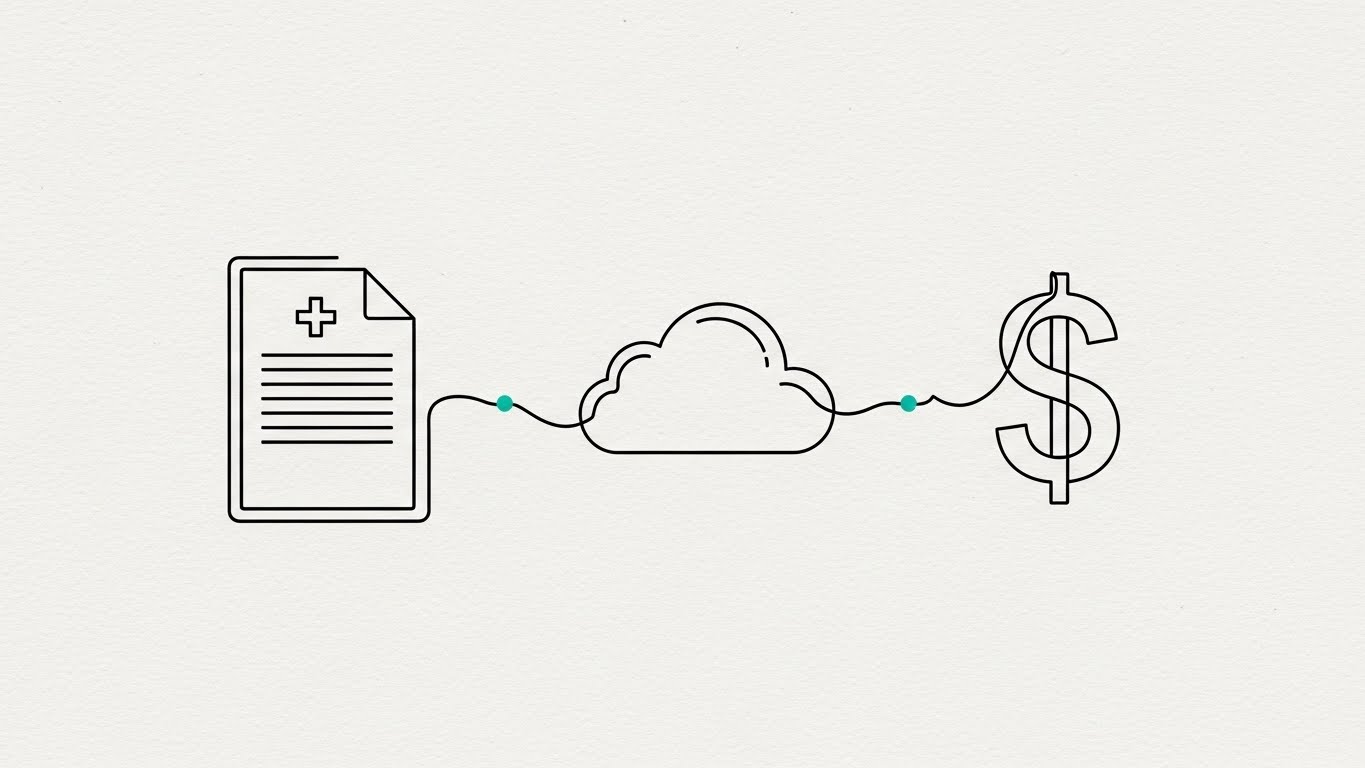
The Visual & Narrative Approach
In an industry plagued by fragmentation, this style offers a visual thesis of continuity. We use a single, continuous, thin black line on a textured off-white paper background. The line acts as a narrative thread, beginning as the outline of a medical chart, flowing smoothly into a cloud icon, and finally resolving into a dollar sign. There are no breaks, no jumps, and no friction. It represents the "Perfect Claim"—one that moves from patient registration to payment without manual intervention.
Psychological Impact & KPI Focus
- Niche Psychology: The "continuous line" technique is a powerful metaphor for interoperability. It subliminally combats the RCM Director's fear of "black holes" where claims get lost between disparate systems. It suggests a singular, unified thread of data.
- Operational Impact: Highlights First-Pass Resolution and Workflow Continuity. It visualizes the elimination of hand-offs and data silos.
Strategic Implementation & Trade-offs
- Best Use Case: SEO-driven YouTube content explaining "The Perfect Claim Lifecycle."
- Duration: 30-45 Seconds.
- Trade-off: Highly elegant, but lacks technical density. Use this to explain the concept of your workflow, not the mechanics of your API.
Companies using similar video content -
Aptarro – Simplifies RCM to reduce denials and streamline billing.
RCM Matter – Provides comprehensive RCM solutions, reducing claim errors.
12. Abstract 3D AI Visualization
MOFU | Feature Education

The Visual & Narrative Approach
We visualize the brain of the platform. Against a deep, atmospheric void, a complex structure of glowing particles and nodes glows in deep violet and metallic gold. These nodes connect via thin, glowing filaments, forming a pulsating neural network structure that resembles a brain. This isn't just storage; it's active intelligence. The rendering focuses on the luminescence of the connections, representing the AI engine analyzing global payer trends in real-time to predict denials before they happen.
Psychological Impact & KPI Focus
- Niche Psychology: This style creates a sense of technological awe. It reframes the software from a passive "database" to an active "intelligence." For the CTO, it validates the sophistication of the backend; for the CFO, it promises a competitive advantage through predictive power.
- Operational Impact: Focuses on Denial Prediction and Global Payer Rule Management. It shows that your system learns from the entire network, not just one hospital.
Strategic Implementation & Trade-offs
- Best Use Case: Email Marketing campaigns introducing new AI features.
- Duration: 15-20 Seconds (Looping).
- Trade-off: Abstract visualization requires clear voiceover or text overlays to define what the "particles" represent (e.g., "Analyzing 5 Million Claims Daily").
Companies using similar video content -
Experian Health – Leverages AI to predict denials and improve claim accuracy.
Infinx – Uses AI in Account Receivable Optimizer to reduce denials.
13. AI generated mixed media video
MOFU | Website Visitor Re-engagement

The Visual & Narrative Approach
A dynamic collision of the old world and the new. We see a dynamic collage blending torn textures of old medical paper forms with sleek, glossy 3D spheres in vibrant turquoise and magenta. As the spheres move, they "consume" the vintage beige paper, leaving behind digital trails. This style acknowledges the reality of the prospect's current state (paper-heavy, messy) and visualizes the transition to a modern, digital future without ignoring the legacy baggage.
Psychological Impact & KPI Focus
- Niche Psychology: This "Collage" aesthetic resonates with the messy reality of healthcare operations. It feels authentic, not sterile. It tells the viewer, "We understand your complex paper trail, and we can digitize it."
- Operational Impact: Targets Digitization and Efficiency Gains. It vividly represents the ingestion and processing of unstructured data (OCR).
Strategic Implementation & Trade-offs
- Best Use Case: Meta & General Social Ads (Retargeting) for users who visited the "Solutions" page but didn't convert.
- Duration: 15-30 Seconds.
- Trade-off: The "busy" aesthetic grabs attention but can be distracting. Ensure the core message—transformation—is the clear focal point.
Companies using similar video content -
Alive Health – Provides AI-assisted patient intake and charting automation.
Thoughtful – Offers AI solutions for continuous learning and instant scaling.
14. Low-Poly 3D Modeling
MOFU | Competitive Displacement

The Visual & Narrative Approach
We zoom out to a "God's Eye View" of a stylized hospital campus. The buildings are simple geometric shapes in soft pastel blue, mint green, and light coral. Floating above the campus are large, faceted checkmark icons, symbolizing approval. The lighting is bright with sharp shadows. This style simplifies the daunting complexity of a multi-location health system into a manageable, playful model. It makes the "Enterprise Ecosystem" feel approachable rather than overwhelming.
Psychological Impact & KPI Focus
- Niche Psychology: Low-poly art reduces cognitive load. For a VP of Revenue Cycle managing 20 locations, this visual suggests that your platform provides a unified, simplified view of the entire empire. It promises control over the chaos.
- Operational Impact: Visualizes Multi-Site Management and Centralized Reporting. It demonstrates scalability across the network.
Strategic Implementation & Trade-offs
- Best Use Case: LinkedIn Video Ads targeting Enterprise accounts.
- Duration: 20-30 Seconds.
- Trade-off: The "playful" look must be balanced with professional copy. It works best to illustrate "Simplification," not "Deep Technical Specs."
Companies using similar video content -
Optum – Offers scalable RCM platforms for complex provider networks.
Ensemble Health Partners – Delivers process-driven automation with selective AI use.
15. Holographic UI over 3D Render
MOFU | Overcoming Objections

The Visual & Narrative Approach
We utilize a realistic 3D rendering of a sleek, white modern executive desk. Hovering above the desk surface is a semi-transparent, futuristic holographic UI screen displaying a progress bar indicating "100%" completion. The hologram is rendered in luminous cyan and white light. This visual metaphor positions the software not just as a desktop app, but as a high-tech command center that provides total visibility and control.
Psychological Impact & KPI Focus
- Niche Psychology: This aesthetic appeals to the IT and Operations stakeholders. It communicates robustness and future-readiness. It counters the objection that cloud software is "flimsy," presenting it instead as the structural engineering that holds up the financial house.
- Operational Impact: Targets System Reliability, Real-Time Analytics, and Infrastructure Health. It visualizes the backend monitoring that prevents revenue leakage.
Strategic Implementation & Trade-offs
- Best Use Case: Sales Enablement decks and "Security/Architecture" deep dives.
- Duration: 15-20 Seconds.
- Trade-off: It is very modern and "tech-heavy." Use it to sell "Power" and "Stability," but switch to lighter styles for "User Experience."
Companies using similar video content -
Oracle Health – Embeds enterprise automation in cloud health platforms.
MEDITECH – Revolutionizes healthcare with its digital solution, Expanse.
16. Clean UI Workflow (Light Mode)
MOFU | Driving Demo Requests
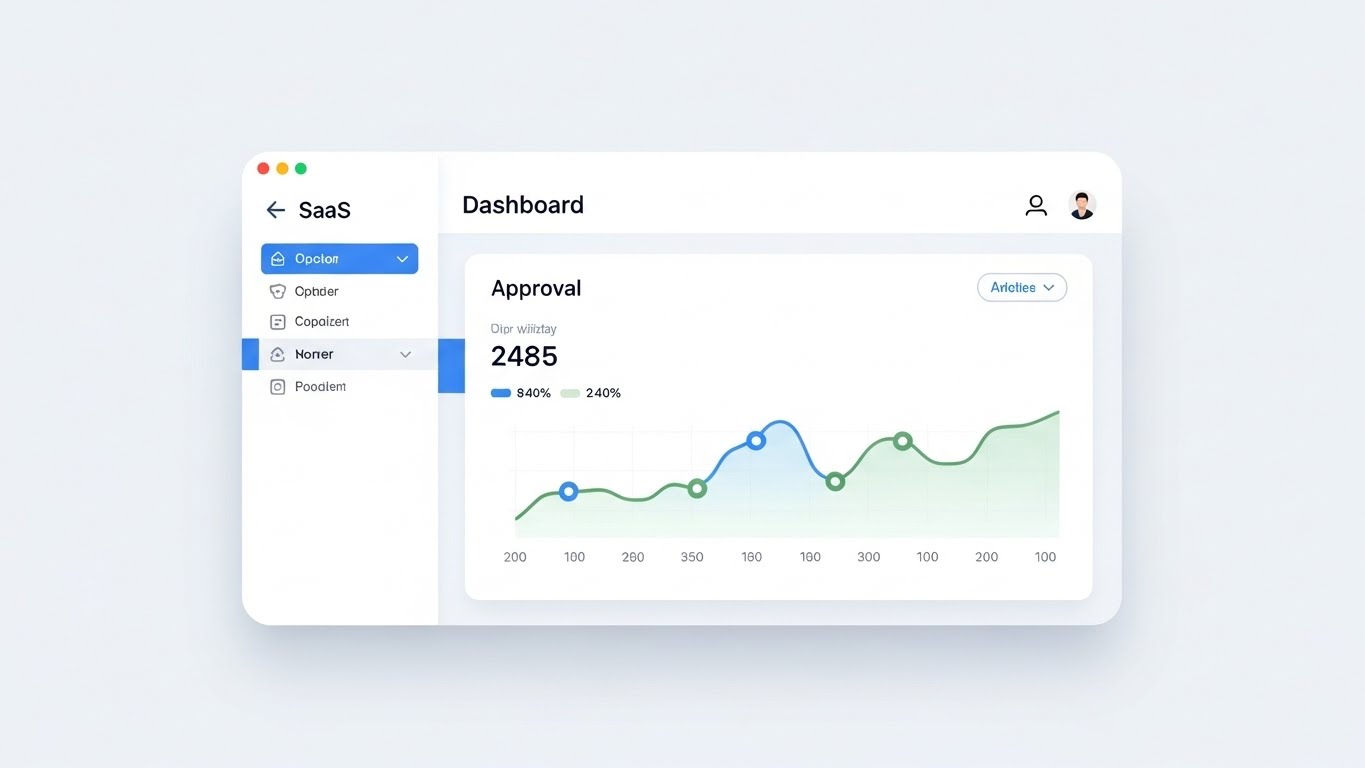
The Visual & Narrative Approach
Sometimes, the most radical visualization is clarity. We see a clean, light-mode UI presentation showing a SaaS dashboard screen. The interface is dominated by whitespace, soft gray borders, and data visualizations in sky blue and sage green. The screen displays an approval widget with a rising trend line. This is the "Monday Morning" promise: a workspace that is organized, legible, and focused on the metrics that matter.
Psychological Impact & KPI Focus
- Niche Psychology: This appeals to the user's desire for order. The "Apple-esque" aesthetic signals modern usability. It lowers the barrier to entry by making the software look easy to learn and pleasant to use.
- Operational Impact: Focuses on User Adoption and Ease of Use. It directly visualizes the "Single Pane of Glass" value proposition.
Strategic Implementation & Trade-offs
- Best Use Case: Product Pages (Website) and "How It Works" sections.
- Duration: 30-60 Seconds.
- Trade-off: It is static and functional. It relies entirely on the quality of your actual UI design. It doesn't "sell the dream"—it "sells the reality."
Companies using similar video content -
DrChrono – Provides innovative EHR workflows and intuitive experience.
Tebra – Offers easy-to-use practice management and RCM.
17. 2D Character-Driven Story
MOFU | ROI Justification

The Visual & Narrative Approach
We introduce a human element. A 2D vector character illustration of a young professional woman—wearing business casual attire in mustard yellow and charcoal gray—stands in profile. She looks happily at a large, floating chart ascending upwards. This style shifts the focus from the software to the user's success. It visualizes the moment of realization when the RCM Director sees the numbers turn around—the "Hero Moment" that your platform delivers.
Psychological Impact & KPI Focus
- Niche Psychology: By featuring a relatable character, we trigger mirror neurons. The viewer projects themselves into the role of the successful manager. It validates their aspiration to be the one who "fixed the revenue cycle."
- Operational Impact: Highlights Staff Satisfaction and Performance Improvement. It humanizes the ROI data.
Strategic Implementation & Trade-offs
- Best Use Case: Email Nurture Campaigns and Case Study summaries.
- Duration: 30-45 Seconds.
- Trade-off: Can feel "generic corporate" if not stylized correctly. The specific color palette (mustard/charcoal) helps elevate it above standard stock art.
Companies using similar video content -
VBRCM – Empowers providers with expert-driven RCM solutions.
RCMProviders.com – Assists medical practices with AI-powered voice and text agents.
18. Photorealistic 3D Renders
BOFU | The Economic Buyer

The Visual & Narrative Approach
We pivot to a high-end, photorealistic scene. A stack of gold coins rests on a polished white marble surface, bathed in soft, cinematic lighting. In the background, slightly out of focus, is a sleek laptop displaying a financial graph. This style elevates the administrative task of billing into a high-stakes, high-value financial operation. It visually anchors the software's value in cold, hard cash—specifically, the recovery of lost revenue.
Psychological Impact & KPI Focus
- Niche Psychology: The photorealism grounds the software in the physical world of the executive office. It tells the Economic Buyer that this is a premium, enterprise-grade tool for managing their most valuable assets.
- Operational Impact: Focuses on Net Revenue Impact and Profitability. It prevents the revenue loss caused by inefficient collections.
Strategic Implementation & Trade-offs
- Best Use Case: LinkedIn Organic and specialized "Financial Value" solution pages.
- Duration: 10-15 Seconds.
- Trade-off: Highly specific. It works best as a "punctuation mark" in a campaign rather than the main narrative, signaling solidity and wealth.
Companies using similar video content -
Waystar – Drives meaningful outcomes for peak financial performance.
Experian Health – Improves recovery rates on overdue accounts and collections.
19. Rapid UI Feature Montage
BOFU | Sales Cycle Acceleration
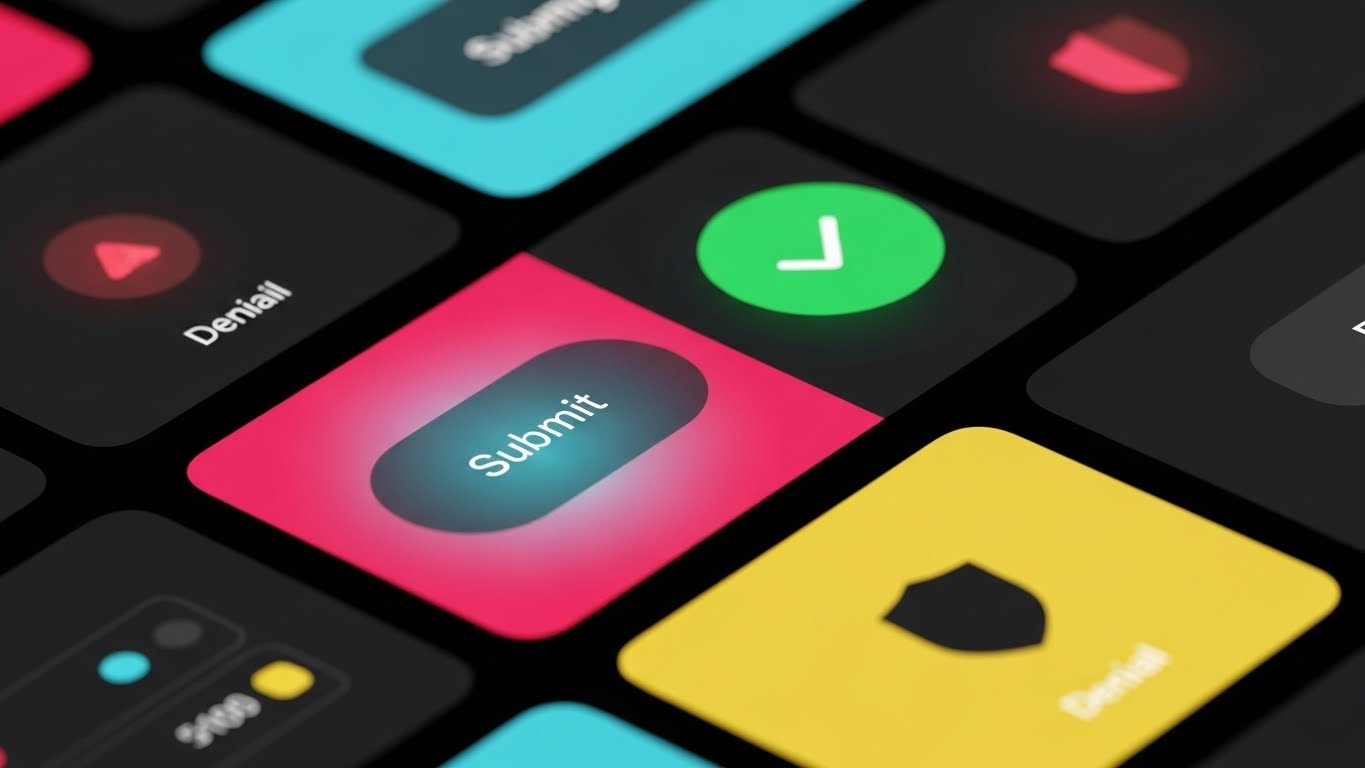
The Visual & Narrative Approach
Speed is the currency here. The screen is divided into a grid of close-up UI snippets: an abstract "Submit" button, a green badge featuring a checkmark symbol, and a shield notification. The color palette uses alert colors, shifting from muted red (denials) to vivid green (approvals). The camera cuts rapidly between these elements, creating a rhythm of completion. It creates a visceral sense of getting things done.
Psychological Impact & KPI Focus
- Niche Psychology: The fast cuts and bright "action colors" stimulate excitement and urgency. It combats the "sluggishness" often associated with enterprise software. It tells the buyer, "We move as fast as you need to."
- Operational Impact: Targets Throughput, Productivity, and Automated Workflows. It visualizes the sheer volume of tasks the software can handle.
Strategic Implementation & Trade-offs
- Best Use Case: Skippable Pre-Roll Ads and Hype Reels for sales calls.
- Duration: 10-15 Seconds.
- Trade-off: Too fast for education. This is purely for impression—to leave the viewer with a feeling of speed and capability.
Companies using similar video content -
Availity – Automates and transforms complex payer/provider workflows.
NextGen Healthcare – Provides rule-based automation for ambulatory billing operations.
20. 2D Animation & UI Composition
BOFU | Objection Handling

The Visual & Narrative Approach
The final hurdle in any B2B healthcare deal is the IT department. Here, we see a stylized 2D character of a male IT manager, drawn in flat shapes with a pastel pink and navy blue palette. He is interacting with a floating, semi-transparent UI window that shows a compatibility checkmark. The composition is simple, balanced, and calm. It visualizes the "Compatibility Check," reassuring the technical stakeholder that the integration with their existing EHR will be seamless.
Psychological Impact & KPI Focus
- Niche Psychology: The visual language is low-stress. Soft gradients and simple shapes communicate that the implementation will not be a headache. It creates a "Safe Yes" for the IT decision-maker.
- Operational Impact: Focuses on Implementation Speed and EHR Compatibility. It answers the question, "Will this break my current system?" with a visual "No."
Strategic Implementation & Trade-offs
- Best Use Case: Technical documentation pages and "Integration" one-pagers.
- Duration: 15-20 Seconds (Looping).
- Trade-off: Not exciting enough for marketing hooks, but essential for the "Technical Validation" stage of the deal.
Companies using similar video content -
eClinicalWorks – Specializes in comprehensive EHR and practice management.
TruBridge – Facilitates clinical data exchange and interoperability.
21. Dark Mode UI Showcase
BOFU | Risk Mitigation
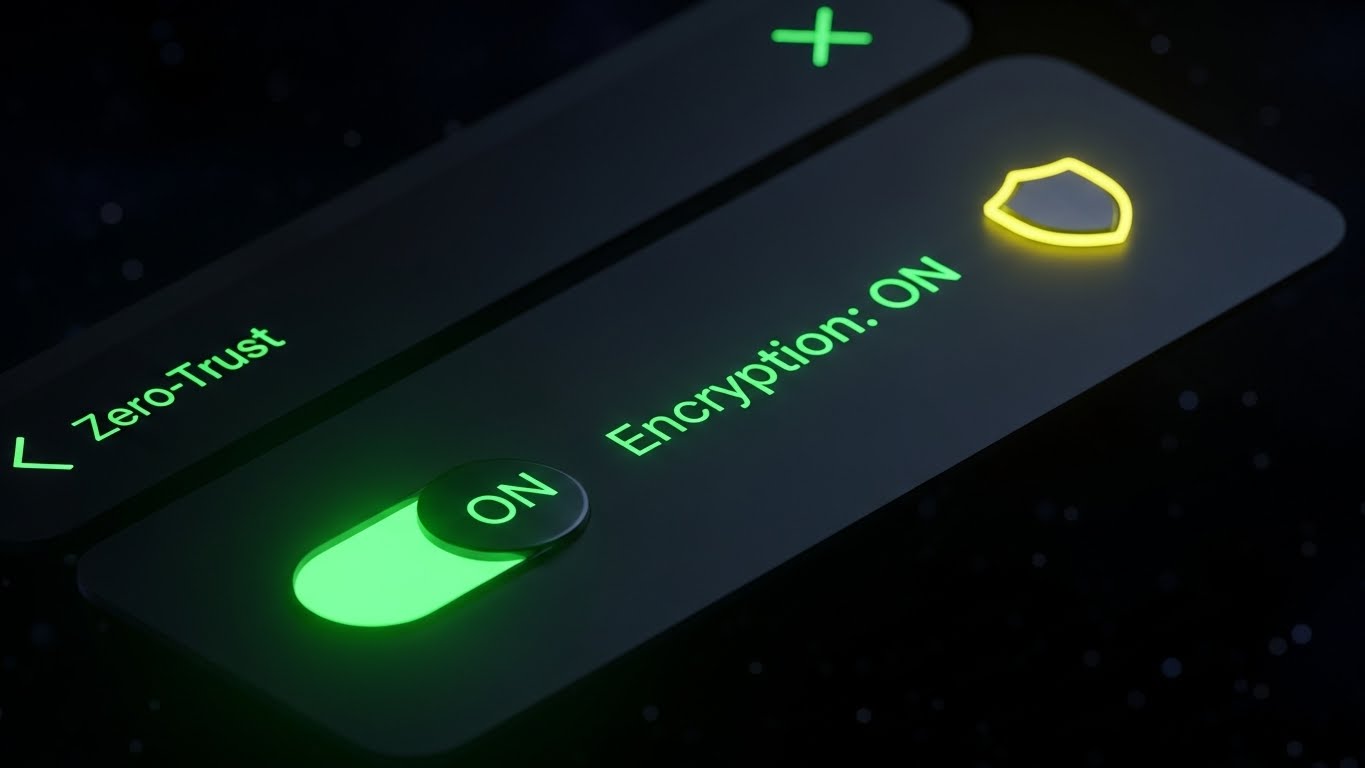
The Visual & Narrative Approach
We address the ultimate anxiety of the modern healthcare enterprise: Cyber Warfare. The visual shifts to a sleek, "Dark Mode" aesthetic—deep charcoal backgrounds where light represents data. Glowing neon green shield icons and padlock symbols pulse softly, signifying active protection. Crisp white lines define encryption tables. This is not just software; it is a secure vault. The aesthetic mirrors high-end cybersecurity tools, speaking directly to the CISO’s sensibilities.
Psychological Impact & KPI Focus
- Niche Psychology: Dark mode in B2B contexts signals developer-grade robustness. It visually separates the "security layer" from the "operational layer." For IT Directors, this visual language confirms that your platform operates on a Zero-Trust architecture, alleviating fears of ransomware attacks on patient data.
- Operational Impact: Highlights Data Security, SOC2 Compliance, and Encryption Standards. It validates the platform as a safe harbor for PHI (Protected Health Information).
Strategic Implementation & Trade-offs
- Best Use Case: "Security & Compliance" landing pages and Technical Due Diligence decks.
- Duration: 10-15 Seconds.
- Trade-off: The dark aesthetic can feel "intimidating" to non-technical operational staff. Use strictly for audiences concerned with risk and infrastructure.
Companies using similar video content -
ENTER – Secures revenue cycle with enterprise-grade encryption protocols.
Promantra – Safeguards patient data with advanced cybersecurity strategies.
22. Split Screen: Optimized Reality and UI
Onboarding | Self-Serve Onboarding

The Visual & Narrative Approach
This style bridges the physical gap between user intent and digital result. A split-screen composition divides the frame. On the left, bathed in warm, natural light, we see a close-up of a hand confidently clicking a mouse. On the right, a crisp, bright white UI screen instantly responds with a "Success" checkmark and a 100% progress bar. The synchronization is perfect. It visually proves the responsiveness of the system—action A leads immediately to Result B.
Psychological Impact & KPI Focus
- Niche Psychology: This builds efficacy. New users often fear that complex software will be unresponsive or laggy. By visually linking the physical hand to the digital result, we create a sense of tactile control. It promises a "1-to-1" relationship between effort and outcome.
- Operational Impact: Focuses on Time-to-Productivity and User Satisfaction. It visualizes the low latency and high responsiveness of the cloud platform.
Strategic Implementation & Trade-offs
- Best Use Case: Welcome Emails and "Getting Started" video guides.
- Duration: 10-15 Seconds.
- Trade-off: Requires high-quality footage to match the UI fidelity. Poor stock footage on the left will degrade the perceived quality of the software on the right.
Companies using similar video content -
pMD – Offers a user-friendly app that runs smoothly without hiccups.
DrChrono – Integrates scheduling, clinical workflows, and patient engagement.
23. Isometric 3D Workflow
Onboarding | Reducing Implementation Friction

The Visual & Narrative Approach
Implementation is often viewed as a "rip and replace" nightmare. We counter this with a playful, organized isometric diorama. We see a miniature, pristine server room and office space rendered in clean white, orange, and soft grey plastics. Tiny, stylized cables connect a "Server Block" to a "Desktop Computer" with a satisfying click. The lighting is soft and global, giving the scene a toy-like model quality. It reframes a complex HL7 integration as a simple "plug-and-play" construction kit.
Psychological Impact & KPI Focus
- Niche Psychology: The "Toy Model" effect reduces the perceived magnitude of the task. It makes the integration process look manageable, tidy, and architecturally sound. It tells the Implementation Manager, "This fits perfectly into your existing world."
- Operational Impact: Visualizes Seamless Integration and Modular Architecture. It addresses the fear of downtime during deployment.
Strategic Implementation & Trade-offs
- Best Use Case: Implementation Guides and "Technical Specs" web pages.
- Duration: 20-30 Seconds.
- Trade-off: The stylized look is metaphorical. Ensure you follow up with actual technical documentation to support the "simple" visual promise.
Companies using similar video content -
Intulogic – Innovates sustainable IT solutions and integrated platforms.
Vee Technologies – Provides advanced technology solutions for process optimization.
24. 3D Parallax UI Presentation
Onboarding | Accelerating Time-to-Value
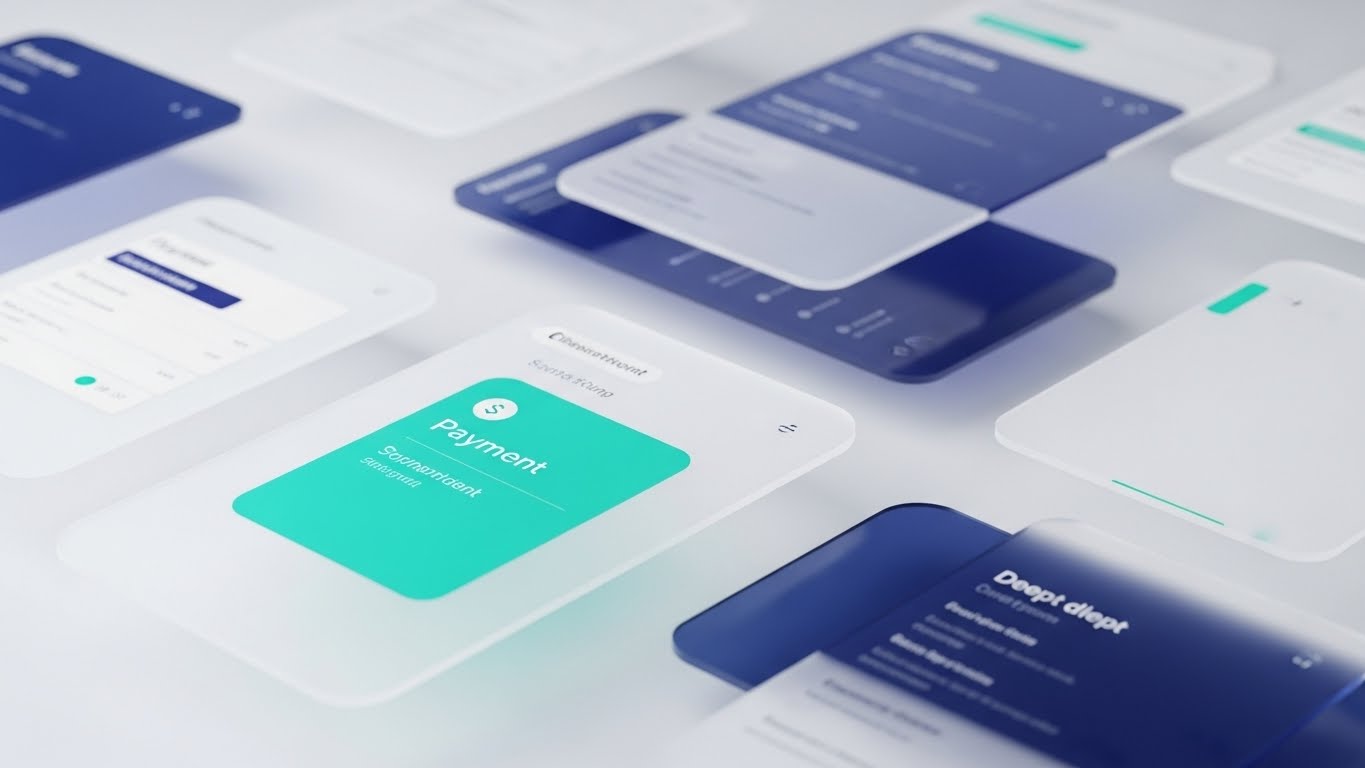
The Visual & Narrative Approach
We explore the depth of the platform. Multiple UI screens float in a 3D space, tilted at dynamic angles. The front-most screen is in sharp focus, highlighting a "Payment Received" notification in bright teal. The background screens are slightly blurred, suggesting layers of historical data and analytics working behind the scenes. This parallax effect creates a sense of immersion, implying that the software is not flat—it is a deep, multi-dimensional workspace.
Psychological Impact & KPI Focus
- Niche Psychology: Depth implies substance. This visual style tells the user that while the interface is simple (front screen), the engine is powerful (background layers). It validates the complexity of their work while presenting a simplified front-end.
- Operational Impact: Targets Data Depth and Reporting Granularity. It visually represents the ability to drill down from a high-level summary to line-item details.
Strategic Implementation & Trade-offs
- Best Use Case: Feature Highlight videos on LinkedIn and in-app "What's New" modals.
- Duration: 15-20 Seconds.
- Trade-off: Highly stylized. Avoid using this for tutorials where text legibility is critical; use it to sell the concept of the feature.
Companies using similar video content -
RevSpring – Uses intelligence and analytics for connected patient experience.
MD Clarity – Provides insights into revenue cycle performance with analytics.
25. 2D Graphics Over Live Action
Retention | Knowledge Base & FAQ

The Visual & Narrative Approach
We humanize technical support. A high-quality photo of a professional woman in a sunlit office captures her looking upward with a thoughtful smile. Overlaid around her head are clean, flat vector icons in orange and grey—lightbulbs, chat bubbles, and document symbols. These icons track her movement slightly, integrating with the scene. This isn't about software screens; it's about the feeling of having an answer. It visualizes the "lightbulb moment" that your Knowledge Base provides.
Psychological Impact & KPI Focus
- Niche Psychology: Support is emotional. Users resort to the Knowledge Base when they are frustrated. This visual projects calm and resolution. It reassures the user that answers are accessible, friendly, and human-centric, not buried in technical jargon.
- Operational Impact: Focuses on Self-Service Resolution Rate and Reduced Support Ticket Volume. It promotes the help center as a resource for empowerment.
Strategic Implementation & Trade-offs
- Best Use Case: Help Center headers and "Support" portal thumbnails.
- Duration: Static Image or 5-Second Looping Video.
- Trade-off: Requires casting that matches your diverse user base. Avoid "cheesy" stock smiles; aim for "relief" and "understanding."
Companies using similar video content -
Weave – Offers patient communication and engagement platform.
Doctible – Manages patient communication and online reputation.
26. Macro UI Micro-Interactions
Retention | Reducing Churn
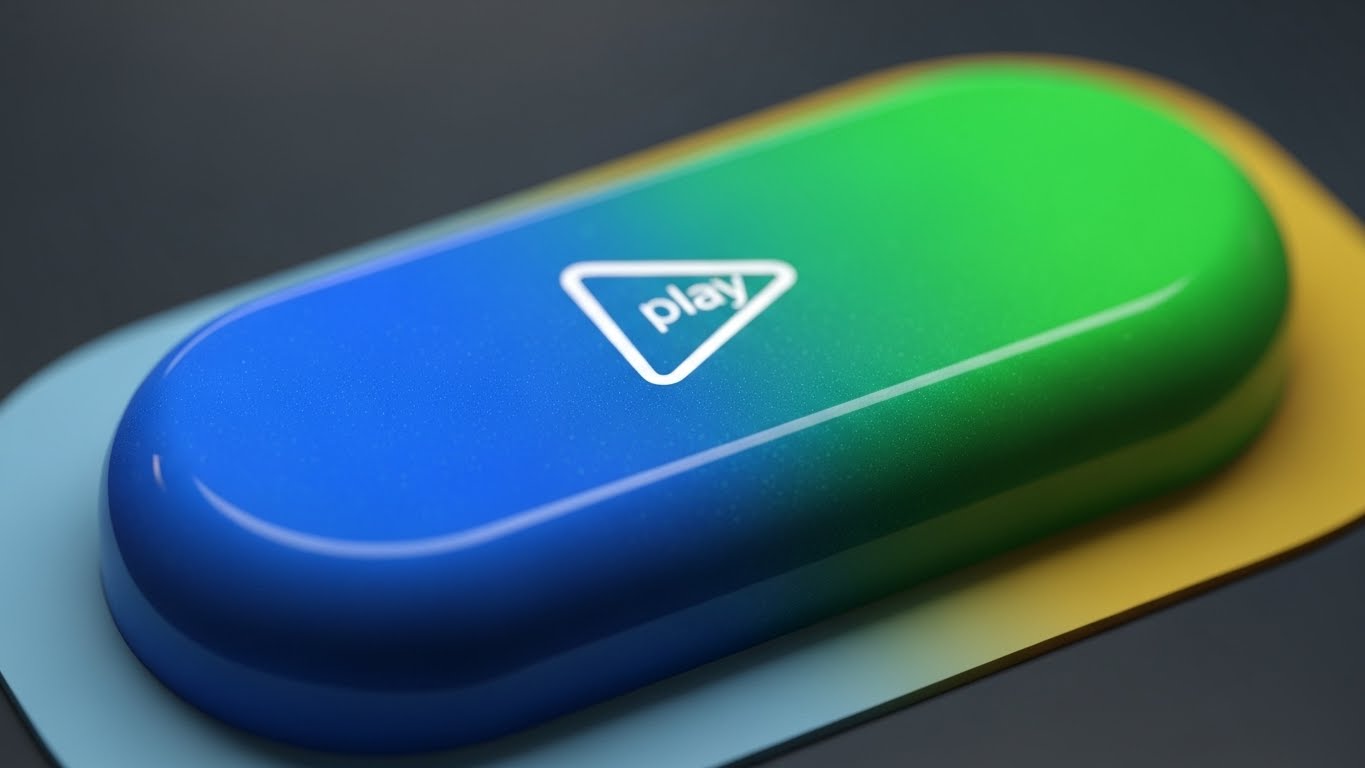
The Visual & Narrative Approach
We zoom in—extreme close-up. A "Play" or "Submit" button is rendered with macro photography detail. We see the subtle gradient of the blue-to-green pill shape and the soft diffusion of light on its surface. When "clicked," the button depresses with a satisfying weight. This style fetishizes the quality of the interface. It subliminally argues that if the buttons are designed with this much care, the backend code must be equally flawless.
Psychological Impact & KPI Focus
- Niche Psychology: Quality is fractal. In a market of clunky, legacy healthcare software, high-fidelity UI design signals respect for the user. It builds unconscious loyalty by making the daily tools feel premium and satisfying to touch.
- Operational Impact: Targets NPS (Net Promoter Score) and User Engagement. It elevates the mundane task of claim submission into a satisfying interaction.
Strategic Implementation & Trade-offs
- Best Use Case: Email newsletters announcing UI updates/polishes.
- Duration: 3-5 Seconds (Looping GIF).
- Trade-off: This is purely aesthetic. It builds brand affinity but explains nothing about function. Use it to signal "Modernity."
Companies using similar video content -
Tebra – Streamlines operations with an intuitive and modern UI.
Jane – Manages appointments, patient records, and billing for health.
27. Generative AI Realistic Character video
Expansion | Driving Deep Feature Adoption

The Visual & Narrative Approach
To sell advanced features, we show the advanced user. An over-the-shoulder shot focuses on a male billing specialist in a high-end, glass-walled corporate office. He is intensely focused on a curved monitor displaying complex predictive analytics charts. The lighting is cinematic. This is not entry-level data entry; this is high-level Revenue Cycle strategy. The realism grounds the aspiration: "This could be your team."
Psychological Impact & KPI Focus
- Niche Psychology: This appeals to the career aspirations of RCM staff. It elevates them from "billers" to "analysts." By showing a sophisticated environment and complex tools, you encourage the adoption of higher-tier features (Expansion) that drive this transformation.
- Operational Impact: Focuses on Feature Adoption and Strategic Value. It positions the software as a tool for career growth and organizational maturity.
Strategic Implementation & Trade-offs
- Best Use Case: In-App Learning Management Systems (LMS) and Upsell webinars.
- Duration: 30-60 Seconds.
- Trade-off: High production cost (or AI generation effort) to maintain photorealism. Ensure the screen content in the video is accurate to the advanced feature being sold.
Companies using similar video content -
CombineHealth – Solves revenue cycle challenges with AI and automation.
Thoughtful – Delivers measurable financial results across every workflow.
28. Hyper-lapse Stock Footage with Data
Expansion | Driving Upsell/Cross-sell

The Visual & Narrative Approach
Healthcare finance never sleeps. We see a hyper-lapse of a busy city street at twilight—streaks of car lights blur in organic motion. Overlaid on this chaotic reality are sharp, static digital data lines and floating currency symbols ($, €, £) in bright white and gold. The contrast is the message: while the physical world rushes by, your platform provides a stable, constant financial structure that captures value from the chaos.
Psychological Impact & KPI Focus
- Niche Psychology: This visualizes scale. It implies that the software is not just for one hospital, but for the entire health system or network. It appeals to the Enterprise buyer looking to expand the solution across multiple locations or regions.
- Operational Impact: Targets Enterprise Scalability and 24/7 Processing. It reinforces the value of background automation that works while the world moves.
Strategic Implementation & Trade-offs
- Best Use Case: LinkedIn Video Ads targeting "Enterprise" segments.
- Duration: 10-15 Seconds.
- Trade-off: It is atmospheric. Use it to create a "Big Tech" feeling during contract renewal or expansion discussions.
Companies using similar video content -
Optum – Operates globally, connecting all aspects of healthcare.
Availity – Provides nationwide healthcare connectivity and robust resources.
29. Lifestyle Stock with UI Overlay
Expansion | Proactive Support/Announcements

The Visual & Narrative Approach
The ultimate benefit of SaaS is freedom. We see a candid shot of a professional sitting in a sunlit cafe, holding a tablet. They look relaxed, perhaps smiling at a friend. Floating just above the tablet is a subtle, semi-transparent UI hologram showing a green "System Healthy" checkmark. This image sells the absence of work. It tells the RCM Director that because the software is handling the denials, they can actually take a lunch break.
Psychological Impact & KPI Focus
- Niche Psychology: This targets the work-life balance desires of the user. Burnout is high in RCM; this visual offers the emotional benefit of "Peace of Mind." It connects the software's reliability directly to the user's work-life balance.
- Operational Impact: Highlights Mobile Access and Automated Monitoring. It validates the promise of "Management by Exception."
Strategic Implementation & Trade-offs
- Best Use Case: Email Footers, Newsletters, and "Holiday" client communications.
- Duration: Static Image.
- Trade-off: Must be carefully staged to not look like the user is "slacking off." The focus is on remote control, not negligence.
Companies using similar video content -
Carepatron – Offers practice management for remote access and peace of mind.
Emitrr – Enhances patient engagement and communication with mobile apps.
30. Aspirational Stock Montage
Expansion | Driving Referrals & Advocacy

The Visual & Narrative Approach
We conclude with the human result of financial health: a happy team. A diverse team of healthcare administrators and clinicians stands in a bright, modern conference room, high-fiving and laughing. A whiteboard in the background hints at "Goals Achieved." This is the "Winner's Circle." It moves beyond the software interface to show the cultural impact of efficiency—less burnout, more success, and a cohesive team.
Psychological Impact & KPI Focus
- Niche Psychology: Success is social. This style triggers the desire for recognition and belonging. It encourages happy clients to become advocates because it frames their success as a shared team victory, facilitated by your platform.
- Operational Impact: Targets Customer Advocacy, Referrals, and Organizational Alignment. It sells the "Culture of Success."
Strategic Implementation & Trade-offs
- Best Use Case: Case Study "Hero Images" and Referral Program landing pages.
- Duration: Static Image or Slow-Motion Video.
- Trade-off: Generic if not paired with a specific success story. Use this visual to anchor a testimonial from a real client.
The Advids Strategic Knowledge Base: The Visual Operations Doctrine
We have explored 30 distinct visual styles, but style without strategy is merely decoration. For a Healthcare RCM SaaS platform, visualization is not just a marketing tactic; it is an operational asset. It reduces the cognitive load of complex coding, builds trust in invisible algorithms, and accelerates the adoption of critical workflows.
The following framework synthesizes these styles into a "Visual Operations Doctrine"—a guide to implementing these assets to drive tangible business outcomes.
STRATEGIC ALIGNMENT & VISUAL ARCHITECTURE
The "Pre-Production" Strategy. Why visuals matter in RCM.
- The Cognitive Load Audit: Healthcare staff are overwhelmed. Before creating a single video, audit your current training materials. If a billing protocol takes 500 words to explain, it is a candidate for Style 16 (Clean UI Workflow). Visuals should be deployed specifically where text fails.
- Role-Based Visual Mapping: Differentiate your visual language. Use Style 5 (Isometric Mobile) for physicians who need quick charge capture on rounds, but reserve Style 7 (Dynamic Data Vis) for RCM Directors who need deep-dive analytics at their desks.
- The "Glanceability" Standard: In a busy hospital, attention is scarce. Design your notification visuals (Style 19) so that a user can understand the status (Paid/Denied) in under 0.5 seconds, similar to clinical traffic light systems.
- Brand Voice Consistency: Your marketing visuals (Style 1) and your in-app product visuals (Style 16) must share the same DNA. A jarring transition from a "Sleek Marketing Demo" to a "Clunky Product UI" destroys trust.
- The Advids Strategic Audit: Partner with Advids to define this "Visual Operating System" before production begins. A strategic audit ensures that your library of assets scales coherently rather than becoming a disjointed collection of videos.
- Standardization vs. Customization: For general payer rules (Medicare), use high-quality stock-based visualizations (Style 14). For your proprietary AI features, invest in bespoke 3D motion graphics (Style 12) to own the IP.
- The Cross-Departmental Bridge: Use visuals to unify terminology. A "Claim" to a clinician might mean something different than to a coder. Use Style 11 (Line Art) to create a shared visual dictionary that unifies Sales, Ops, and Clinical teams.
- Legacy System Integration: Don't hide the old world. Use Style 9 (Wireframe to Reality) to explicitly visualize how your modern SaaS wraps around and protects their legacy on-premise servers, respecting their existing investment.
- Accessibility in Healthcare Administration: Ensure all motion graphics are accessible. RCM teams are diverse. Use high-contrast modes (Style 21) and clear typography to support users with varying visual abilities.
- The Mobile-First Mandate: Even if your core user is on a desktop, your buyer (the CFO) is on a phone. Ensure all 30 styles are optimized for vertical viewing to capture the decision-maker during their commute.
OPERATIONAL ADOPTION & IMPLEMENTATION
The "Deployment" Phase. Embedding visuals into the workflow.
- Overcoming "Big Brother" Anxiety: When introducing productivity tracking, use Style 3 (Abstract Organic) to frame it as "Workflow Optimization" rather than "Employee Surveillance." Soft visuals reduce resistance to AI oversight.
- The Micro-Learning Shift: Replace the 200-page implementation PDF with a library of 30-second Clean UI Workflow (Style 16) clips. Embed these directly into the software dashboard for "in the flow of work" learning.
- Just-in-Time Support: Embed Style 25 (Live Action + Icons) directly into the helpdesk widget. When a user hovers over "Denial Appeal," a 15-second video should float up to guide them, reducing frustration.
- Gamification of Training: Use Style 2 (Kinetic Typography) to visualize team goals. Show "Claims Processed" as a cascading high-score list to inject energy and friendly competition into the billing office.
- Reducing Support Ticket Volume: There is a direct correlation between proactive visual guides and reduced call center load. If you visualize the "Password Reset" flow (Style 16), you eliminate 20% of your tickets instantly.
- Remote Onboarding: With remote revenue cycle teams becoming the norm, use Style 22 (Split Screen) to simulate the feeling of a trainer sitting next to the new hire, showing them exactly where to click.
- Standard Operating Procedures (SOPs): Transform text-based SOPs into Linear 2D Animation (Style 11). Visual flows are retained 60% better than text lists, reducing compliance errors in claims processing.
- Feedback Loops: Use interactive video elements. After a Style 23 (Isometric) training module, prompt the user to click the "Correct Server" to verify understanding before moving on.
- Scalable Localization: If you serve global markets or multi-lingual staff, use Style 1 (Minimalist Vector). Symbols and icons transcend language barriers, reducing the cost of translating voiceovers.
- Leadership Communication: When the VP of Finance presents to the Board, give them Style 6 (Cinematic AI) assets. Empower your champion with high-end visuals that make them look visionary, securing their loyalty.
MEASURING IMPACT & FUTURE-PROOFING
The "ROI" Phase. Measuring success and looking ahead.
- Beyond "Views": Do not measure video success by "Views." Measure it by "Time-to-Competency." How much faster does a new user process their first batch after watching the Style 22 onboarding video?
- The "Idle Time" Metric: Correlate better visualization with reduced software navigation time. If users spend less time staring at the screen confused, your "Revenue per Hour" metrics improve.
- Compliance Velocity: When new regulations (like the No Surprises Act) drop, measure how fast the team adapts. A Style 13 (Mixed Media) video explaining the change is digested 10x faster than a legal memo.
- Retention and Churn: High-quality UX visualization (Style 26) increases perceived value. Track the correlation between users who engage with the video knowledge base and their long-term retention rates (LTV).
- The AI Visual Frontier: Prepare for the future where the dashboard generates the video. Imagine an AI that creates a custom Style 7 (Data Vis) video summary of the CFO's weekly report automatically.
- Scalability of Assets: Build a library, not a pile. Tag every asset by Style ID (1-30). This allows you to quickly assemble a new campaign by querying "Style 8 + Cyber Security" from your database.
- The Advids Partnership: Visual strategy is not a one-time project; it is an evolving discipline. Partner with Advids to maintain this library, ensuring that as your software features evolve, your visual language evolves with it.
- Benchmarking Success: "Good enough" visuals are a competitive risk. If your competitor uses Style 18 (Photorealistic 3D) to sell financial value and you use flat screenshots, you lose the perceived value battle before the demo starts.
- The ROI of Safety: In healthcare, a mistake is not just a lost dollar; it's a compliance risk. Quantify the reduction in HIPAA violations after deploying Style 21 (Dark Mode Security) training videos.
- Final Call to Innovation: Treat video as infrastructure. It is the fiber optic cable that carries understanding through your organization. Invest in it with the same rigor you invest in your code, and it will yield returns for years to come.
Companies using similar video content -
VBRCM – Brings stability and empathy to RCM for organizational growth.
RCM Matter – Combines expert services with technology to enhance claim accuracy.
Author & Editor Bio


