
 /home/wwwroot/advids.co/design/index.php on line 425
Introduction
The modern hotel is a paradox: it is a physical asset of bricks and mortar, rooted in one location, yet its financial success is determined by a digital marketplace that fluctuates milliseconds at a time. For the Revenue Manager, the challenge is no longer just gathering data—it is surviving it. You are tasked with navigating a daily deluge of pace reports, competitive rate shopping, and demand signals, all while trying to maintain rate parity and optimize your distribution mix.
In this high-pressure environment, the "Black Box" problem is real. Hoteliers are asked to trust algorithms they cannot see, often leading to "paralysis by analysis" and a retreat to manual spreadsheets. Visualization is the bridge. It transforms abstract regression models into tangible, intuitive logic. When a stakeholder can see the flow of demand and the accumulation of yield, hesitation disappears, and strategic adoption begins.
The opportunity for those who bridge this gap is measurable. Industry data indicates that hotels leveraging automated revenue management systems typically realize a 10-25% revenue growth compared to manual peers. But the impact is not just financial; it is operational. By visualizing and automating complex workflows, these platforms can save 10 hours per week of manual data entry, freeing your team to focus on strategy rather than spreadsheets.
This guide presents a curated selection of visual styles designed to bridge the physical/digital divide. From the abstract fluidity of market demand to the razor-sharp clarity of UI dashboards, these examples demonstrate how to communicate value, build trust, and drive adoption in the competitive hospitality technology landscape.
2. Visualizing Market Fluidity
TOFU | Market Education

The Visual & Narrative Approach
Scenario: Imagine a bird’s-eye view of a stylized hotel floor plan. Instead of static guest numbers, we see market demand visualized as living, flowing rivers of coral pink and soft teal. These streams navigate through the rigid geometric blocks of the rooms, thickening during "peak" dates and thinning during "shoulder" periods.
Narration: The tone is calm and educational. It frames static pricing as a "dam" that blocks revenue, while dynamic pricing is the "sluice gate" that intelligently manages the flow.
Psychological Impact & KPI Focus
- Niche Psychology: This style reduces the cognitive load of understanding "Elasticity." By visualizing demand as a liquid, it intuitively explains how the software fills the "container" (the hotel) to maximum capacity without spilling over (overbooking).
- Operational Impact: It addresses the KPI of Occupancy Optimization. It visually validates the concept that demand is not a fixed number, but a fluid force that must be captured in real-time.
Strategic Implementation & Trade-offs
- Best Use Case: Homepage hero videos or "Concept" explainer sections. It is perfect for convincing non-technical Owners that dynamic pricing is a natural, fluid process.
- Trade-offs: It is highly abstract. It sells the philosophy of yield management effectively but does not show the reality of the software interface.
- Duration: 60-90 seconds.
Companies using similar video content -
IDeaS – G3 RMS – Visualizes demand flow for dynamic pricing.
FLYR Hospitality – AI-powered decision intelligence – Abstracting complex market dynamics.
3. Emphasizing Strategic Weight
TOFU | Shaping Brand Perception

The Visual & Narrative Approach
Scenario: The screen is a digital void where massive, 3D extruded words like "RATE," "YIELD," and "PACE" float with physical weight. They collide and fuse, accompanied by a bass-heavy sound design. The camera flies dynamically through the negative space of the letters, emphasizing the sheer scale of the decisions being made.
Narration: No voiceover. The rhythm is driven entirely by the kinetic energy of the text and the music, conveying a sense of high-frequency trading power.
Psychological Impact & KPI Focus
- Niche Psychology: This style appeals to the "Wolf of Wall Street" aspiration within revenue teams—the desire to be powerful, decisive, and fast. It frames pricing not as a chore, but as a high-impact strategic weapon.
- Operational Impact: It emphasizes Speed of Execution. In a market where competitors change rates 10 times a day, this style positions your platform as the heavy-hitter that moves faster than the rest.
Strategic Implementation & Trade-offs
- Best Use Case: 15-second social media teasers (Instagram Reels, LinkedIn Shorts) designed to stop the scroll and build brand authority.
- Trade-offs: It offers zero educational value. It creates hype and brand recall but explains nothing about the software's utility.
- Duration: 15-30 seconds.
Companies using similar video content -
Duetto – GameChanger – Emphasizes strategic pricing and market impact.
Lighthouse – Commercial Platform – Highlights powerful market insights.
4. Gamifying Revenue Accumulation
TOFU | ABM Awareness
The Visual & Narrative Approach
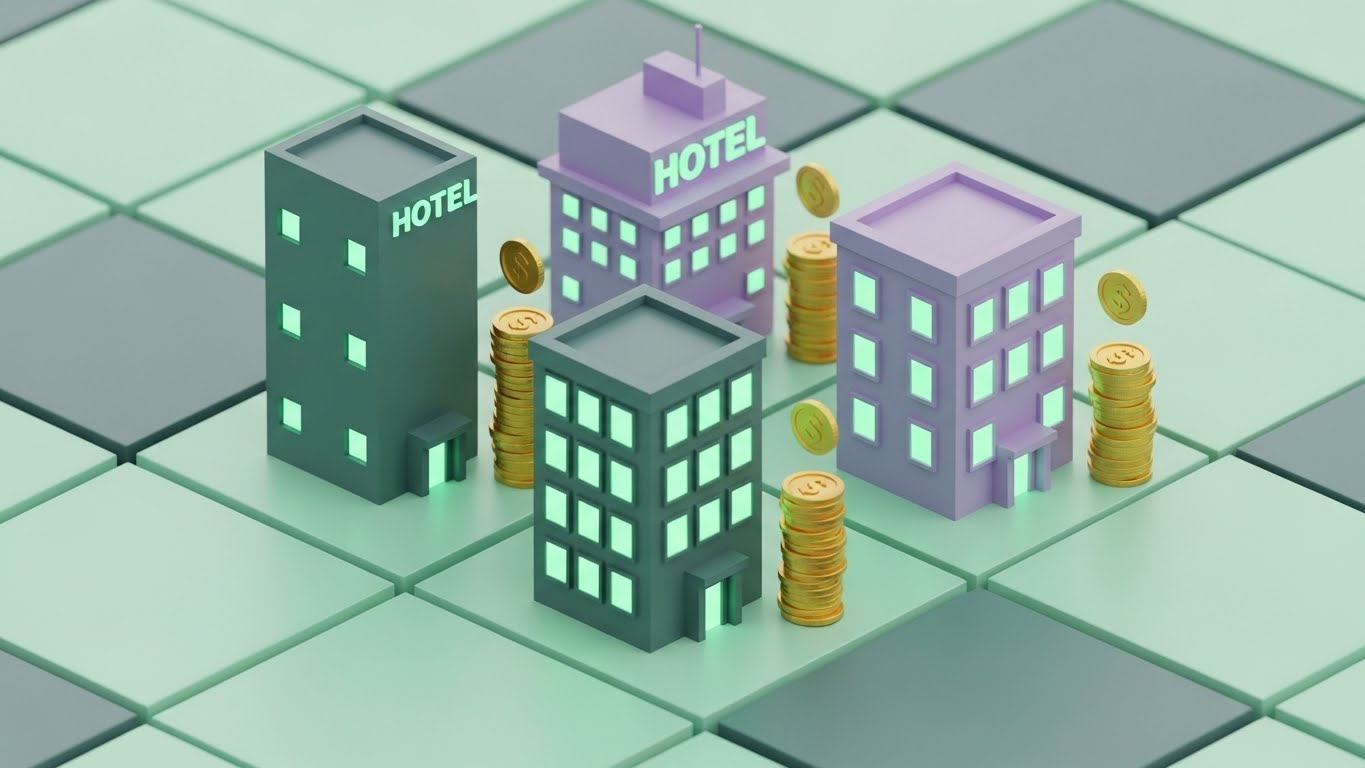
Scenario: A miniature, digital "Sim City" hotel sits on a clean pastel grid (mint and lavender). As windows in the building light up (indicating occupancy), small gold coins stack up automatically beside the structure. The animation loops satisfyingly, creating a direct visual link between "lights on" and "money made."
Narration: The voiceover is light, optimistic, and reassuring, focusing on the concept of "passive revenue generation" and "automated growth."
Psychological Impact & KPI Focus
- Niche Psychology: This style leverages Gamification. It transforms the stressful, complex task of revenue management into a satisfying, orderly game where the player (the manager) always wins.
- Operational Impact: It focuses on RevPAR Accumulation. It visually proves that small, automated adjustments (the lights) lead to significant aggregate gains (the coins).
Strategic Implementation & Trade-offs
- Best Use Case: LinkedIn carousel ads or background loops for webinar waiting screens. It works well to target Asset Managers who care about the "big picture" financial health.
- Trade-offs: The "toy-like" aesthetic may feel too playful for ultra-luxury enterprise clients who expect a more "corporate" data presentation.
- Duration: 30-45 seconds.
Companies using similar video content -
Pricepoint – AI-powered price optimization – Visually represents revenue accumulation.
RoomPriceGenie – Dynamic pricing solution – Shows automated revenue growth.
6. Defining Booking Windows
TOFU | Skippable Pre-Roll Ad
The Visual & Narrative Approach
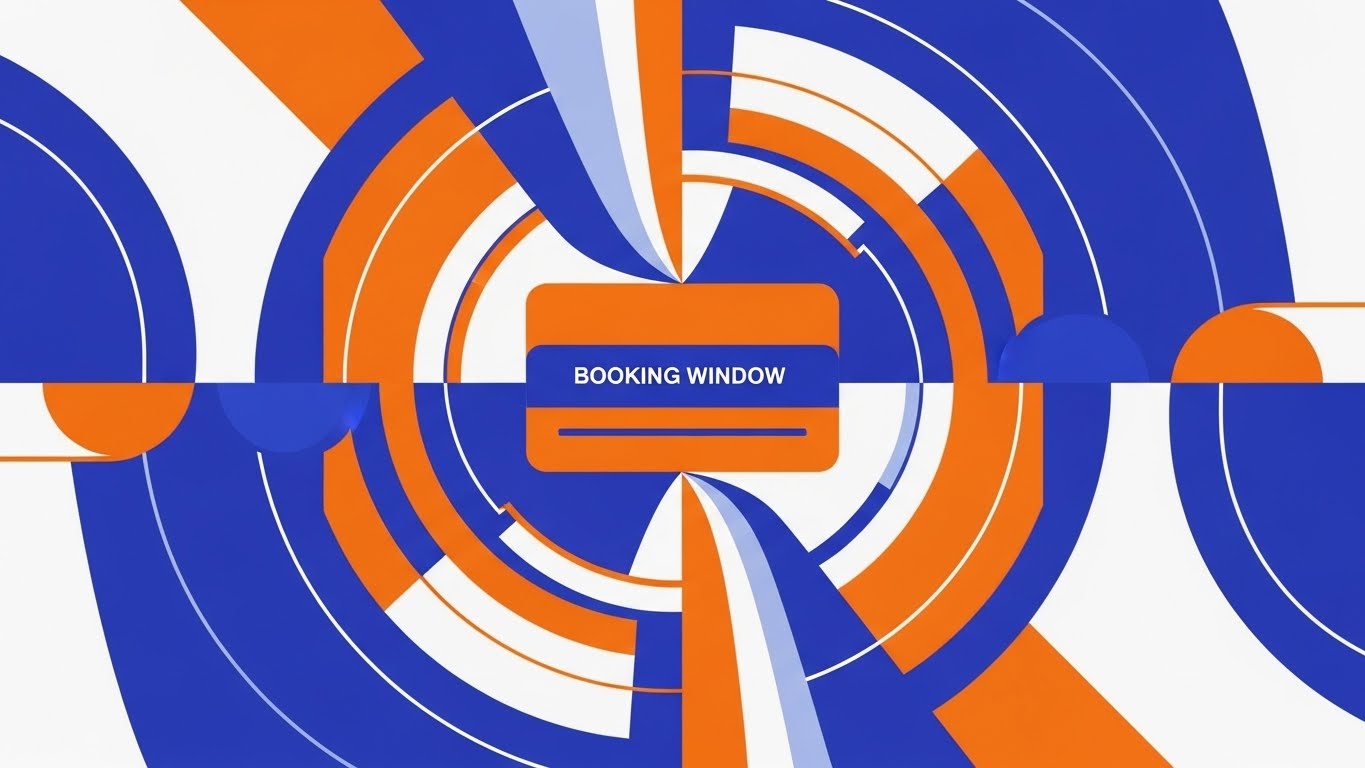
Scenario: Drawing from Bauhaus geometry, this style uses a flat, symmetrical kaleidoscope of vivid orange and royal blue. Patterns shift and rotate to form the abstract shape of a hotel keycard. Rotating concentric circles around the center represent the cyclical nature of the "Booking Window."
Narration: Fast, precise, and rhythmic. It emphasizes "Timing," "Cycles," and "Precision."
Psychological Impact & KPI Focus
- Niche Psychology: Revenue managers are obsessed with timing—knowing when to hold rate and when to fold. This style visually represents that temporal precision, satisfying the need for order in a chaotic timeline.
- Operational Impact: It highlights the Booking Window and Pace. It visually argues that your software understands the cyclical nature of travel demand patterns.
Strategic Implementation & Trade-offs
- Best Use Case: YouTube Pre-roll ads (first 5 seconds are crucial). The bright colors and constant motion prevent the viewer from looking away before the "Skip" button appears.
- Trade-offs: Can be visually overwhelming if the text overlays are too dense. Requires very punchy, short copy to be effective.
- Duration: 15-30 seconds.
Companies using similar video content -
RevControl – Smart automation for rates – Visualizes cyclical demand patterns.
RateBoard – Revenue Management System – Illustrates booking window precision.
7. Humanizing Data Control
TOFU | Aspiration & Identity Hook

The Visual & Narrative Approach
Scenario: Shifting focus to the user, we see a confident hotel manager in a sun-drenched luxury lobby ("Golden Hour" lighting). She holds a tablet, smiling at a rising line graph. The background is blurred marble columns, suggesting a premium environment.
Narration: Empathetic and empowering. "You are the strategist. Let us handle the math."
Psychological Impact & KPI Focus
- Niche Psychology: This addresses the "burned out" persona of the revenue manager stuck in the basement with Excel. It sells a lifestyle of mobility, control, and recognition.
- Operational Impact: The tablet implies Cloud-Based Accessibility. It demonstrates that critical KPI monitoring can happen anywhere, not just at a desk.
Strategic Implementation & Trade-offs
- Best Use Case: Instagram Stories or Facebook Ads targeting the personal aspirations of hospitality professionals.
- Trade-offs: It relies heavily on the quality of the "screen replacement" VFX. If the graph on the tablet looks fake, the trust is broken.
- Duration: 15-30 seconds.
Companies using similar video content -
Canary – Guest Management System – Empowers hotel managers with mobile control.
Stayntouch – Cloud PMS – Offers mobile-first approach to hotel operations.
8. Reducing Cognitive Load
MOFU | Product Differentiation
The Visual & Narrative Approach
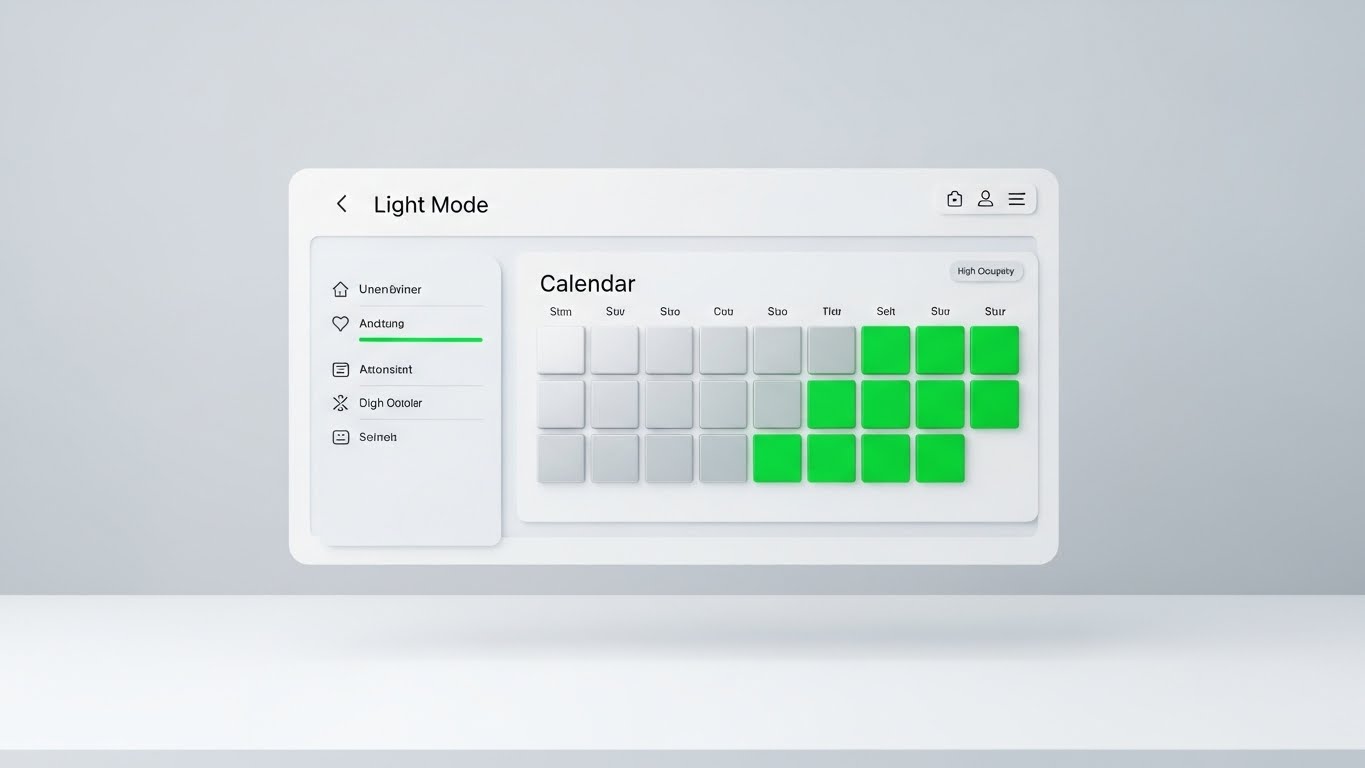
Scenario: A pristine, high-fidelity 3D rendering of the actual UI dashboard floats on a pure white desk. The "Calendar" grid features blocks turning from light silver to kelly green, indicating high occupancy. The design is clean, with subtle drop shadows.
Narration: Professional and instructional. "Clarity at a glance. Decisions in seconds."
Psychological Impact & KPI Focus
- Niche Psychology: Targets the fear of "Clunky Legacy Software." Hoteliers are traumatized by 1990s-era interfaces. This style reassures them that the tool is modern, frictionless, and easy to learn.
- Operational Impact: Demonstrates Ease of Use and Workflow Efficiency. It visually proves that complex inventory data can be digested instantly.
Strategic Implementation & Trade-offs
- Best Use Case: "Features" page on the website or product walkthrough videos. It works best for audiences who are already interested and want to "see the product."
- Trade-offs: It lacks emotional hook; it is purely functional.
- Duration: 60-120 seconds.
Companies using similar video content -
Cloudbeds – Revenue Intelligence – Provides clean UI for instant data digestion.
Smartpricing – AI-powered dynamic pricing – Simplifies complex pricing decisions.
9. Accelerating Automation Speed
MOFU | Feature Education
The Visual & Narrative Approach
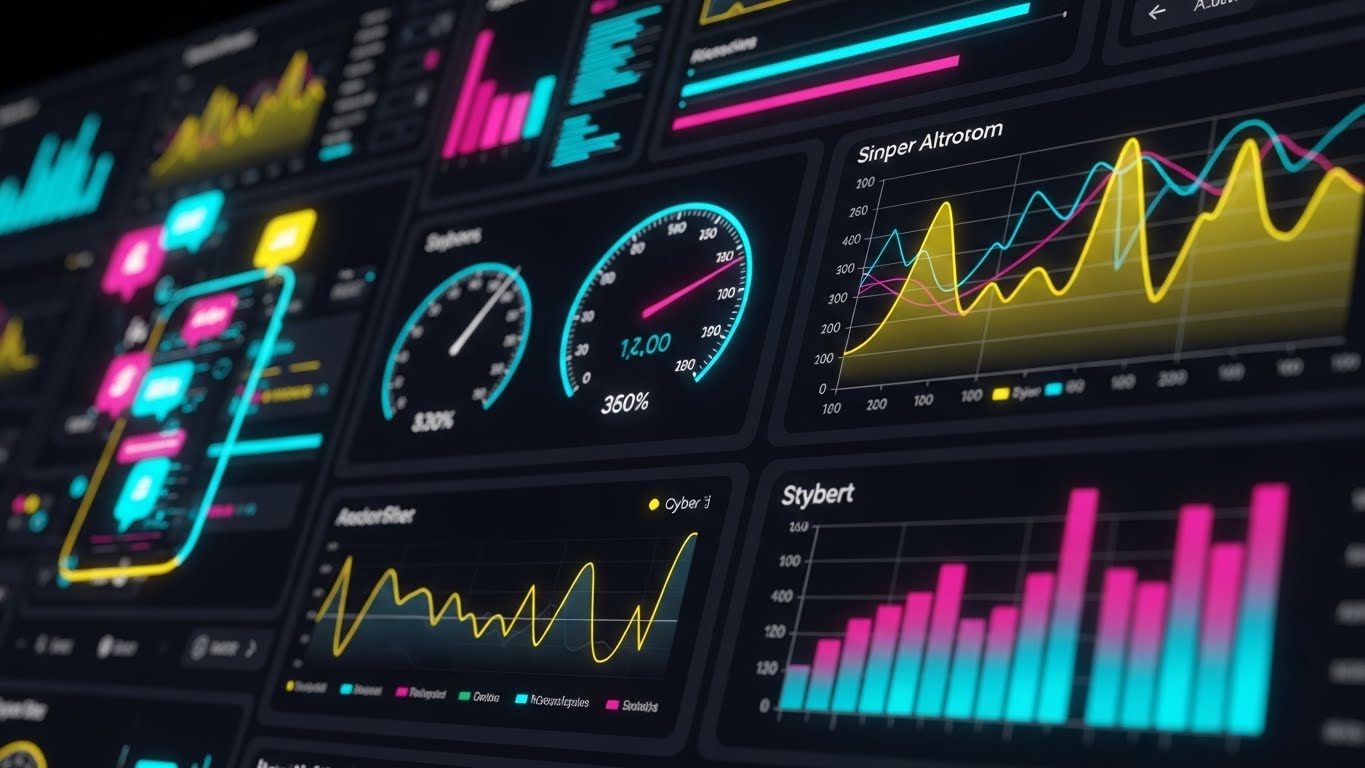
Scenario: A high-energy motion graphics montage using "glitch art" transitions and a cyber-yellow/magenta palette. Abstract notification bubbles pop up, and charts zoom in rapidly. The energy is frantic but controlled.
Narration: Dynamic and tech-forward. "Built for the speed of the modern market."
Psychological Impact & KPI Focus
- Niche Psychology: Appeals to the analytical/technical side of the Revenue Manager. It suggests that the software is robust enough to handle "Big Data" without crashing.
- Operational Impact: Highlights Real-Time Data Processing. It visualizes the statistic that the system updates rates 24/7/365 to capture every opportunity.
Strategic Implementation & Trade-offs
- Best Use Case: Product launch trailers or technical deep-dive intros on YouTube.
- Trade-offs: Can be intimidating to non-technical users who might perceive it as "too complex" to manage.
- Duration: 45-60 seconds.
Companies using similar video content -
Turbosuite – Next-gen RMS – Highlights rapid data processing and automation.
Shiji Group – Shiji Enterprise Platform – Emphasizes real-time data updates.
10. Clarifying Competitive Advantage
MOFU | Competitive Displacement
The Visual & Narrative Approach
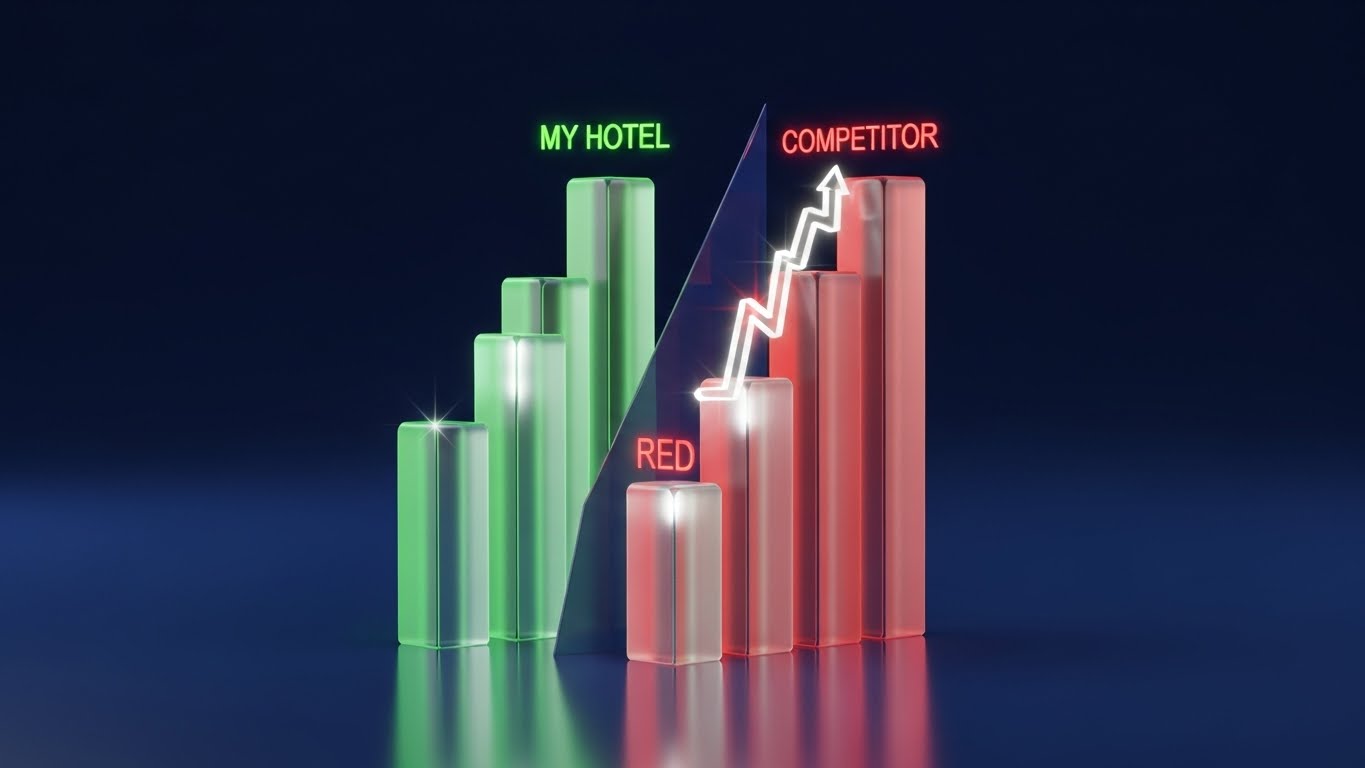
Scenario: A conceptual data visualization using glassmorphism. A "Green" 3D bar (My Hotel) races upwards, overtaking a "Red" bar (Competitor). The bars are made of frosted glass with internal glowing light.
Narration: Competitive and assertive. "Don't just compete. Dominate."
Psychological Impact & KPI Focus
- Niche Psychology: Taps into the competitive nature of the industry. Every revenue manager wants to be #1 in their CompSet. This visual confirms that the software provides the "unfair advantage."
- Operational Impact: Focuses on RGI (Revenue Generation Index) and Market Share. It visualizes the result of the strategy: outperforming the local competition.
Strategic Implementation & Trade-offs
- Best Use Case: Retargeting ads on LinkedIn for users who have visited pricing pages but haven't converted.
- Trade-offs: It is aggressive. The focus should remain on your growth (Green) rather than the competitor's failure.
- Duration: 15-30 seconds.
Companies using similar video content -
RateGain – Market Intelligence Platform – Visualizes competitive outperformance.
Lighthouse – Rate Insight – Shows clear competitive positioning.
11. Humanizing the Workflow
MOFU | Driving Demo Requests
The Visual & Narrative Approach
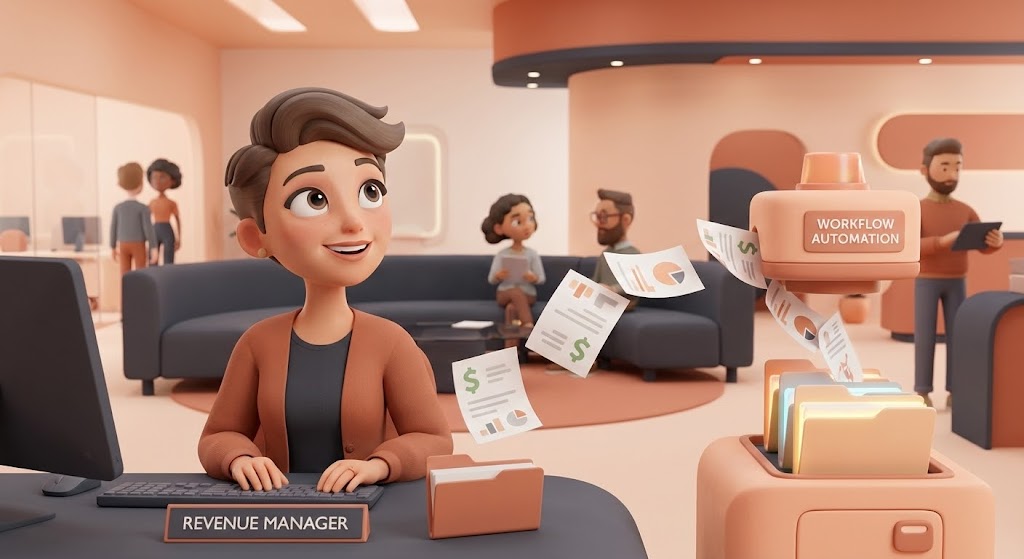
Scenario: We enter a stylized, inviting office space rendered in soft peach and clay tones. A friendly, Pixar-esque Revenue Manager sits at her desk, smiling as stacks of paperwork magically lift off the surface. These papers flow effortlessly into a whimsical, soft-edged "digital sorting machine" that processes them into neat, organized files.
Narration: Warm and relatable. "Rediscover the joy of hospitality. Let the machine handle the monotony."
Psychological Impact & KPI Focus
- Niche Psychology: This style directly targets Burnout. Revenue managers often feel like data-entry clerks rather than strategists. By using a "magical" character-driven aesthetic, we acknowledge their pain and offer a delightful escape.
- Operational Impact: Visualizes Workflow Automation. It simplifies the technical concept of data ingestion into a friendly, frictionless process, promising time savings.
Strategic Implementation & Trade-offs
- Best Use Case: Email nurture campaigns targeted at users who have downloaded a whitepaper but haven't booked a demo.
- Trade-offs: The "cartoon" style must be high-quality. If it looks childish, it risks trivializing the complexity of the job.
- Duration: 45-60 seconds.
Companies using similar video content -
Mews – PMS – Streamlines operations and reduces manual tasks.
eZee Absolute – Hotel Management System – Automates daily hotel workflows.
12. Illuminating Connectivity
MOFU | LinkedIn Video Ads
The Visual & Narrative Approach
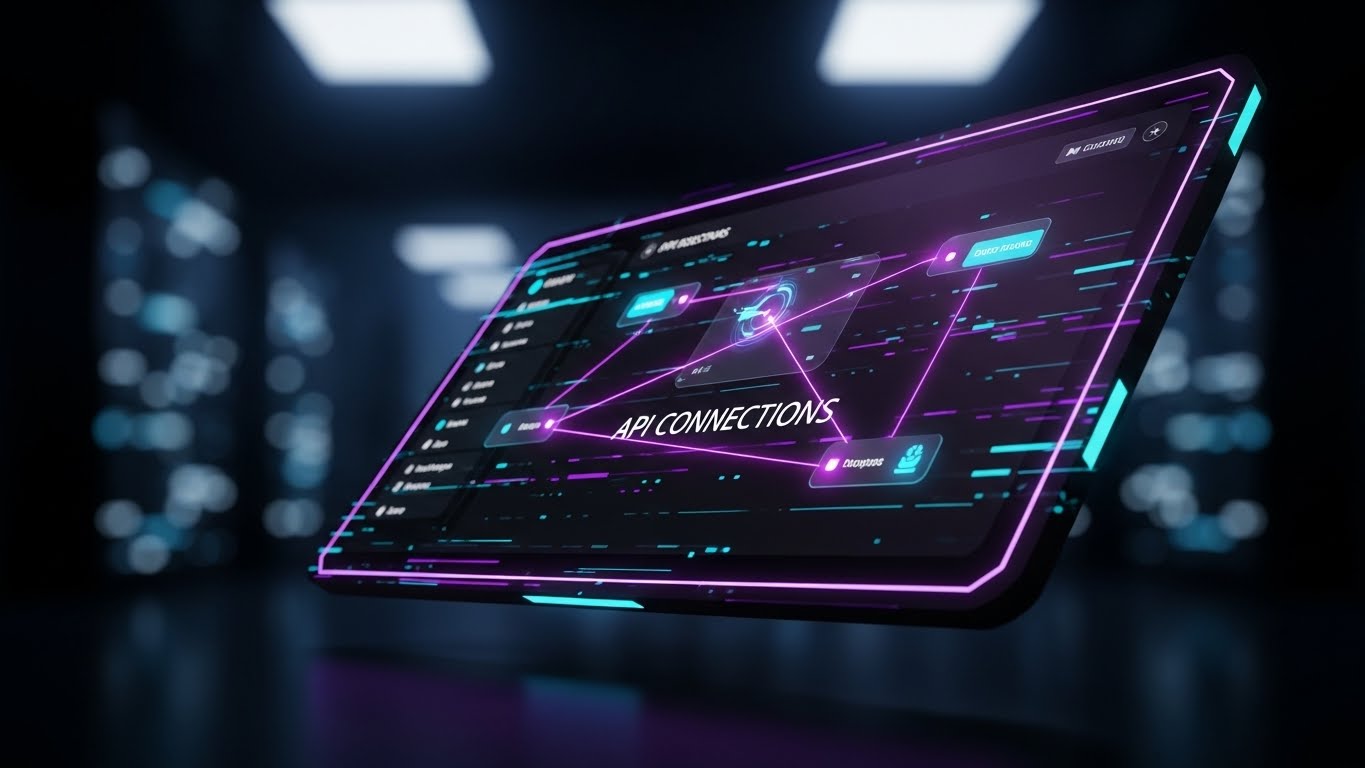
Scenario: The lights go down, and the screen transforms into a sleek, dark-mode environment. Against a backdrop of blurred server room bokeh, a floating dashboard appears with glowing neon purple and cyan edges. "API Connections" are visualized not as static lines, but as vibrant laser beams pulsing with data, connecting the central PMS to various OTA nodes.
Narration: Tech-focused and precise. "Seamless sync. Zero friction. Total connectivity."
Psychological Impact & KPI Focus
- Niche Psychology: Addresses Integration Anxiety. The number one fear for technical buyers is that the new software won't "talk" to their existing PMS. This style uses the visual language of high-tech reliability to assuage those fears.
- Operational Impact: Focuses on System Latency and Two-Way Sync. The pulsing lights visually confirm that data is flowing in real-time, eliminating the risk of overbookings due to lag.
Strategic Implementation & Trade-offs
- Best Use Case: LinkedIn Video Ads targeting IT Directors and Operations Managers who prioritize technical robustness.
- Trade-offs: Can feel cold or impersonal. It appeals to the logic of the IT department rather than the emotion of the General Manager.
- Duration: 15-30 seconds.
Companies using similar video content -
D-EDGE – Smart Channel Manager – Visualizes seamless API connections.
Oracle Hospitality – OPERA Cloud PMS – Highlights robust system integrations.
13. The Art of Conversion
MOFU | Visitor Re-engagement
The Visual & Narrative Approach
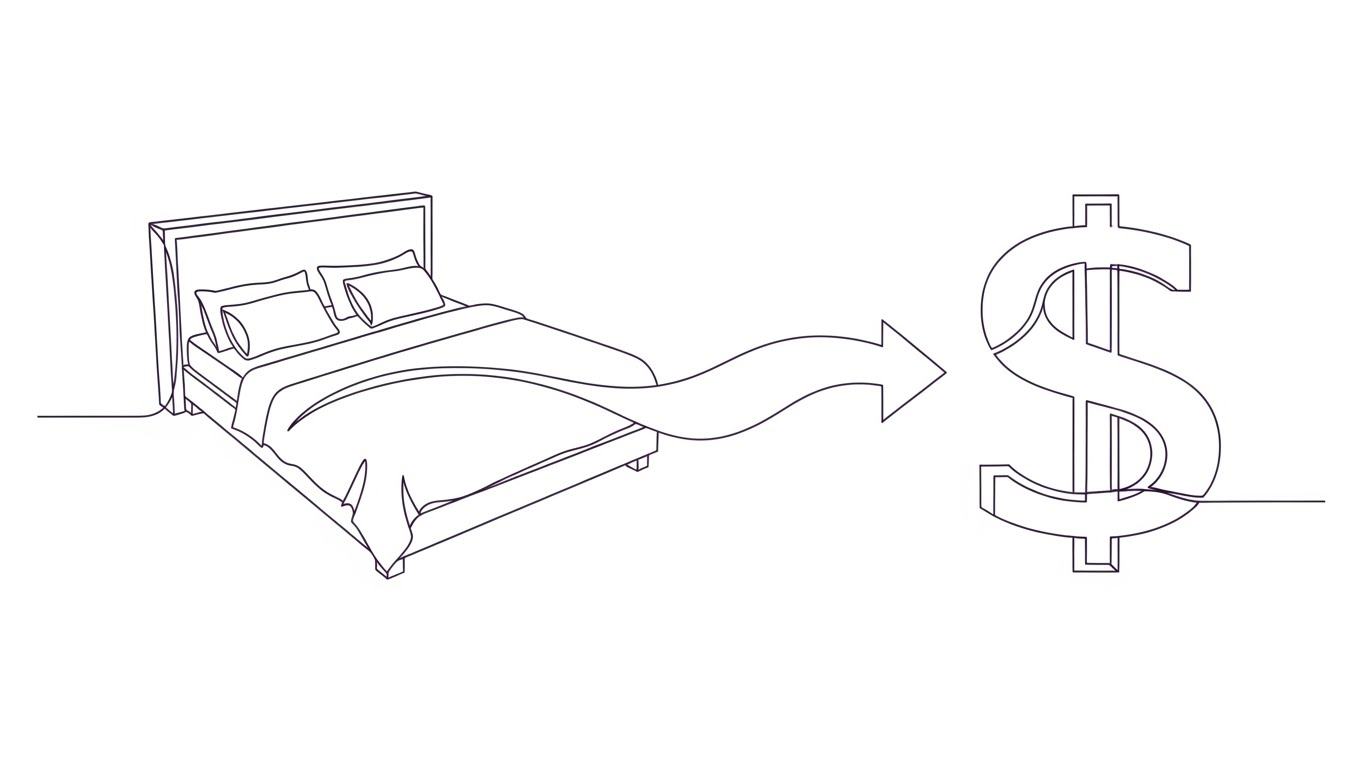
Scenario: On a stark, paper-white canvas, a single, elegant black line moves fluidly. It sketches the outline of a hotel bed, then seamlessly morphs and twists, transforming that shape into a bold Dollar sign ($). The animation is hypnotic and continuous, representing the alchemy of turning an empty room into profit.
Narration: Minimalist and sophisticated. "Every room has a value. We help you find it."
Psychological Impact & KPI Focus
- Niche Psychology: Appeals to the Purist. It strips away the noise of dashboards and data to focus on the core objective of the business: monetization of assets.
- Operational Impact: Highlights Inventory Conversion. It is a visual metaphor for the efficiency of the booking engine—turning static assets (beds) into liquid capital (cash).
Strategic Implementation & Trade-offs
- Best Use Case: Re-marketing Display Ads (HTML5 or GIF) that follow visitors who abandoned their booking engine setup.
- Trade-offs: Highly abstract. It assumes the viewer already understands what the software does and just needs a reminder of why it matters.
- Duration: 6-10 seconds (Loop).
Companies using similar video content -
Net Affinity – Booking Engine – Visualizes turning empty rooms into profit.
RoomCloud – Channel Manager – Converts static inventory into bookings.
14. Augmenting Reality
MOFU | The Functional Buyer
The Visual & Narrative Approach
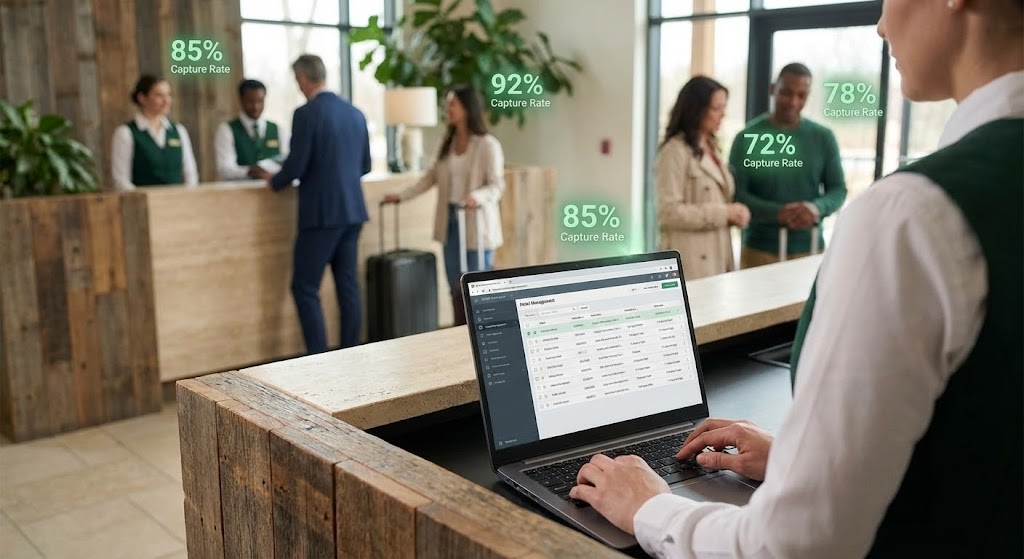
Scenario: A "Point of View" shot from behind a busy hotel front desk. We see the physical reality—guests checking in, luggage moving. But overlaid on this scene are floating, Augmented Reality (AR) elements: glowing green percentage signs hovering over guests (e.g., "85% Capture Rate"). A laptop in the foreground shows the software matching this real-world activity.
Narration: Direct and empowering. "See what others miss. Data, right where you need it."
Psychological Impact & KPI Focus
- Niche Psychology: Targets the Functional Buyer (Front Office Manager). These users need to know how the software impacts their daily reality. The AR style bridges the gap between the screen and the lobby.
- Operational Impact: Visualizes Real-Time Intelligence. It implies that the software provides insights during the guest interaction, not just in a post-stay report.
Strategic Implementation & Trade-offs
- Best Use Case: Website "Solutions" pages or product demo videos. It grounds the software in the physical environment of the hotel.
- Trade-offs: Requires perfect motion tracking. If the floating text "slips" or looks pasted on, it lowers the perceived quality of the product.
- Duration: 30-45 seconds.
Companies using similar video content -
Canary – AI Solutions – Overlays real-time data on physical hotel scenes.
Guesty – Property Management Software – Provides real-time insights for rentals.
15. Mastering Market Complexity
MOFU | Thought Leadership

The Visual & Narrative Approach
Scenario: We dive into the "brain" of the AI. A spinning globe, rendered in iridescent pearl and silver, is surrounded by a complex web of light nodes and network lines. The camera pushes in, revealing that these nodes represent "Global Travel Data." The motion is fluid and complex, suggestive of a massive neural network processing millions of data points.
Narration: Grandiose and authoritative. "The world is moving. Our algorithms keep you one step ahead."
Psychological Impact & KPI Focus
- Niche Psychology: Builds Brand Authority. It positions your platform not just as a tool, but as a global intelligence network. It appeals to the desire to be part of something "big" and "smart."
- Operational Impact: Visualizes Demand Forecasting. It shows the scale of data being analyzed (flights, weather, events) to predict demand, justifying the "AI" price tag.
Strategic Implementation & Trade-offs
- Best Use Case: Background visuals for keynote presentations or high-level blog posts about "The Future of Travel."
- Trade-offs: It is purely conceptual. It explains the "how" (AI) but not the "what" (interface).
- Duration: 15-30 seconds (Loop).
Companies using similar video content -
STR – Global Hospitality Data & Analytics – Visualizes vast market data networks.
Kalibri Labs – Revenue Strategy & Benchmarking – Processes millions of data points.
16. Building Tangible ROI
BOFU | ROI Justification
The Visual & Narrative Approach
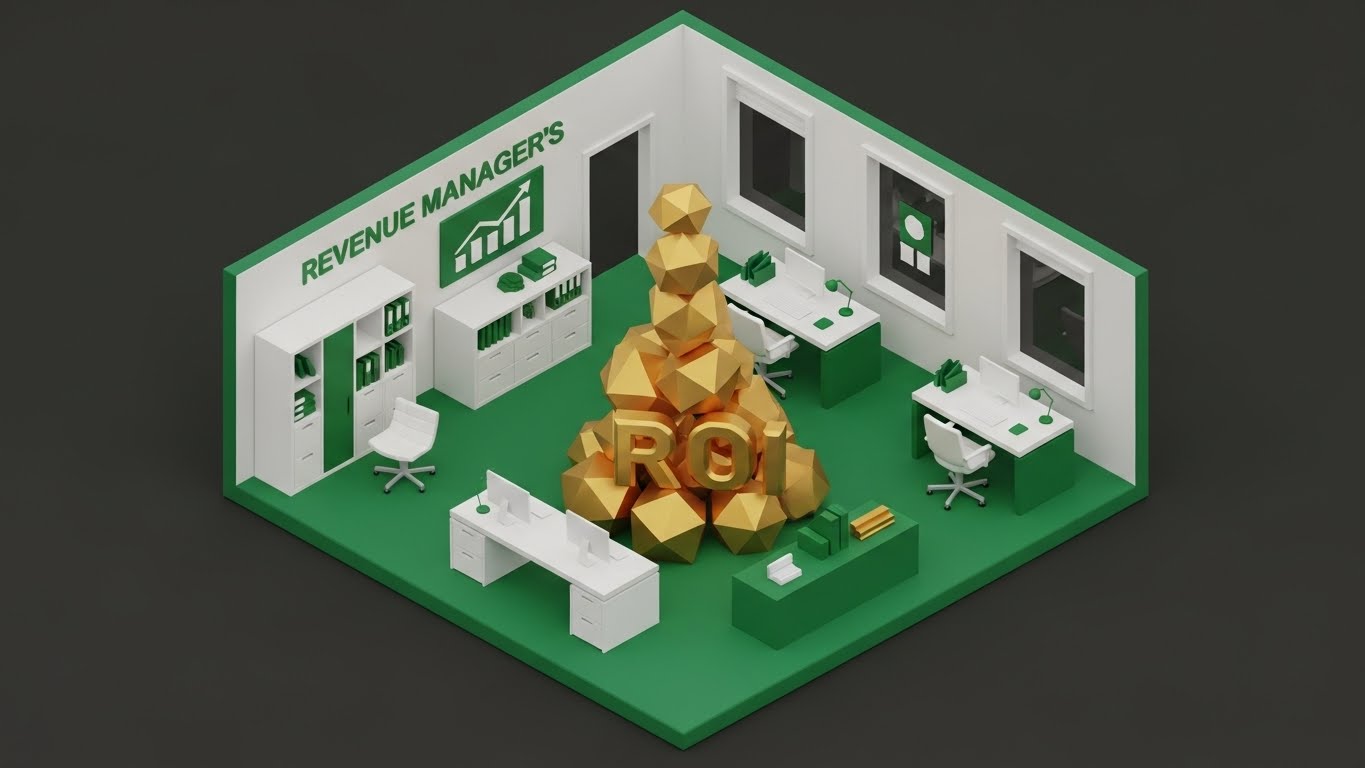
Scenario: A "dollhouse" cutaway view of a Revenue Manager's office, rendered in a charming isometric clay style with emerald green and gold leaf textures. As the tiny manager works at the computer, a geometric pile of gold polyhedrons in the center of the room grows taller and taller, physically filling the space with value.
Narration: Rhythmic and satisfying. "Small adjustments. Massive returns. Watch your strategy stack up."
Psychological Impact & KPI Focus
- Niche Psychology: Targets the Economic Buyer (Owner/CFO). They care about the bottom line. This style translates "software usage" directly into "accumulated wealth."
- Operational Impact: Visualizes RevPAR Growth and ROI. The growing pile is a literal representation of the Return on Investment, making the software fee seem negligible by comparison.
Strategic Implementation & Trade-offs
- Best Use Case: Pitch decks and ROI calculator results pages. It provides a comforting, stable visual of growth.
- Trade-offs: The "cute" aesthetic must be balanced with hard numbers in the accompanying text to ensure credibility with CFOs.
- Duration: 30-60 seconds.
Companies using similar video content -
ProfitSword – Business Intelligence & Forecasting – Shows accumulated financial value.
Actabl – Business Intelligence – Translates insights into tangible returns.
17. Mitigating Operational Risk
BOFU | Risk Mitigation
The Visual & Narrative Approach
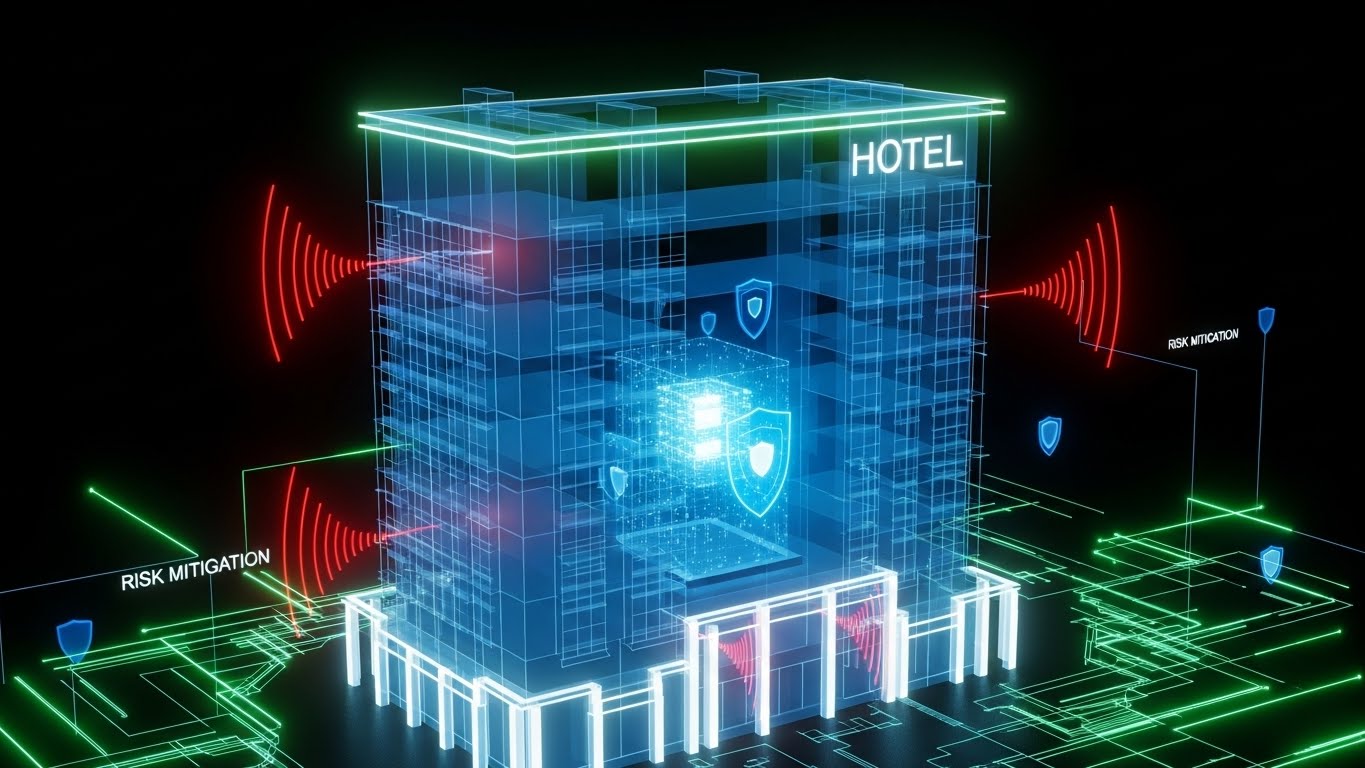
Scenario: The camera pans around a ghostly, translucent blue 3D model of a hotel building. We see the "skeleton" of the structure. Inside, a glowing blue shield pulsates around the central data core. Red pulses (representing cyber threats or market crashes) bounce harmlessly off the exterior, visualizing the protection the system offers.
Narration: Serious and reassuring. "In a volatile market, we are your constant. Stability, guaranteed."
Psychological Impact & KPI Focus
- Niche Psychology: Addresses Risk Aversion. Hoteliers are risk-averse by nature. They fear data breaches and market crashes. This style visualizes the software as an insurance policy.
- Operational Impact: Focuses on Data Security and Cloud Reliability. It positions the platform as the infrastructure that keeps the hotel standing during digital storms.
Strategic Implementation & Trade-offs
- Best Use Case: "Security" and "Compliance" sections of the website. Crucial for enterprise contracts.
- Trade-offs: Can appear "clinical" or "cold." Use sparingly to emphasize safety, not to sell the primary revenue features.
- Duration: 20-40 seconds.
Companies using similar video content -
protel – PMS – Emphasizes data security and system reliability.
Springer Miller Systems – *SMS\
18. Accelerating the Sales Cycle
BOFU | Sales Cycle Acceleration

The Visual & Narrative Approach
Scenario: A cinematic, hyper-realistic close-up of two hands—one in a navy suit, one in a grey suit—meeting for a firm handshake in a glass-walled boardroom. The depth of field is shallow, focusing intensely on the connection. A subtle, glowing digital icon of a "Contract" seals the moment they touch.
Narration: Professional and conclusive. "Partnership. Not just a platform. Let’s build the future together."
Psychological Impact & KPI Focus
- Niche Psychology: Humanizes the Vendor Relationship. At the bottom of the funnel, people buy from people. This style reassures the buyer that there is a human support team behind the code.
- Operational Impact: Implies Customer Support and Onboarding Success. It suggests that the "deal" is just the beginning of a successful partnership.
Strategic Implementation & Trade-offs
- Best Use Case: The final video in an email sequence before a "Closing Call." Also effective for "About Us" pages.
- Trade-offs: Generative AI hands can sometimes look uncanny. Quality control is critical to avoid the "uncanny valley" effect which destroys trust.
- Duration: 15-20 seconds.
Companies using similar video content -
Cendyn – CRM & Revenue Strategy – Humanizes vendor relationships and partnerships.
Amadeus Hospitality – Revenue Management – Fosters collaboration for sales cycles.
19. Optimizing Reality
BOFU | Competitive Comparison

The Visual & Narrative Approach
Scenario: A vertical split-screen. The left side is gritty, grey, and desaturated, showing a stressed hand hovering over a messy desk of spreadsheets. The right side is vibrant, clean, and bathed in a rainbow spectrum, showing a hand effortlessly using a sleek, holographic interface. The contrast is stark and immediate.
Narration: Comparative and persuasive. "Leave the chaos behind. Step into clarity."
Psychological Impact & KPI Focus
- Niche Psychology: Leverages Cognitive Dissonance. It forces the viewer to identify with the "bad" side (their current reality) and yearn for the "good" side (the solution).
- Operational Impact: Visualizes Efficiency Gains. It creates a direct "Before & After" comparison of the workflow, highlighting the reduction in manual labor.
Strategic Implementation & Trade-offs
- Best Use Case: Competitor comparison pages ("Us vs. Them") or retargeting ads for users stuck in the decision phase.
- Trade-offs: It’s a classic advertising trope. It must be executed with high visual fidelity to avoid looking like a cheap late-night infomercial.
- Duration: 15-30 seconds.
Companies using similar video content -
Revolution Plus – Automated revenue optimization – Contrasts manual chaos with automated clarity.
LodgIQ – AI and ML for dynamic pricing – Shows clear workflow optimization.
20. The Gold Standard
BOFU | The Economic Buyer

The Visual & Narrative Approach
Scenario: An ultra-macro shot of a single gold coin standing on its edge on a reflective black surface. The lighting is exquisite, highlighting the texture of the metal. In the reflection of the coin, we see a distorted but recognizable image of a luxury hotel lobby. The coin is the hotel.
Narration: Premium and final. "Precision pricing. Gold standard results. Your asset, optimized."
Psychological Impact & KPI Focus
- Niche Psychology: Appeals to Prestige and Value. It associates the software not with "costs" but with "wealth." It elevates the brand to a luxury tier.
- Operational Impact: Summarizes Total Asset Value. It serves as the final visual argument that the software is the key to unlocking the full financial potential of the property.
Strategic Implementation & Trade-offs
- Best Use Case: The closing slide of a sales deck or the background of the "Pricing" page.
- Trade-offs: It is a static concept. It conveys "value" but explains zero functionality. It is a mood setter, not an explainer.
- Duration: 10-15 seconds (Loop).
Companies using similar video content -
HotStats – Hotel Performance Benchmarking – Represents ultimate financial value.
The Hotels Network – Business Intelligence – Reflects true asset worth.
21. Visualizing Asset Protection
BOFU | ROI Justification Hook
The Visual & Narrative Approach
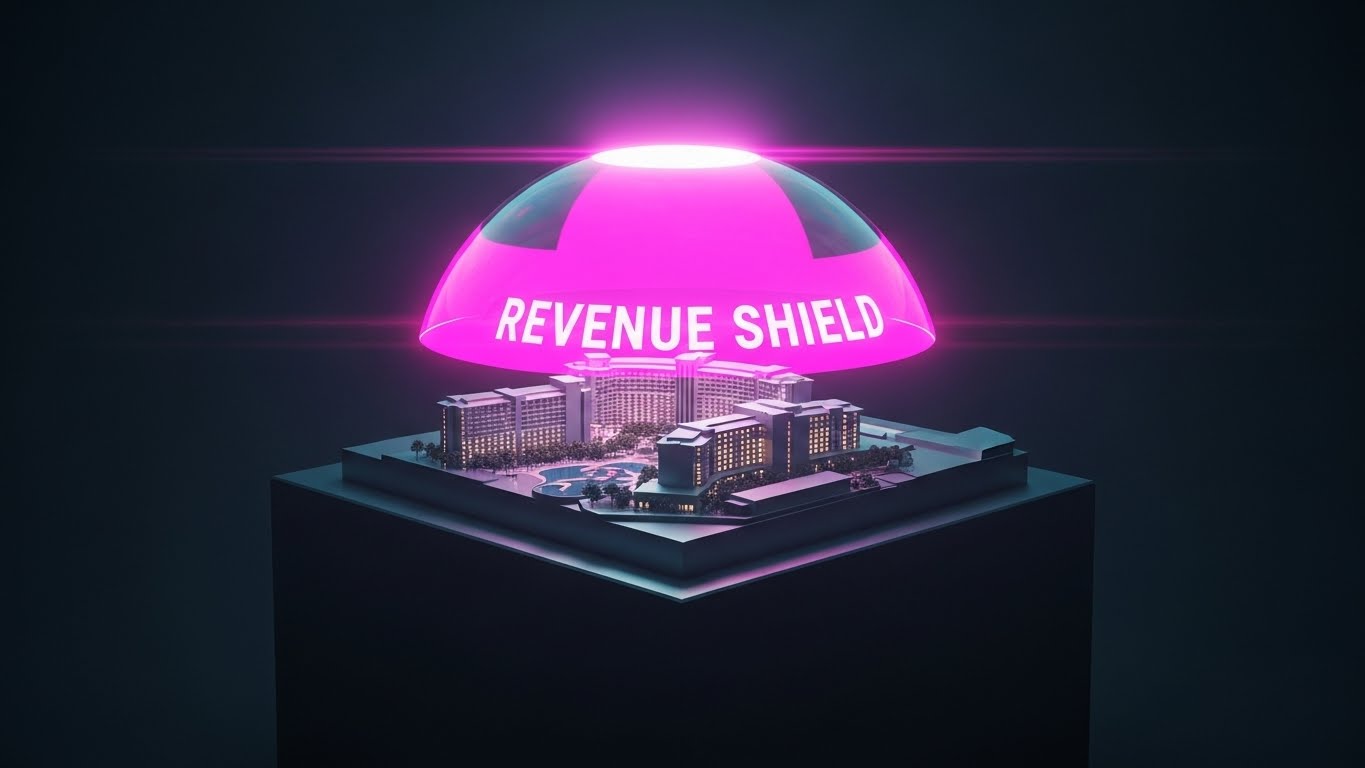
Scenario: A moody, cinematic studio shot centers on a high-fidelity 3D architectural model of a luxury resort resting on a matte charcoal pedestal. A semi-transparent, emissive holographic dome materializes over the resort, glowing in "Cyber Blue." This dome acts as a "Revenue Shield," gently pulsating as it deflects red particles (market volatility) while locking in green light (revenue).
Narration: Deep and resonant. "Markets fluctuate. Your asset shouldn't. The ultimate shield for your bottom line."
Psychological Impact & KPI Focus
- Niche Psychology: Appeals to the Asset Manager/Owner. They are driven by Asset Preservation and valuation. This visual metaphor speaks directly to their need for stability, framing the software as an insurance policy against bad data.
- Operational Impact: Visualizes Yield Protection. It demonstrates that the algorithm prevents "race to the bottom" pricing, safeguarding the property's Brand Equity and ADR (Average Daily Rate).
Strategic Implementation & Trade-offs
- Best Use Case: LinkedIn Video Ads targeting "Hospitality Investment" job titles or final contract review decks.
- Trade-offs: High production cost. It sells the feeling of security rather than a specific feature.
- Duration: 15-20 seconds.
Companies using similar video content -
BEONx – Total Profitability Platform – Shields assets from market volatility.
Infor Hospitality – HMS – Safeguards property value with robust systems.
22. Accelerating Time-to-Value
Onboard | Time-to-Value
The Visual & Narrative Approach
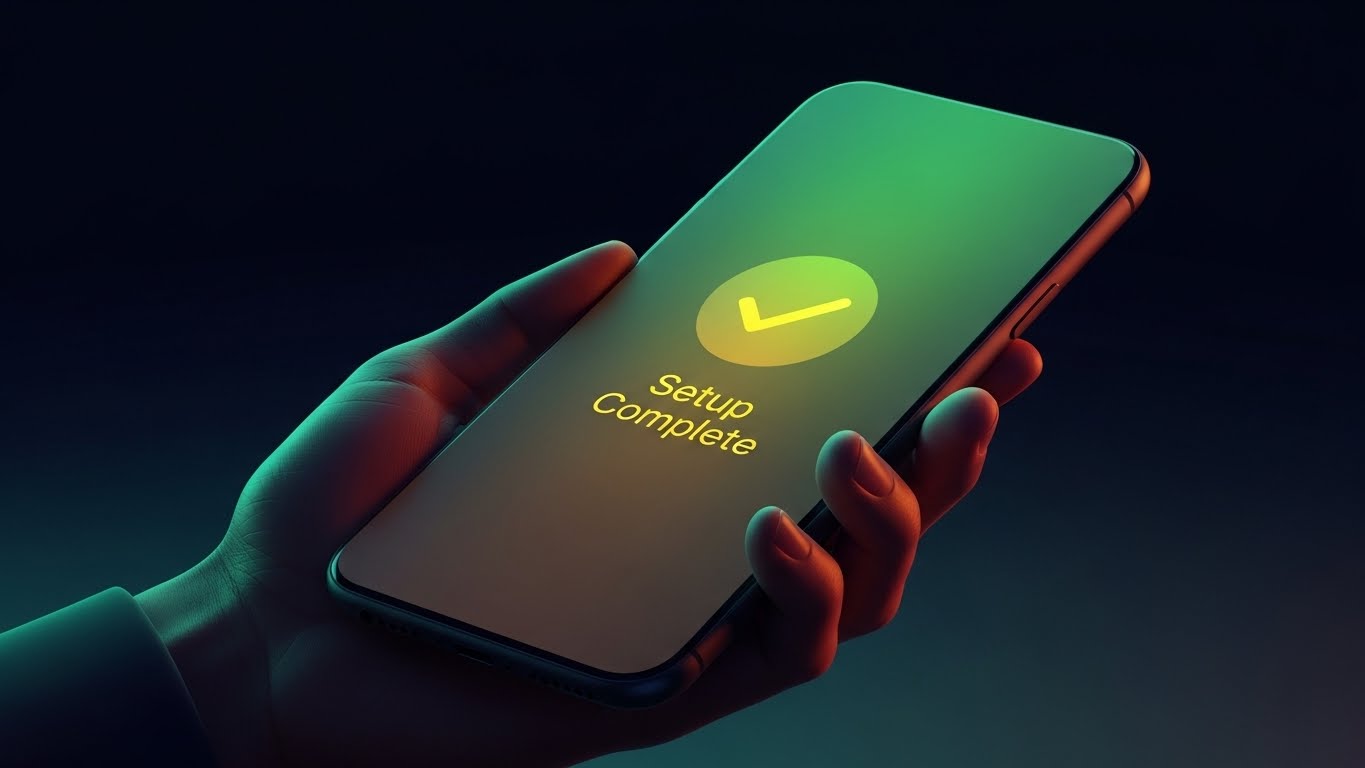
Scenario: A first-person perspective in a dimly lit, modern home office. A hand holds a smartphone displaying the software’s app in "Dark Mode"—charcoal backgrounds with amber accents. A fluid animation completes a setup sequence, culminating in a large, satisfyingly glowing "Setup Complete" checkmark that pulses once in electric green.
Narration: Soft and relieving. "From signup to strategy in minutes. Done."
Psychological Impact & KPI Focus
- Niche Psychology: Addresses Setup Fatigue. Hoteliers dread the "Implementation Dip"—the weeks of downtime when switching systems. This visual promises instant gratification and relief.
- Operational Impact: Focuses on Time-to-Value (TTV). It visually demonstrates that the system is "Plug and Play," requiring minimal configuration to start generating pricing recommendations.
Strategic Implementation & Trade-offs
- Best Use Case: Welcome emails sent immediately after a user signs up for a trial or App Store preview videos.
- Trade-offs: Requires the UI design to be exceptionally polished. "Dark Mode" suggests a premium, modern experience and must be consistent with the actual app.
- Duration: 6-10 seconds.
Companies using similar video content -
SabeeApp – Property Management System – Offers quick and satisfying setup completion.
WebRezPro – Cloud PMS – Demonstrates fast implementation.
23. Bridging Plan and Reality
Onboard | Reducing Friction
The Visual & Narrative Approach
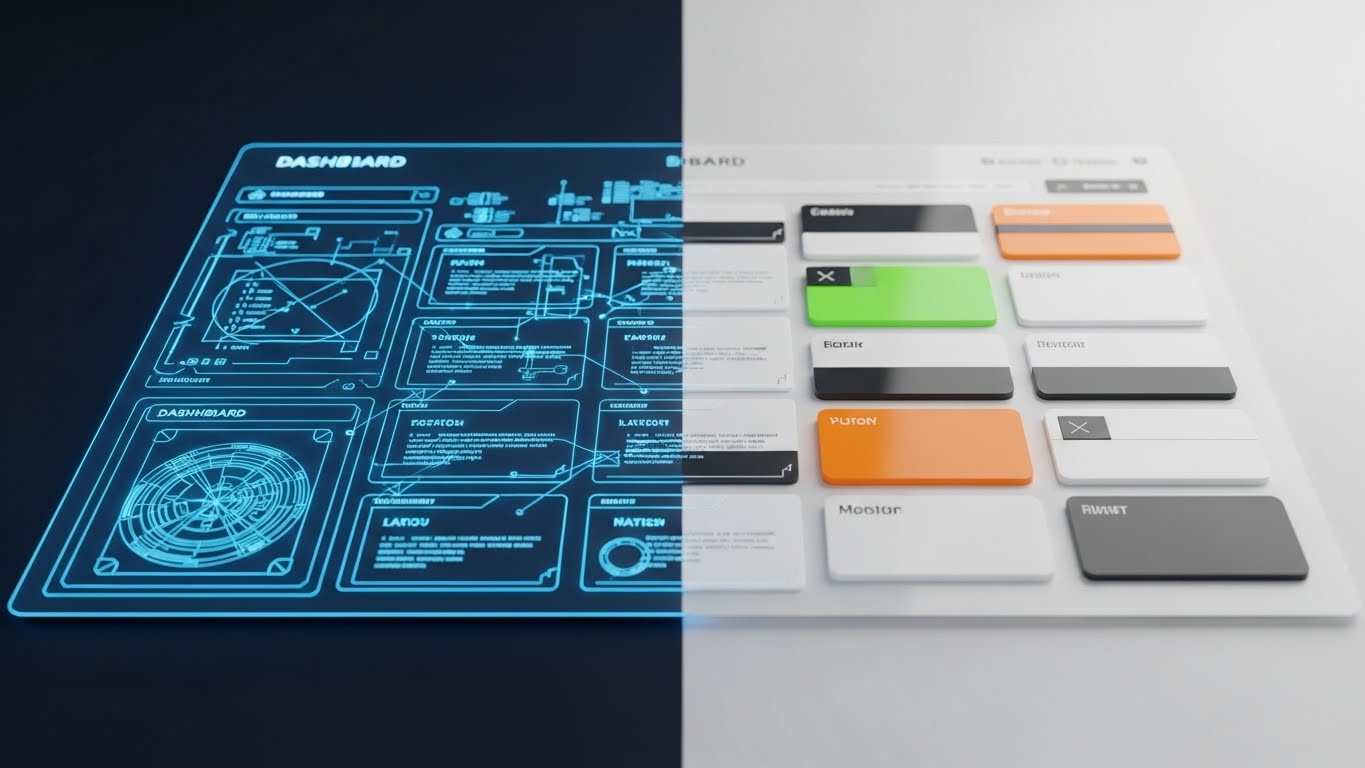
Scenario: The screen is split by a moving "scanner" line. To the left, we see a technical, blueprint wireframe of the dashboard grid—complex, mathematical, and structural. As the line wipes across to the right, the wireframe instantly transforms into the glossy, colorful, fully rendered interface. The transition is seamless, symbolizing the shift from "Plan" to "Product."
Narration: Instructional and crisp. "Complex logic. Beautifully simple execution."
Psychological Impact & KPI Focus
- Niche Psychology: Targets the IT Director who worries about the complexity of the backend. It reassures them that the rigorous structure (the wireframe) is there, but the user experience (the render) is elegant and friction-free.
- Operational Impact: Visualizes Implementation Velocity. It suggests that the path from technical integration to user adoption is seamless.
Strategic Implementation & Trade-offs
- Best Use Case: "How it Works" pages, implementation guides, or kickoff calls with technical teams.
- Trade-offs: It is a transition effect, not a feature explainer. It sells the ease of the process, not the details.
- Duration: 10-15 seconds (Loop).
Companies using similar video content -
Agilysys – rGuest Express – Transitions from technical blueprint to polished UI.
Hotelogix – Cloud PMS – Provides seamless integration from plan to product.
24. Streamlining Self-Serve Onboarding
Onboard | Self-Serve Onboarding

The Visual & Narrative Approach
Scenario: A clean white canvas features a horizontal timeline with four bold, primary-colored icons (Red, Blue, Yellow). As the narration counts down, the icons animate simply: 1. Sign Up (Pen), 2. Connect (Plug), 3. Configure (Sliders), 4. Launch (Rocket). The motion is snappy, linear, and bouncy.
Narration: Fast and energetic. "Connect. Configure. Launch. Revenue in three steps."
Psychological Impact & KPI Focus
- Niche Psychology: Appeals to the Do-It-Yourselfer (Independent Hotelier). They don't want a long sales call or a 50-page manual; they want to get to work. This style respects their autonomy.
- Operational Impact: Focuses on Self-Serve Adoption. It breaks down the intimidating process of "Revenue Management" into a manageable, non-threatening checklist.
Strategic Implementation & Trade-offs
- Best Use Case: In-app tooltips, "Getting Started" wizard overlays, or email headers.
- Trade-offs: It is very basic. It risks looking generic if the iconography isn't custom-designed to match the brand's unique palette.
- Duration: 15 seconds.
Companies using similar video content -
InnRoad – Cloud-based PMS – Breaks down onboarding into simple steps.
Clock PMS+ – All-in-one hotel management – Offers clear, icon-driven setup.
25. Activating the "Click"
Onboard | Freemium Activation
The Visual & Narrative Approach
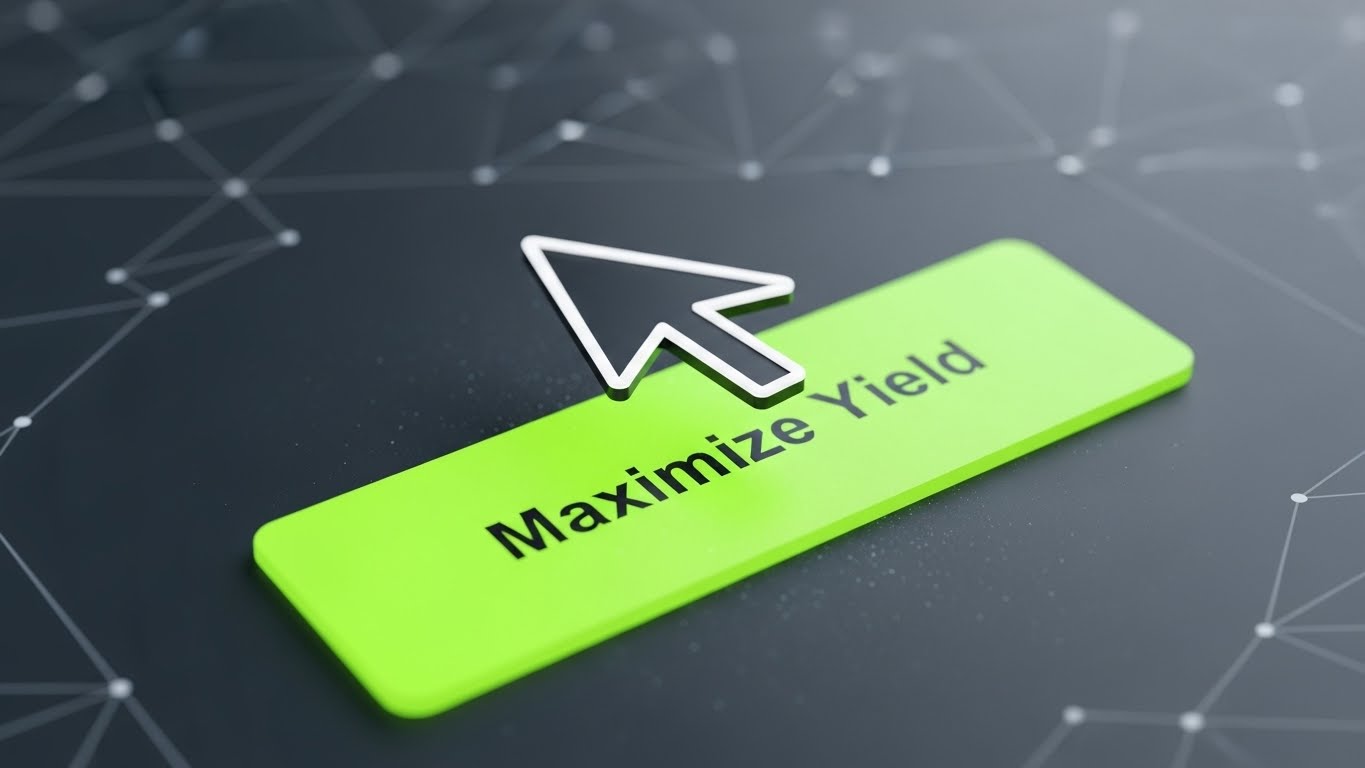
Scenario: An extreme close-up (macro) view of the screen pixels. We see the mouse cursor approach a vibrant, electric lime button labeled "MAXIMIZE YIELD." The camera focuses on the subtle depression of the button state and the explosion of light particles upon the click.
Narration: Anticipatory and punchy. "One click. Infinite potential. Activate now."
Psychological Impact & KPI Focus
- Niche Psychology: Leverages Haptic Desire. It triggers the urge to interact. It makes the digital action feel physical, substantial, and consequential.
- Operational Impact: Drives Feature Activation Rate. It focuses specifically on the "Aha!" moment where the user commits to the strategy and sees the first result.
Strategic Implementation & Trade-offs
- Best Use Case: Retargeting email campaigns reminding users to complete their setup or activate a paid feature.
- Trade-offs: If the UI in the video doesn't match the live product exactly, it creates confusion. Precision is key.
- Duration: 6-10 seconds.
Companies using similar video content -
PriceLabs – Dynamic pricing – Highlights instant feature activation.
TakeUp – AI-powered revenue management – Drives immediate action for yield.
26. Deepening Feature Adoption
Retention | Deep Feature Adoption
The Visual & Narrative Approach
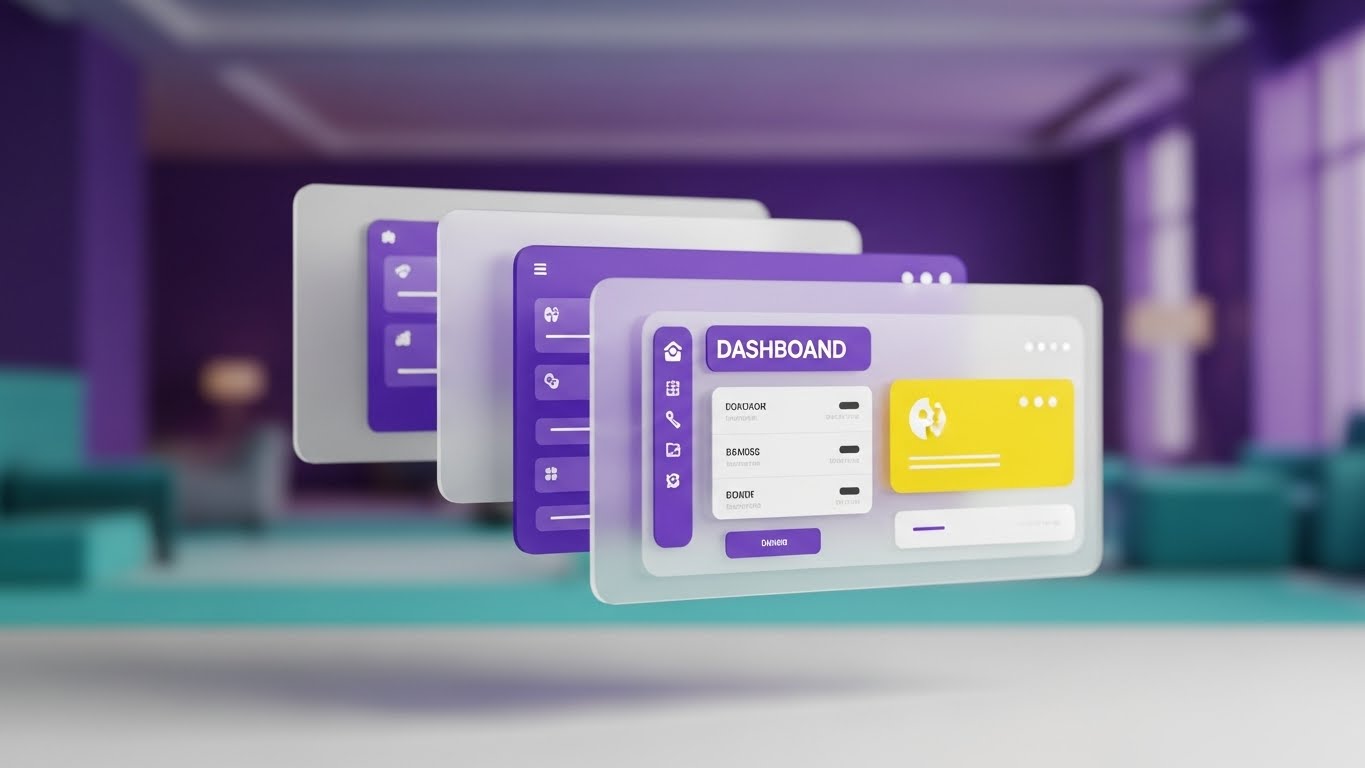
Scenario: The dashboard is deconstructed into floating layers of glass, viewed from a side angle. The front layer contains the data widgets; the middle layer contains the grid; the back layer is a blurred, atmospheric image of a hotel lobby. As the camera drifts, the parallax effect reveals the depth and connection between the data and the physical hotel.
Narration: Sophisticated and smooth. "Look deeper. See the data behind the guest."
Psychological Impact & KPI Focus
- Niche Psychology: Appeals to the Power User. It suggests that there are layers of depth to the software that they haven't explored yet, encouraging curiosity and mastery.
- Operational Impact: Focuses on Stickiness. Users who explore "deeper" features are less likely to churn. This style invites exploration beyond the dashboard.
Strategic Implementation & Trade-offs
- Best Use Case: "Pro Tips" newsletter headers, product update videos, or webinar intros.
- Trade-offs: Requires high-end motion graphics skills to achieve the "glass" look without it becoming messy or illegible.
- Duration: 15-20 seconds.
Companies using similar video content -
Shiji Group – Daylight PMS – Reveals layers of data and functionality.
NewBook – Property Management System – Encourages exploration of advanced features.
27. Reducing Staff Churn
Retention | Reducing Churn
The Visual & Narrative Approach
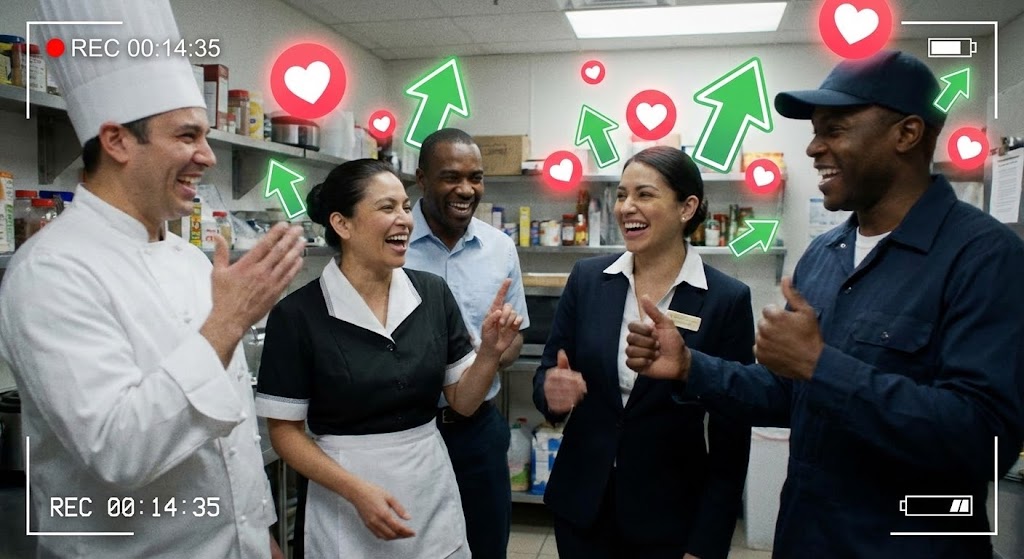
Scenario: High-energy, handheld live-action footage of a diverse hotel team (Front Desk, Housekeeping) laughing in a breakroom. Superimposed over them are popping 2D animated graphics: red hearts, green "efficiency" arrows, and smiley faces. The vibe is celebratory and light.
Narration: Joyful and team-oriented. "Empower your people. Keep the team happy, keep the guests happy."
Psychological Impact & KPI Focus
- Niche Psychology: Addresses Staff Burnout. Hotel turnover is massive. This style frames the software as a tool that makes the staff's life easier, not harder, fostering loyalty.
- Operational Impact: Focuses on Employee Satisfaction (eNPS). A happy team uses the software more effectively and complains less.
Strategic Implementation & Trade-offs
- Best Use Case: Customer Success videos sent to General Managers to encourage team-wide rollout and buy-in.
- Trade-offs: Live action requires casting. It must look authentic to the region, not like generic "cheesy stock footage."
- Duration: 20-30 seconds.
Companies using similar video content -
Guestline – Rezlynx PMS – Shows positive impact on staff satisfaction.
Canary – Guest Management System – Empowers staff and reduces burnout.
28. Empowering Self-Support
Retention | Knowledge Base

The Visual & Narrative Approach
Scenario: A friendly, flat-vector character (dressed in a hotel uniform) stands next to a floating UI screen. The character smiles and points to a large "FAQ" speech bubble that pops out of the interface. Question marks float gently in the background, turning into checkmarks as they touch the screen.
Narration: Helpful and clear. "Answers at your fingertips. Support that never sleeps."
Psychological Impact & KPI Focus
- Niche Psychology: Mitigates Support Anxiety. Users hate waiting on hold. This style reassures them that help is instant, accessible, and friendly.
- Operational Impact: Focuses on Support Ticket Deflection. By encouraging self-service, it reduces the load on the customer support team and speeds up user resolution.
Strategic Implementation & Trade-offs
- Best Use Case: The header of the "Help Center," support portal login, or automated chat bot greetings.
- Trade-offs: Can feel a bit "juvenile" if the character design is too cartoony. Needs to remain professional/corporate.
- Duration: 10-15 seconds.
Companies using similar video content -
Revinate – CRM & Marketing Automation – Provides instant support and answers.
TrustYou – Guest Feedback & Reputation – Facilitates self-service for guest queries.
29. Visualizing Upsell Potential
Expansion | Upsell/Cross-sell
The Visual & Narrative Approach
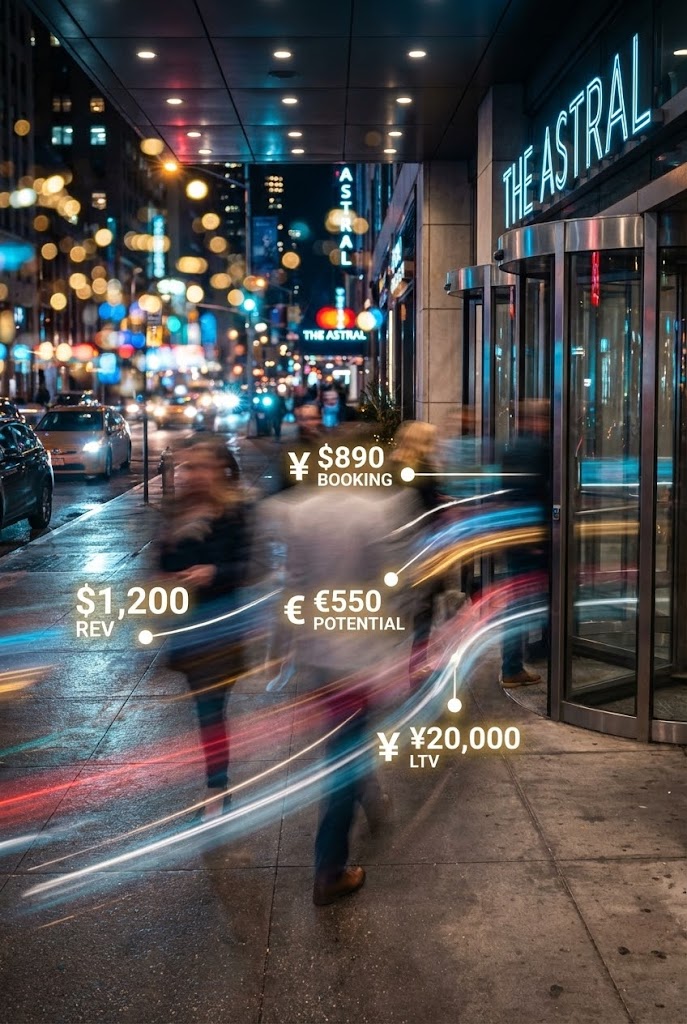
Scenario: A vertical hyper-lapse of a busy city hotel entrance at night. Guests stream in and out, rendered with motion blur. As they move, glowing white lines (data trails) follow them, revealing floating text: "Room Upgrade: +$50," "Spa Booking: +$120," "Late Checkout: +$30."
Narration: Fast and opportunistic. "Don't leave money at the door. Capture every opportunity."
Psychological Impact & KPI Focus
- Niche Psychology: Targets the FOMO (Fear Of Missing Out) of the Revenue Manager. It visualizes the "invisible money" walking out the door because they aren't using the software's upsell features.
- Operational Impact: Focuses on TRevPAR (Total Revenue). It shifts the focus from just "Rooms" to "Total Guest Value," justifying the purchase of add-on modules.
Strategic Implementation & Trade-offs
- Best Use Case: Instagram Reels or TikTok Ads targeting younger revenue professionals or existing customers.
- Trade-offs: The motion tracking must be perfect. If the text "drifts" off the guest, the illusion is broken and looks amateur.
- Duration: 10-15 seconds (Loop).
Companies using similar video content -
Canary – Dynamic Upsells – Shows missed revenue opportunities.
Kognitiv – Loyalty & Revenue Optimization – Visualizes total guest value.
30. Incentivizing Advocacy
Expansion | Referrals & Advocacy

The Visual & Narrative Approach
Scenario: On a clean isometric grid, a single blue node (representing a user) sends a glowing pink signal to three neighboring nodes. These nodes light up and send signals to their neighbors. The camera pulls back to reveal a massive, interconnected network of glowing hotels.
Narration: Community-focused. "Stronger together. Join the network powering the world's best hotels."
Psychological Impact & KPI Focus
- Niche Psychology: Appeals to Tribalism. Hoteliers talk. They want to use what the "best" are using. This style visualizes the community they are joining and the status of being a "Node."
- Operational Impact: Focuses on Viral Coefficient and Network Effects. It subtly encourages the user to refer colleagues to strengthen the ecosystem.
Strategic Implementation & Trade-offs
- Best Use Case: "Refer a Friend" email campaigns, partner program pages, or the final slide of a webinar.
- Trade-offs: Abstract. It doesn't show the product features, just the reach of the product.
- Duration: 15-20 seconds.
Part 4: Strategic Knowledge Base
The Visual Operations Doctrine
To truly bridge the gap between "Software" and "Hospitality," a sporadic video strategy is not enough. You need a Visual Operating System. The following three segments provide a strategic framework for deploying these 30 styles to drive measurable business outcomes, customized for the hotel industry.
STRATEGIC ALIGNMENT & VISUAL ARCHITECTURE
The "Pre-Production" Strategy – Defining the System.
- The Cognitive Load Audit: Before creating visuals, audit your current training manuals. If a PDF takes 20 minutes to read (High Load), replace it with a Style 26 (Parallax UI) video that takes 30 seconds. Measure the reduction in "Time-to-Competency."
- Role-Based Visual Mapping: Do not show the same video to a General Manager and a Front Desk Agent. Use Style 20 (Photorealistic Gold) for GMs to emphasize asset value, and Style 24 (Minimalist Flat) for Agents to emphasize workflow speed.
- The "Glanceability" Standard: Hotel lobbies are high-stress environments. Visuals for operations (like Style 22) must be designed to be understood in <3 seconds without audio.
- Brand Voice Consistency: Your software likely integrates with the hotel's PMS. Ensure your visual styles (fonts, colors) do not clash with the hotel's existing brand standards, or the software will feel like an "alien" intrusion.
- The Advids Strategic Audit: Partner with Advids to define this "Visual Operating System" before production begins. A cohesive visual language across all 30 styles builds trust faster than disjointed, one-off videos.
- Standardization vs. Customization: For chain-wide rollouts, use Style 11 (Abstract AI) to standardize the concept of "Revenue Strategy" across all properties, ensuring every GM speaks the same language.
- The Cross-Departmental Bridge: Use Style 7 (Humanizing Data) to show Sales and Revenue teams working together. Visuals can bridge the silo between "Sales trying to book volume" and "Revenue trying to push rate."
- Legacy System Integration: Use Style 12 (Connectivity) to visually reassure IT teams that your modern Cloud SaaS plays nicely with their ancient on-premise servers (a major friction point in hotels).
- Accessibility in Hospitality: Housekeeping and Front Desk staffs are often multilingual. Prioritize Style 6 (Abstract Motion) and Style 24 (Icons) which rely on visual symbols rather than heavy English text overlays.
- The Mobile-First Mandate: General Managers are rarely at their desks; they are walking the floor. Ensure all 30 styles (especially Style 29) are optimized for vertical mobile viewing on the go.
OPERATIONAL ADOPTION & IMPLEMENTATION
The "Deployment" Phase – Embedding into Workflow.
- Overcoming "AI Anxiety": Revenue Managers often fear the software is there to replace them. Use Style 2 (Line Art) and Style 21 (Revenue Shield) to frame the software as a tool that protects them, not a robot that replaces them.
- The Micro-Learning Shift: Replace the 50-page "Onboarding Manual" with a playlist of 30-second Style 16 (Isometric Workflow) clips. Staff can watch one clip between guest check-ins.
- Just-in-Time Support: Embed Style 25 (Macro UI) clips directly into the software's tooltip. When a user hovers over "Yield," show them the "Click" video instantly.
- Gamification of Targets: Use Style 4 (Low Poly Coins) to visualize the team's progress toward the monthly RevPAR target. Display this on a screen in the back office to drive competitive spirit.
- Reducing Support Ticket Volume: There is a direct correlation between proactive visual guides (Style 28) and reduced call center volume. If users can "see" the fix, they don't call.
- Remote Onboarding: For hotel groups expanding rapidly, sending a trainer to every property is impossible. Use Style 1 (SaaS Screen Recording) and Style 18 (Generative AI) to create a "Virtual Trainer" that scales infinitely.
- Visual SOPs: Transform text-based Standard Operating Procedures (SOPs) for "Rate Loading" into Style 15 (Clean UI) process flows. Visual memory retention beats text retention by 600%.
- Feedback Loops: Use Style 19 (Rapid UI) in your product update emails to excitedly show off new features. If users don't see the new features, they won't use them.
- Scalable Localization: When expanding to new regions (e.g., APAC), swap the text overlays in Style 3 (Kinetic Typography) but keep the visual core. This allows for rapid, low-cost localization.
- Leadership Communication: When the VP of Revenue needs to explain a strategy shift to Owners, equip them with Style 11 (Abstract AI) visuals. It makes them look like visionaries and makes the strategy easier to sell.
MEASURING IMPACT & FUTURE-PROOFING
The "ROI" Phase – Validating Success.
- Beyond "Views": Do not measure video success by "Views." Measure it by "Feature Adoption Rate." Did the usage of the "Group Booking Tool" increase after you released the Style 26 (Parallax) video explaining it?
- The "Idle Time" Metric: High idle time in software means confusion. Better visualization (Style 8 Clean UI) should correlate with reduced time-on-task for routine entries.
- Compliance Velocity: How fast can you get the whole chain compliant with new Rate Parity laws? Send a Style 17 (X-Ray) video explaining the risk. Measure how fast the "Compliance Checkbox" is ticked compared to a text email.
- Retention and Churn: Customers who engage with your "Academy" (powered by Styles 21-30) have a higher Lifetime Value (LTV). Track the retention rate of video-viewers vs. non-viewers.
- The AI Visual Frontier: Prepare for Real-Time Video Generation. Soon, the dashboard will auto-generate a Style 10 (Data Viz) video summary of yesterday's performance for the GM's morning coffee.
- Scalability of Assets: Build a library, not a graveyard. Create "Master Files" for Style 9 (3D Objects) so you can easily swap out the "Coin" for a "Keycard" or "Suitcase" as your branding evolves.
- The Advids Partnership: You are building a software company, not a video production house. Lean on Advids to manage the asset scalability, ensuring your library evolves as fast as your code.
- Benchmarking Success: "Good enough" visuals are a competitive risk. If your competitor uses Style 20 (Photorealistic) and you use blurry screenshots, you lose the perception war.
- The ROI of Confidence: It is hard to quantify, but critical: Does the Revenue Manager feel confident presenting your data to the Owner? Style 13 (Line Art) helps them visualize the data simply, empowering them in high-stakes meetings.
- Final Call to Innovation: Treat video as infrastructure. It is the UI for your UI. Invest in it with the same rigor you invest in your backend code, and the returns—in adoption, retention, and growth—will be exponential.
Companies using similar video content -
GuestRevu – Guest Feedback & Online Reputation – Visualizes community and referrals.
Kognitiv – Loyalty & Revenue Optimization – Spreads network effects.
Author & Editor Bio


