
The Visible Network: Engineering Trust in a Hybrid World
For the modern enterprise, the network is no longer merely infrastructure; it is the central nervous system of the business. As organizations transition from static on-premise data centers to dynamic, hybrid cloud environments, the mandate for CTOs and NetOps leaders has shifted. It is no longer enough to simply maintain connectivity; the new imperative is absolute observability. The challenge lies in the "Physical/Digital Divide"—the difficulty of visualizing the invisible data flows that connect physical routers to ephemeral cloud instances.
By mastering the visual language of your platform, you empower stakeholders to see the value in the complexity. This is a strategic opportunity to transform abstract telemetry into clear, actionable business intelligence. The value of this enhanced visibility is measurable. Recent industry research reveals that the average cost of unplanned IT downtime has risen to $14,056 per minute. Crucially, efficiency is often hampered by a lack of insight; nearly 40% of downtime costs are attributed to the time spent identifying affected users before a technical fix can even be implemented.
Closing this "visibility gap" is the core function of high-performance motion design. This guide provides a strategic framework of 30 curated visualization styles, specifically tailored for the Network Monitoring domain. From the "Deep Packet Inspection" of X-ray visualizations to the "Global Connectivity" of abstract motion graphics, these examples are designed to reduce cognitive load, accelerate "Mean Time to Understanding," and position your platform as the lucid solution to a complex problem.
1. Abstract 2D Motion Graphics
TOFU | Brand Awareness
The Visual & Narrative Approach
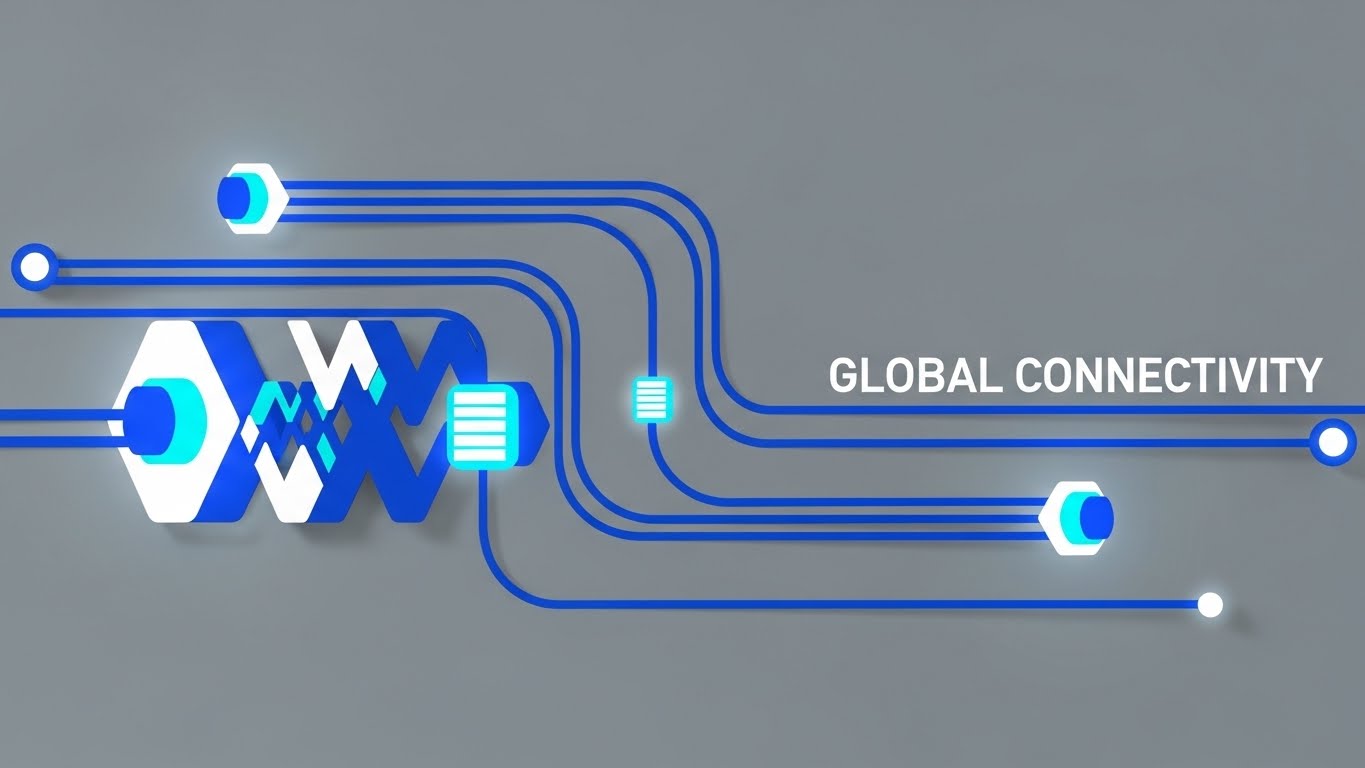
This style utilizes high-key, abstract geometry to visualize "Global Connectivity" without the clutter of physical maps. Rhythmic, pulsating geometric nodes—representing data centers—are connected by smooth, bezier-curved pathways of light. The palette utilizes Vivid Cyan and Electric Blue on a clean Slate Grey background. The narrative focuses on flow: signals travel frictionlessly from left to right, creating a satisfying loop of continuous uptime. The absence of chaotic elements visually reinforces the promise of a stabilized, reliable network environment.
Psychological Impact & KPI Focus
- Niche Psychology: The rhythmic pulsation taps into the brain's preference for predictable patterns, subliminally signaling "system health." It counters the NetOps persona's anxiety regarding network jitter and packet loss by presenting a frictionless ideal.
- Operational Impact: This style effectively simplifies the concept of Global Reach, allowing non-technical stakeholders to grasp the scale of the network without needing to read a topology map.
Strategic Implementation & Trade-offs
- Best Use Case: LinkedIn or Instagram ads (15s) announcing new Points of Presence (PoPs) or general brand awareness campaigns.
- Trade-off: This is an emotional style, not a technical one. It conveys the feeling of reliability but lacks the granularity to explain how the routing works. It is a promise of performance, not a demonstration.
Companies using similar video content -
VMware – Cloud Foundation – Abstract visualization of SDDC layers.
Kentik – Network Observability Cloud – Visualizes global network and cloud data flow.
Aryaka – Global Private Network – Rhythmic flow for worldwide SD-WAN connectivity.
3. Abstract 2D Flat Vector Organic
TOFU | Market Education
The Visual & Narrative Approach
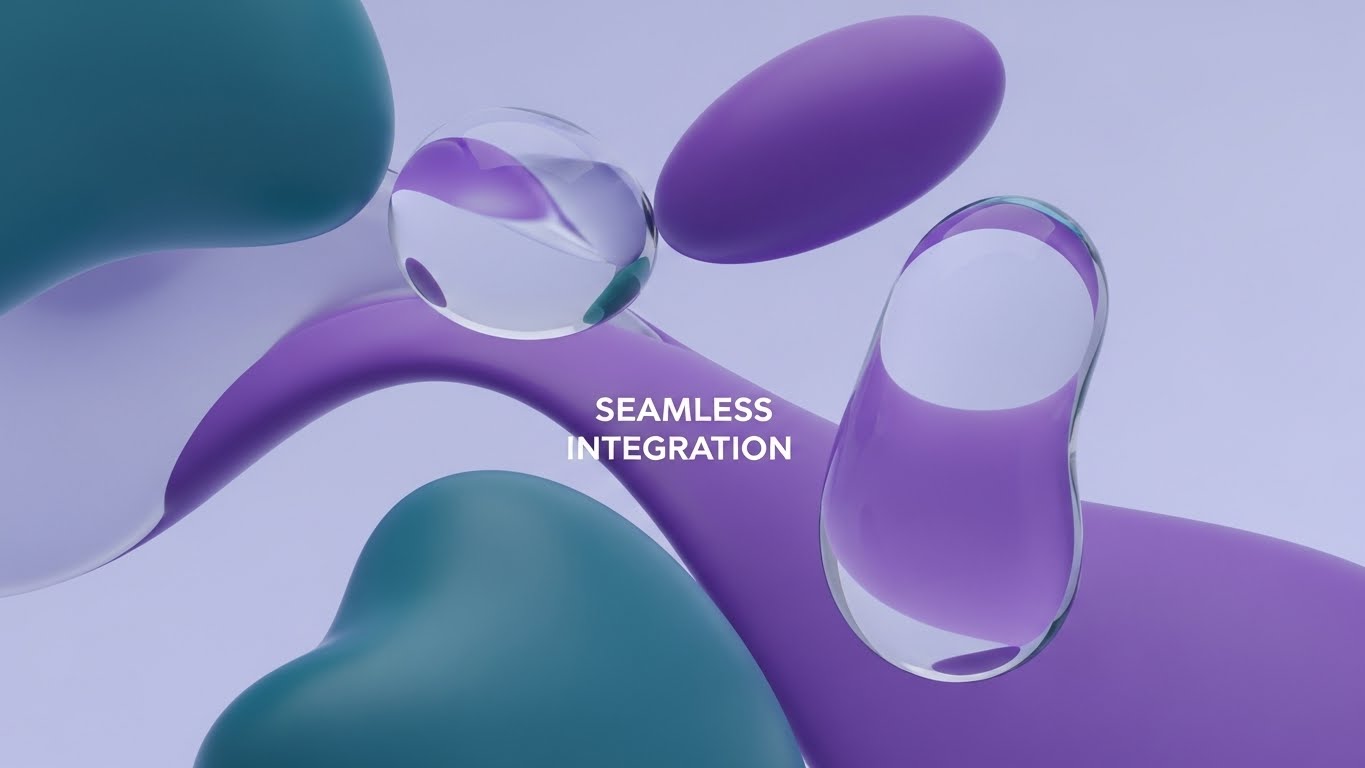
This style visualizes the intangible concept of "Seamless Integration." It uses liquid, blob-like shapes in shades of Teal, Purple, and transparent Glass to represent different data streams or APIs. These shapes merge, separate, and morph with a viscous, glossy fluidity against a Lavender background. The lighting simulates surface reflections (specularity), giving the flat vectors a premium, tangible quality. The narrative is one of adaptability—showing how the platform effortlessly absorbs disparate protocols without friction.
Psychological Impact & KPI Focus
- Niche Psychology: It addresses the pain point of "Vendor Lock-in" or incompatibility. The fluid motion metaphorically proves that the software plays nicely with others (APIs, third-party apps).
- Operational Impact: Visualizes Interoperability. It transforms the complex, often messy reality of API handshakes into a satisfying, smooth visual experience.
Strategic Implementation & Trade-offs
- Best Use Case: Social media posts (Vertical 9:16) highlighting ecosystem partnerships, API capabilities, or "Plug-and-Play" features.
- Trade-off: High abstraction. Without clear text overlays (e.g., "AWS + On-Prem"), the meaning can be lost. It prioritizes mood over specific metrics.
Companies using similar video content -
HashiCorp – Terraform – Fluid animations representing Infrastructure as Code.
Coralogix – Streaming Analytics Pipeline – Merges diverse data streams with organic motion.
Elastic – Observability – Seamlessly integrates logs, metrics, traces.
4. Abstract 3D AI Visualization
TOFU | Vertical Social Organic

The Visual & Narrative Approach
To visualize "AI Intelligence," this style creates a complex, interconnected system of floating particles and glowing nodes. The camera performs a slow fly-through of this "constellation," revealing a central, pulsating "brain" node. The palette of Neon Blue and Laser Red against a White Void suggests high-tech surveillance and anomaly detection. It visualizes the platform not just as a monitor, but as a thinking entity that predicts issues before they occur.
Psychological Impact & KPI Focus
- Niche Psychology: Triggers the "Innovation Bias." Viewers associate high-fidelity 3D particles with cutting-edge processing power and Big Data analytics. It reassures the stakeholder that the system is proactive.
- Operational Impact: Visualizes Predictive Analytics. It gives form to the invisible algorithms that detect anomalies, showing the system "thinking."
Strategic Implementation & Trade-offs
- Best Use Case: Homepage Hero headers or Keynote openers to establish market leadership and premium positioning.
- Trade-off: Resource-intensive to produce. It sets a very high visual standard that the actual product UI must live up to.
Companies using similar video content -
Dynatrace – AI-powered Observability – Visualizes predictive analytics with glowing particles.
BMC Helix – Observability & AIOps – Shows AI agents predicting operational needs.
LogicMonitor – LM Envision – AI-driven insights for hybrid cloud predictability.
5. Bold Kinetic Typography
TOFU | Shaping Brand Perception
The Visual & Narrative Approach
This style abandons imagery for pure impact. Text blocks are rendered as heavy, geometric shapes that crash into the frame with kinetic energy. The palette is aggressive—Hot Pink, Navy Blue, and White—designed to disrupt. Motion blur on the edges conveys "Speed" and "Velocity." The narrative is rhythmic and urgent, mimicking the critical nature of a downtime alert or a rapid response sequence.
Psychological Impact & KPI Focus
- Niche Psychology: The high-speed motion breaks the "banner blindness" of typical B2B advertising. It aligns with the adrenaline of Incident Response teams, validating their need for speed (MTTR).
- Operational Impact: Communicates Real-Time Alerting. It grabs attention in the "Goldfish Economy" of pre-roll ads (first 5 seconds) by signaling urgency.
Strategic Implementation & Trade-offs
- Best Use Case: 6-second Bumper ads or Event Stingers designed to drive immediate curiosity.
- Trade-off: Zero educational value. It is a "shout" designed to get attention, not a "conversation."
Companies using similar video content -
Datadog – Observability – Communicates critical alerts with high-velocity text.
Nagios – XI – Signals urgent IT infrastructure alerts.
SolarWinds – Observability – Disruptive text blocks for critical IT incidents.
6. Isometric 2D Motion Design
TOFU | Skippable Pre-Roll Ad

The Visual & Narrative Approach
Set on a clean orthographic grid, this style depicts a network topology map using hard-edged vector shapes in Charcoal, Soft Yellow, and White. It visualizes a data center layout with tiny server racks, cloud icons, and load balancers connected by active, dotted signal lines. The lighting is flat and even, ensuring no detail is obscured. It transforms the mess of network cabling into a tidy, organized city plan.
Psychological Impact & KPI Focus
- Niche Psychology: The grid structure appeals to the "SysAdmin" need for organization and control. It offers a "God's Eye View" of the infrastructure, reducing the anxiety of the unknown.
- Operational Impact: Ideal for visualizing Asset Discovery and Topology Mapping. It shows the breadth of coverage without visual clutter, reinforcing the "Single Pane of Glass" promise.
Strategic Implementation & Trade-offs
- Best Use Case: "How It Works" pages, documentation, and educational tutorials that require spatial clarity.
- Trade-off: Can feel static. Needs constant element animation (blinking lights, moving packets) to maintain viewer interest.
Companies using similar video content -
Progress – WhatsUp Gold – Orthographic grid mapping network topology.
Auvik – Cloud-based Monitoring – Automated discovery and mapping of network devices.
ManageEngine – OpManager – Tidy, organized view of LAN/WAN environment.
7. Dynamic Data Visualization
TOFU | YouTube

The Visual & Narrative Approach
This style abstracts a dashboard into pure geometry. It uses 3D-extruded bar charts and donut charts in Emerald Green (signaling 100% uptime), White, and Light Grey. The data bars grow and shrink rhythmically, visualizing "Traffic Analysis" without relying on specific numbers. It captures the pulse of the network—spikes, drops, and stable flows—presenting analytics as a living, breathing entity rather than a static report.
Psychological Impact & KPI Focus
- Niche Psychology: The dominance of Emerald Green triggers a psychological "All Systems Go" response. It visually promises success and stability to the operations team.
- Operational Impact: Communicates Actionable Insights. By giving data "volume" (3D), it makes the metrics feel substantial and valuable.
Strategic Implementation & Trade-offs
- Best Use Case: Middle-of-Funnel retargeting ads, whitepaper download prompts, or "Results" slides in sales decks.
- Trade-off: It abstracts the UI. If the user expects to see the actual dashboard interface, this might feel too artistic.
Companies using similar video content -
Kentik – Network Observability Cloud – Analyzes real-time network traffic with 3D metrics.
Catchpoint – Internet Performance Monitoring – Visualizes performance data as a living entity.
Grafana Labs – Grafana Cloud – Dynamic dashboards for real-time metrics and logs.
8. Wireframe to Reality Transition
MOFU | Demand Gen

The Visual & Narrative Approach
A split-screen composition that dramatizes the "Concept to Reality" transition. The left half displays a blueprint wireframe of a network switch in Blue/White lines; the right half reveals the final, glossy Metallic Silver 3D render. A glowing scanning line sweeps across the center, revealing the finished product from the wireframe. This visualizes the engineering precision and the concept of a "Digital Twin."
Psychological Impact & KPI Focus
- Niche Psychology: Appeals to the engineer's respect for the hardware ("The Iron"). It validates that the software understands the physical device deeply, bridging the physical/digital divide.
- Operational Impact: Visualizes Configuration Management. It implies that the software's logical configuration matches the physical reality perfectly.
Strategic Implementation & Trade-offs
- Best Use Case: Product Launch videos, hardware integration highlights, or "Under the Hood" features.
- Trade-off: Requires high-fidelity 3D assets of the specific hardware to be effective.
Companies using similar video content -
VMware – NSX Distributed Firewall – Blueprint transition proving software-defined hardware fidelity.
Juniper Networks – SRX Series Firewalls – Reveals hardware precision from wireframe to render.
Fortinet – FortiGate – Demonstrates engineering precision of network security hardware.
9. 3D X-Ray Visualization
MOFU | Product Differentiation
The Visual & Narrative Approach
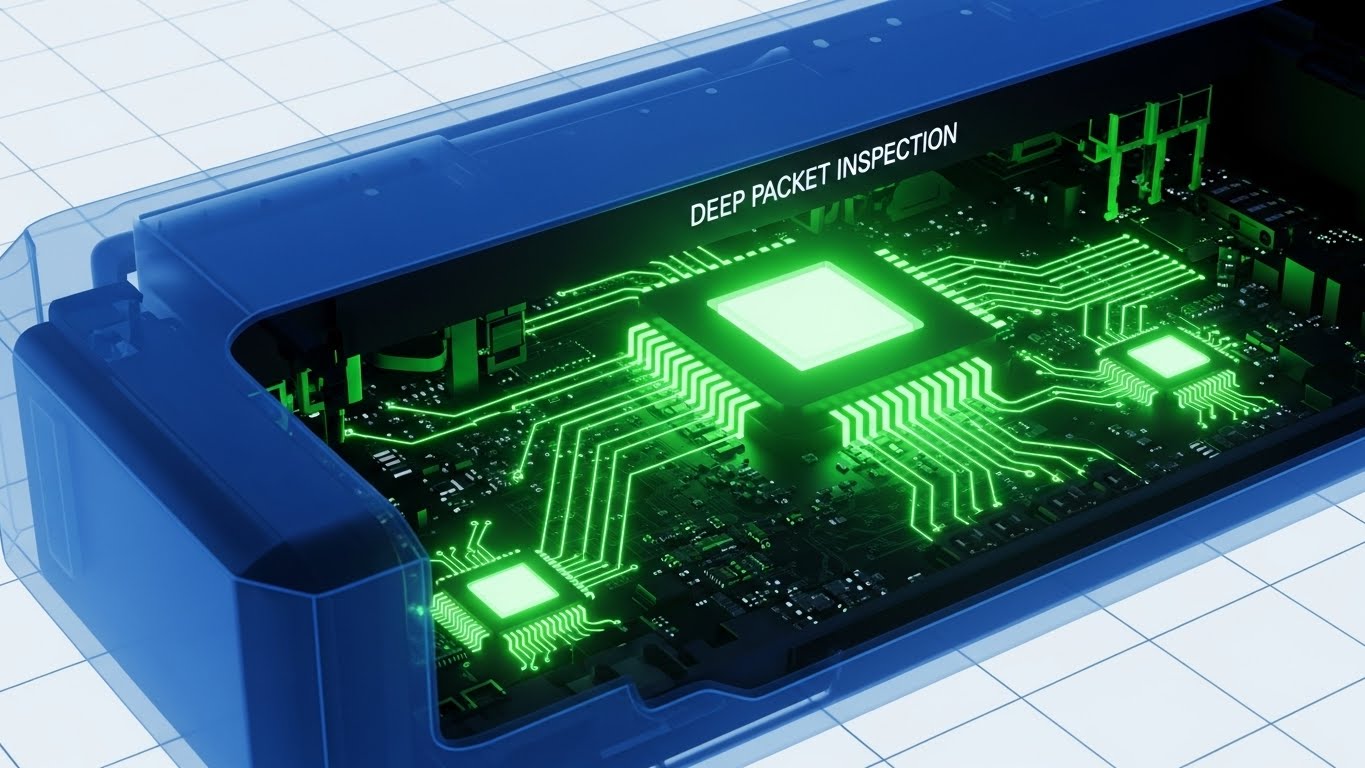
This style visualizes "Deep Packet Inspection" by rendering a network router with a translucent, ghosted Blue outer casing. Inside, we see glowing silicon chips and green data pathways pulsing with activity. It allows the viewer to see inside the box, visualizing the hidden processing power and security scanning that happens at the hardware level. The background is a clinical technical grid.
Psychological Impact & KPI Focus
- Niche Psychology: It addresses the "Black Box" anxiety directly. It tells the viewer, "We have nothing to hide; we see everything." It mimics a medical x-ray, implying forensic-level precision.
- Operational Impact: Perfect for visualizing Security Forensics and Hardware Health. It proves the depth of the platform's capability.
Strategic Implementation & Trade-offs
- Best Use Case: Technical deep-dive webinars, security feature explainers, or whitepaper video summaries.
- Trade-off: Highly technical. It appeals to the practitioner but may alienate non-technical budget holders.
Companies using similar video content -
Palo Alto Networks – PA-Series – Translucent casing revealing deep packet inspection.
F5 – BIG-IP AFM – X-ray view of application security and network defense.
Zyxel – Unified Security Gateway (USG) – Visualizes internal security processing.
11. Aspirational Stock Montage
MOFU | Building Trust

The Visual & Narrative Approach
This style shifts the lens from the server rack to the boardroom. It utilizes high-quality, cinematic stock photography to depict the human outcome of network reliability: a cohesive, successful IT team. The visual features a sunlit, modern glass-walled office where diverse professionals are celebrating a win—symbolizing a successful migration or a quarter of 100% uptime. There are no dashboards or wires visible; the focus is entirely on the emotion of relief and triumph. The warm lighting and "Success" banner subconsciously associate the software with professional victory.
Psychological Impact & KPI Focus
- Niche Psychology: NetOps is often a thankless job where silence is the only praise. This style validates the team's desire for recognition. It reframes the software not as a tool for maintenance, but as a catalyst for career success and team harmony.
- Operational Impact: Visualizes Team Alignment. It suggests that the platform eliminates the "War Room" culture of blame-storming during outages, fostering a collaborative, proactive environment.
Strategic Implementation & Trade-offs
- Best Use Case: "About Us" pages, Careers sections, or as the emotional closing hook in a longer case study video.
- Trade-off: Lacks technical substance. It builds emotional equity but fails to prove capability. It must be paired with technical evidence (like Style 9 or 12) to be credible.
Companies using similar video content -
ManageEngine – Netflow Analyzer – Visualizes data packet movement and traffic flow.
Cisco – Catalyst SD-WAN – Illustrates SD-WAN traffic paths and optimization.
Google Cloud – Monitoring – Shows data flow across cloud infrastructure.
12. Futuristic Neon/Dark Mode
MOFU | Risk Mitigation

The Visual & Narrative Approach
To visualize the critical concept of "Security & Risk Mitigation," this style employs a high-contrast Dark Mode aesthetic, popular in modern command centers. Towering, fortress-like server racks are rendered in Deep Black, illuminated by sharp Neon Green and Cyber-Yellow accents. Floating, glowing shield icons orbit the hardware, symbolizing active threat protection. The low camera angle evokes a sense of grandeur and impenetrability. The narrative is one of vigilance: the system is the sentinel that never sleeps, actively guarding against DDoS attacks and vulnerabilities.
Psychological Impact & KPI Focus
- Niche Psychology: This aesthetic resonates deeply with the "SecOps" persona who equates Dark Mode with serious, professional monitoring tools. The fortress imagery alleviates the anxiety of data breaches and vulnerability.
- Operational Impact: Visualizes Cybersecurity Resilience. It makes the abstract concept of a firewall or "Zero Trust" architecture tangible, reassuring stakeholders that the network is hardened against threats.
Strategic Implementation & Trade-offs
- Best Use Case: Security compliance pages, features regarding "Threat Detection," or background loops for trade show booths.
- Trade-off: Can appear "gaming-centric" if overused. It must maintain a level of sophistication to appeal to enterprise buyers, avoiding overly chaotic "cyberpunk" tropes.
Companies using similar video content -
NinjaOne – Unified IT Management – Celebrates IT team alignment and success.
LogicMonitor – LM Envision – Depicts successful IT operations and team harmony.
New Relic – Observability Platform – Focuses on human outcome of network reliability.
13. Minimalist Flat 2D Vector
MOFU | Competitive Displacement

The Visual & Narrative Approach
This style is a ruthless exercise in simplicity, designed for "Competitive Displacement." It uses a split-screen comparison: the left side depicts a "Competitor" or "Legacy" state as a tangled, chaotic knot of Grey lines (representing high latency and complex routing). The right side shows "Our Solution" as a single, frictionless Vivid Lime Green line cutting straight through the noise. The background is a clean off-white. There are no distractions—only a clear, binary choice between chaos and order.
Psychological Impact & KPI Focus
- Niche Psychology: It plays on the engineer's disdain for inefficiency ("Spaghetti Code" or bad routing). The visual simplicity serves as a metaphor for ease of implementation, promising to untangle their current infrastructure mess.
- Operational Impact: Visualizes Optimization and Efficiency. It instantly communicates the reduction of "Network Jitter" and the streamlining of data packets without needing complex charts.
Strategic Implementation & Trade-offs
- Best Use Case: "Us vs. Them" comparison pages, retargeting ads aimed at users of specific competitor tools, or slide decks pitching replacement.
- Trade-off: Extreme reductionism. It simplifies complex routing problems to a degree that might seem naive to a Level 3 engineer if not supported by data.
Companies using similar video content -
Fortinet – Secure SD-WAN – Glowing shields visualizing zero trust security.
Check Point – Quantum – Neon dark mode for active threat protection.
SentinelOne – DataSet – Dark mode for autonomous security insights.
14. 2D Graphics Over Live Action
MOFU | LinkedIn Video Ads

The Visual & Narrative Approach
This style bridges the gap between the user and the tool by superimposing playful, hand-drawn 2D white "doodles" over professional live-action footage. We see a confident IT Manager standing in a server room; a sketched superhero cape and a chest emblem appear over him. The doodle style is loose and energetic, contrasting with the rigid server racks. The narrative is empowering: the software gives the human operator "superpowers" to see through walls (network visibility) and move faster than light (instant alerts).
Psychological Impact & KPI Focus
- Niche Psychology: It taps into the "IT Hero" narrative. Every SysAdmin wants to be the one who saves the day, not the one who fixes the printer. This style celebrates their role and positions the software as their sidekick.
- Operational Impact: Visualizes Empowerment and Control. It humanizes the B2B relationship, suggesting that the tool enhances the capabilities of the existing team rather than replacing them.
Strategic Implementation & Trade-offs
- Best Use Case: LinkedIn video ads (Vertical or Square) where stopping the scroll requires a mix of human connection and visual novelty.
- Trade-off: Tone sensitivity. It leans towards playful; care must be taken to ensure it doesn't trivialize the serious nature of network management.
Companies using similar video content -
FatPipe – SD-WAN – Demonstrates latency reduction with clear, simple lines.
Adaptiv Networks – Enterprise Connect – Contrasts chaotic legacy with streamlined solution.
Versa Networks – SASE – Visualizes optimized network paths and efficiency.
15. Isometric 3D Workflow
MOFU | The Functional Buyer
The Visual & Narrative Approach
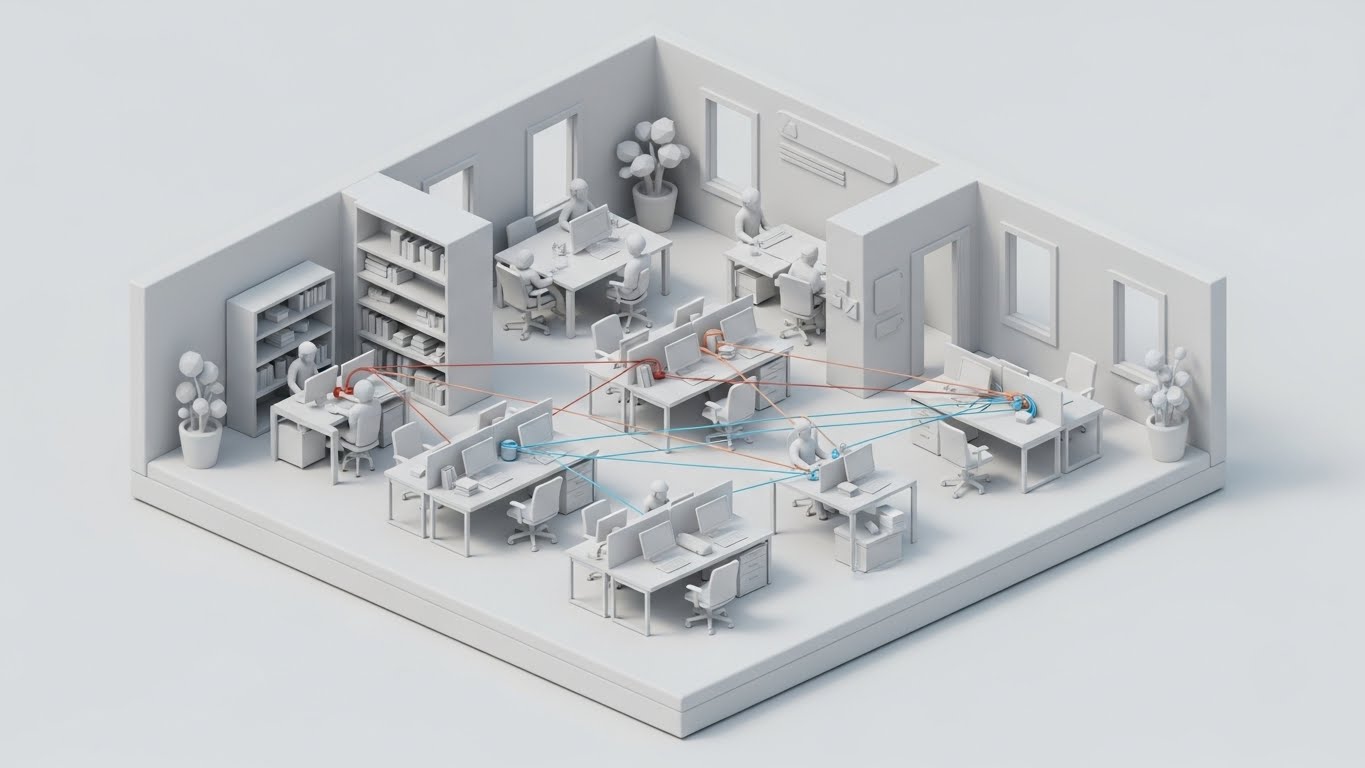
Designed for the "Functional Buyer" who needs to understand the flow, this style uses a pristine "Clay Render" aesthetic. A miniature, isometric diorama of a modern office and data center is rendered in soft White and Light Grey, with connectivity highlighted in Safety Orange and Blue signal lines. The matte finish eliminates distracting reflections. We see the logical connection between employee workstations, local switches, and the cloud. It is a clean, architectural view of the LAN/WAN environment.
Psychological Impact & KPI Focus
- Niche Psychology: The organized, clean aesthetic appeals to the desire for structure and order. It visualizes the network not as a chaotic mess of cables, but as a perfectly designed ecosystem.
- Operational Impact: Visualizes End-to-End Visibility. It clearly demonstrates how the platform monitors traffic from the individual endpoint (the desk) to the core network, validating the "Full Stack" promise.
Strategic Implementation & Trade-offs
- Best Use Case: Product pages explaining "LAN Monitoring" or "Wi-Fi Mapping" features.
- Trade-off: Can feel detached. The "toy-like" quality makes complex infrastructure look simple, which is good for explaining concepts but less effective for conveying scale.
Companies using similar video content -
ManageEngine – Site24x7 – Hand-drawn cape emphasizing the IT hero.
SolarWinds – Observability – Superimposes playful graphics over IT professionals.
Auvik – Cloud-based Monitoring – Empowers human operators with network superpowers.
16. Photorealistic 3D Renders
BOFU | ROI Justification

The Visual & Narrative Approach
As we approach the purchase decision, the focus shifts to value. This style features a hyper-realistic 3D render of a premium Silver laptop on a mahogany executive desk. The screen displays a high-fidelity dashboard showing "Growth" curves in Gold and Silver against a dark background. Reflections of a city skyline on the screen surface imply a high-stakes corporate environment. The visual says "Premium," "Reliable," and "C-Suite Ready."
Psychological Impact & KPI Focus
- Niche Psychology: This speaks directly to the Economic Buyer (CFO/CTO). It moves away from the "plumbing" of the network to the "business value" of uptime. It validates the software as a strategic asset, not just an operational expense.
- Operational Impact: Visualizes ROI and Business Intelligence. It focuses on the output of the monitoring (growth, stability) rather than the input (packets, logs).
Strategic Implementation & Trade-offs
- Best Use Case: Pricing pages, Investor decks, or the "Benefits" section of a proposal.
- Trade-off: It is static. This style excels as a "Hero Image" or a slow-pan video shot but offers little in terms of explaining how the software works.
Companies using similar video content -
HPE Aruba Networking – EdgeConnect SD-WAN – Clarifies office connectivity in a clay render.
Cisco Meraki – Cloud-Managed Networking – Organized isometric view of LAN/WAN.
Ubiquiti – UniFi – Pristine diorama of office network infrastructure.
17. Rapid UI Feature Montage
BOFU | Sales Cycle Acceleration
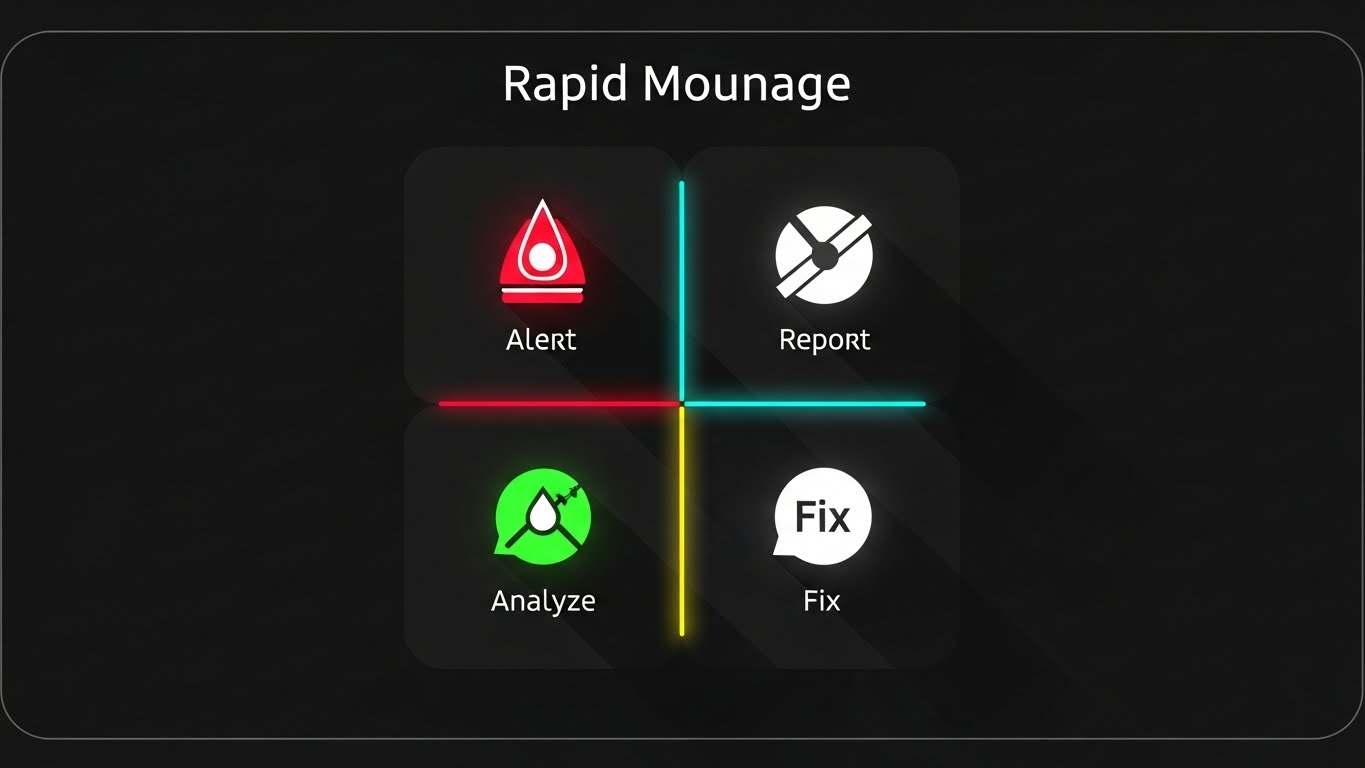
The Visual & Narrative Approach
Designed to accelerate the sales cycle by showcasing breadth, this style uses a rapid-fire montage technique. The frame is split into quadrants, each housing a simplified, flat-design icon representing a core module: "Alert" (Red), "Report" (White), "Analyze" (Green), and "Fix" (White). The motion is snappy and rhythmic, cycling through different features in sync with a fast-paced beat. It creates a visual checklist, confirming that the platform covers every base.
Psychological Impact & KPI Focus
- Niche Psychology: It addresses the "Fear Of Missing Out" (FOMO) on features. The comprehensive grid assures the buyer that this is an "All-in-One" platform, negating the need for multiple point solutions.
- Operational Impact: Visualizes the Incident Response Lifecycle. By showing Alerting, Analysis, and Remediation in one view, it reinforces the speed of the MTTR (Mean Time To Resolution) cycle.
Strategic Implementation & Trade-offs
- Best Use Case: Retargeting social ads (Instagram/LinkedIn) aimed at prospects who have visited the pricing page but haven't converted.
- Trade-off: Depth sacrifice. It lists features but doesn't explain them. It relies on the viewer having prior context.
Companies using similar video content -
Microsoft – SCOM – Executive dashboard proving ROI growth.
IBM – Instana Observability – Hyper-realistic render of business value dashboard.
NetApp – OnCommand Insight – Premium visual for infrastructure ROI justification.
18. Split Screen: Optimized Reality and UI
BOFU | The Economic Buyer
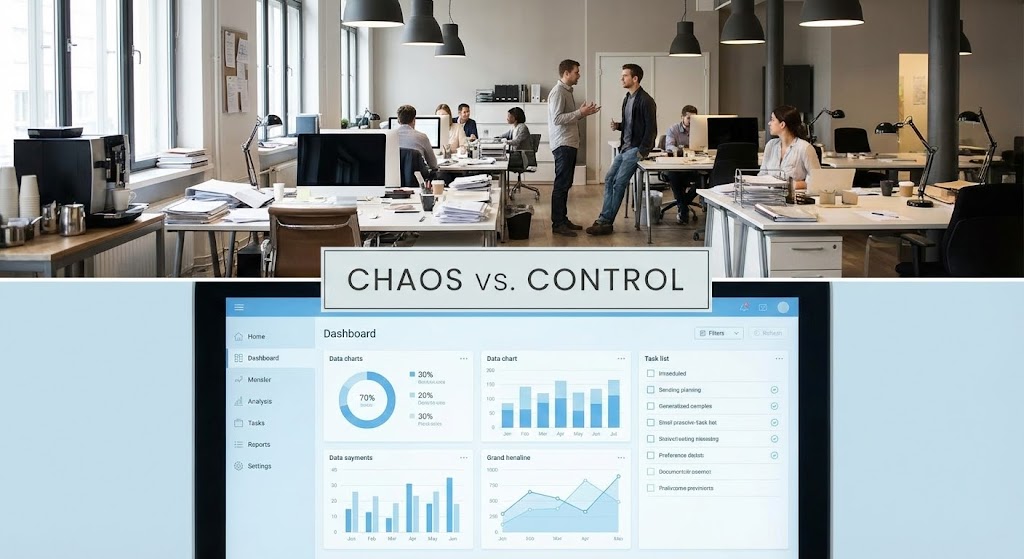
The Visual & Narrative Approach
This style forces a direct confrontation between the problem and the solution. A horizontal split-screen places a slightly chaotic, muted office environment (representing the physical reality of unmanaged IT) on top, and a crisp, organized Light Blue UI dashboard on the bottom. The narrative is clear: The software (bottom) is the anchor that stabilizes the physical chaos (top). The lighting reinforces this, with the UI appearing as a source of clarity.
Psychological Impact & KPI Focus
- Niche Psychology: It visually validates the Manager's feeling of being overwhelmed (Chaos) and offers them the specific antidote (Control). It connects the abstract software interface directly to the physical peace of mind in the office.
- Operational Impact: Visualizes Situational Awareness. It shows how digital data creates physical order, directly addressing the "Physical/Digital Divide."
Strategic Implementation & Trade-offs
- Best Use Case: Case study videos or "Problem/Solution" sections on the homepage.
- Trade-off: Requires careful balance. The "Chaos" side shouldn't look incompetent, just busy. The "Control" side must look accessible, not complex.
Companies using similar video content -
Datadog – Observability – Rapid-fire montage emphasizing suite capability.
Splunk – Observability Cloud – Feature quadrant showcasing unified platform.
New Relic – Observability Platform – Visual checklist of comprehensive features.
19. Low-Poly 3D Modeling
BOFU | Objection Handling

The Visual & Narrative Approach
To handle objections regarding complexity, this style uses a friendly, Low-Poly 3D aesthetic. A floating isometric island depicts a simplified network infrastructure with blocky servers and pastel-colored data paths (Soft Pink, Mint, Sky Blue). The absence of complex textures and the playful geometry make the intimidating concept of "Microservices Architecture" or "Kubernetes Clusters" appear manageable and modular.
Psychological Impact & KPI Focus
- Niche Psychology: Complex architectures (like Hybrid Cloud) can scare off buyers who fear a difficult implementation. This style lowers the barrier to entry, subliminally saying, "This is easy to build and manage."
- Operational Impact: Visualizes Scalability and Modularity. It shows the network as a set of building blocks, reinforcing the ease of adding new nodes or scaling up.
Strategic Implementation & Trade-offs
- Best Use Case: Documentation, onboarding videos, or technical FAQs addressing implementation ease.
- Trade-off: Can seem "imprecise" to hardcore engineers. It is a metaphor for architecture, not a schematic for deployment.
Companies using similar video content -
OpenText – AI Operations Management – Contrasts chaotic IT with organized UI control.
BMC Helix – Observability & AIOps – Split-screen showing physical chaos vs. digital order.
LogicMonitor – LM Envision – Stabilizes physical reality with clear UI dashboard.
20. Generative AI Realistic Character Video
BOFU | Driving Demo Requests

The Visual & Narrative Approach
At the bottom of the funnel, the human connection is paramount. This style utilizes a high-fidelity Generative AI character—a professional female IT Director—looking directly at the camera. She is lit with "Rembrandt" style portrait lighting in a soft-focus office. She acts as a virtual concierge, personally inviting the viewer to book a demo or explaining a final technical nuance. The realism builds trust, while the direct eye contact demands a response.
Psychological Impact & KPI Focus
- Niche Psychology: People buy from people. Even a virtual persona triggers the social obligation to listen. It simulates the experience of a high-touch Customer Success Manager, reassuring the buyer they won't be left alone after purchase.
- Operational Impact: Visualizes Support and Expertise. It serves as the face of the vendor's support team, promising that expert help is always available.
Strategic Implementation & Trade-offs
- Best Use Case: Personalized email video follow-ups, Chatbot video bubbles, or the "Thank You" page after a whitepaper download.
- Trade-off: The "Uncanny Valley." The AI generation must be of the highest quality (Sync, expression, lighting) or it will damage trust. It is better to use a real actor if the AI quality is not photorealistic.
Companies using similar video content -
SigNoz – OpenTelemetry-Native Observability – Simplified infrastructure demystifying microservices.
Chronosphere – Observability Platform – Low-poly view of cloud-native distributed systems.
VictoriaMetrics – Time Series Database – Presents scalable monitoring as building blocks.
21. Clean UI Workflow (Light Mode)
Onboarding | Driving Freemium/Trials
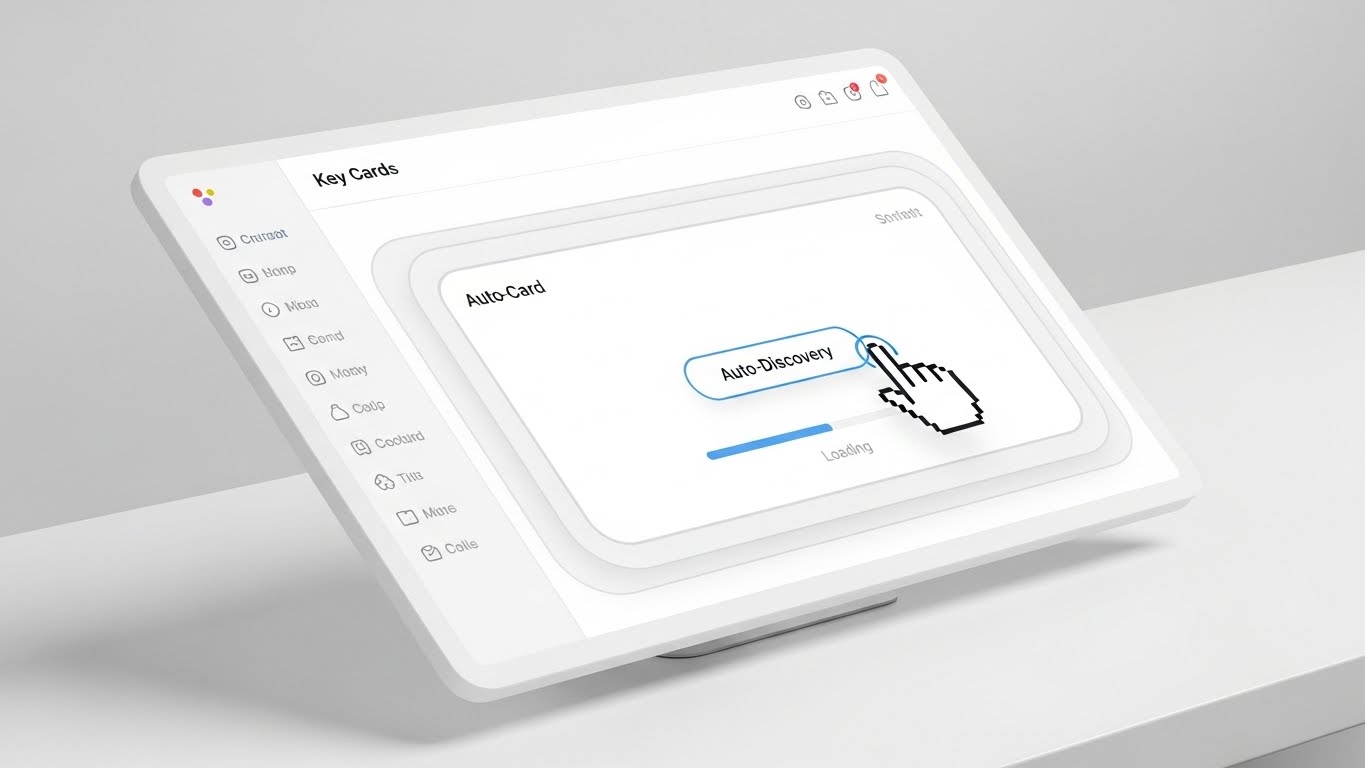
The Visual & Narrative Approach
This style is the visual definition of "Zero Friction." It utilizes a pristine, shadowless "Light Mode" aesthetic to showcase the initial setup phase. The composition features a straight-on view of a floating modal window on a Sky Blue and Cloud White background. The UI elements—simplified blocks representing "Sign Up" or "Auto-Discovery"—are clean and airy. The animation is smooth and linear; a cursor clicks "Connect," and a loading bar fills instantly. It visually promises that the complex task of mapping a network is just one click away.
Psychological Impact & KPI Focus
- Niche Psychology: Network engineers dread the "Setup Tax"—the weeks of manual configuration required by legacy tools. This aesthetic calms that anxiety by projecting simplicity and modernity. It signals that the software is "Cloud Native" and does the heavy lifting for the user.
- Operational Impact: Visualizes Time-to-Value (TTV). By stripping away the density of the actual dashboard for this specific beat, it focuses entirely on the ease of entry, directly impacting "Sign-Up to First Action" conversion rates.
Strategic Implementation & Trade-offs
- Best Use Case: "Start Free Trial" landing pages, welcome emails, or the very first screen of the installation wizard.
- Trade-off: It is idealized. It represents the process of setting up, not the depth of the final data analysis. It must be followed quickly by value delivery (data visualization) to avoid feeling "empty."
Companies using similar video content -
Cisco – Customer Success – Virtual expert inviting direct engagement.
IBM – Consulting Services – AI character explaining technical nuances.
Dynatrace – Observability Platform – Realistic AI persona for expert support.
22. 2D Character-Driven Story
Onboarding | Accelerating Time-to-Value

The Visual & Narrative Approach
To humanize the technical onboarding process, this style introduces a stylized 2D character—a relatable IT professional in a casual hoodie. The illustration style uses flat shading with a calming palette of Pastel Blue, Soft Yellow, and Charcoal. The character interacts with a tablet device, displaying a large, satisfying Green "Check" mark. The animation loops through his reaction: a smile of relief and a "thumbs up." This isn't about the server specs; it's about the feeling of a job well done.
Psychological Impact & KPI Focus
- Niche Psychology: It validates the user's emotional journey. IT staff often feel isolated in their struggles. Seeing a character mirror their desired outcome (a stable, checked-off system) builds a subconscious bond with the brand. It represents the "Aha!" moment.
- Operational Impact: Visualizes User Satisfaction. It reinforces the "Happy Path" in the user journey, encouraging new users to push through the initial learning curve to reach that moment of validation.
Strategic Implementation & Trade-offs
- Best Use Case: Empty State screens (e.g., "No Alerts Found"), "Success" modals after completing a tutorial, or congratulatory emails.
- Trade-off: Tone sensitivity. If the art style is too juvenile, it can undermine the seriousness of enterprise software. The character design must remain professional, even if stylized.
Companies using similar video content -
Auvik – Cloud-based Monitoring – Frictionless entry accelerating network discovery.
ManageEngine – Site24x7 – Pristine light mode for initial setup.
Grafana Labs – Grafana Cloud – Smooth workflow for quick monitoring setup.
23. Holographic UI over 3D Render
Onboarding | Reducing Implementation Friction
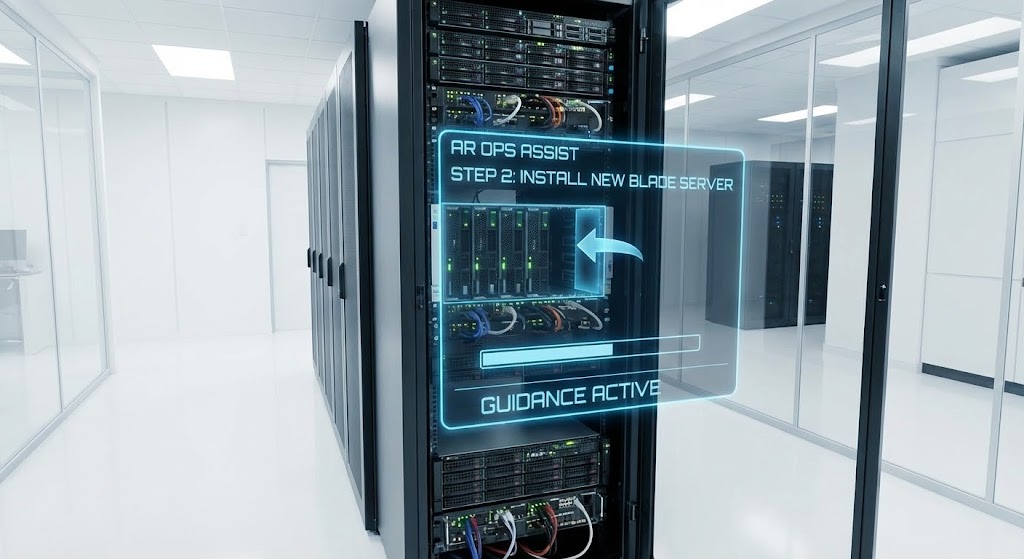
The Visual & Narrative Approach
This style bridges the physical and digital worlds to explain "Implementation." A realistic 3D render places the viewer in a pristine, white laboratory server room. Overlaid on the physical server rack is a glowing, transparent Blue "Heads-Up Display" (HUD). This holographic UI guides the installation of a new blade server, with arrows and progress bars floating in 3D space. It mimics the concept of Augmented Reality (AR) Ops, showing exactly how the software interacts with the hardware.
Psychological Impact & KPI Focus
- Niche Psychology: It appeals to the "Futurist" in every engineer. It reframes the mundane task of racking and stacking servers as a high-tech, guided operation. It alleviates the fear of physical configuration errors.
- Operational Impact: Visualizes Guided Remediation. It suggests that the platform doesn't just alert you to a problem; it guides your hand in fixing it, acting as a virtual expert standing next to you in the data center.
Strategic Implementation & Trade-offs
- Best Use Case: Feature announcements for "Smart Hands" support, hardware compatibility guides, or trade show loops emphasizing "Physical/Digital Integration."
- Trade-off: High production cost. It requires high-fidelity modeling of both the environment and the UI to avoid looking like a "gimmick."
Companies using similar video content -
NinjaOne – Unified IT Management – User success celebrating first value.
Progress – WhatsUp Gold – Relatable character achieving network visibility.
SolarWinds – Observability – Humanizes onboarding with character-driven success.
24. 2D Animation & UI Composition
Onboarding | Self-Serve Onboarding
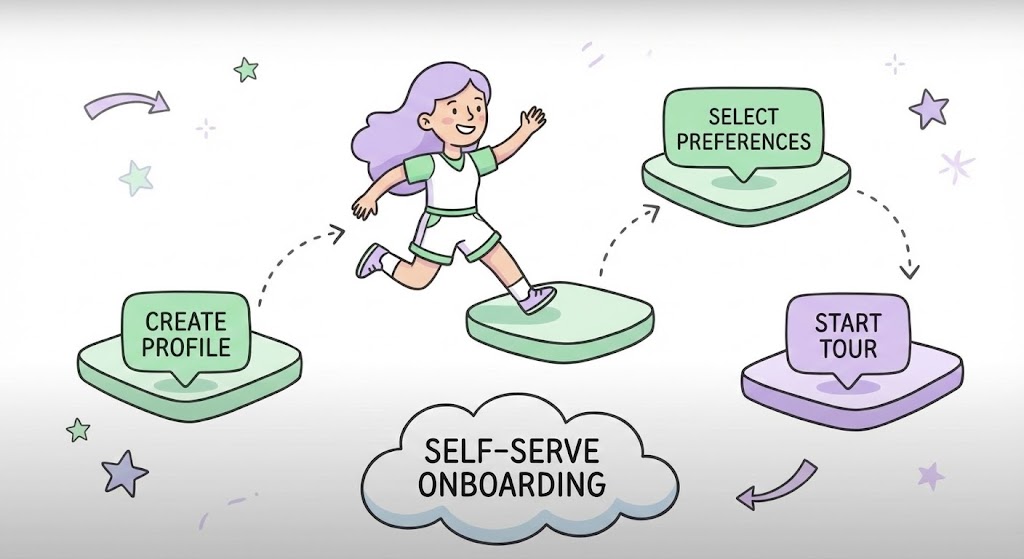
The Visual & Narrative Approach
This style gamifies the "Self-Serve" process. It features a playful, stylized female character jumping between floating UI "platforms" (nodes) like a video game level. The nodes represent steps: "Create Profile," "Select Preferences," and "Start Tour." The palette is soft and inviting—Lavender, Mint Green, and White. The motion is bouncy and fluid. It transforms a boring checklist into a dynamic journey of progression, making the user feel like they are "leveling up."
Psychological Impact & KPI Focus
- Niche Psychology: By borrowing visual tropes from gaming, this style triggers the dopamine reward system. It reframes "Training" as "Play," significantly reducing the mental resistance to learning a new tool.
- Operational Impact: Visualizes Progression and Completion. It clearly maps out the onboarding steps, reducing the drop-off rate by showing the user exactly where they are and how close they are to the finish line.
Strategic Implementation & Trade-offs
- Best Use Case: Interactive "Getting Started" checklists within the app, or educational videos explaining the learning path.
- Trade-off: Tone management is critical. It works excellent for "How-To" and "Onboarding," but should not be used for critical "System Failure" alerts where gravity is required.
Companies using similar video content -
VMware – NSX – AR guidance bridging physical and digital ops.
Cisco – Network Services – Holographic UI for guided hardware installation.
HPE Aruba Networking – EdgeConnect – AR overlay for network device implementation.
25. Hyper-lapse Stock Footage with Data
Retention | Website Visitor Re-engagement

The Visual & Narrative Approach
To visualize "Continuous Uptime" and "Global Scale," this style uses high-energy hyper-lapse stock footage. We see a long-exposure view of a city highway at night, where car headlights become streaks of light. Superimposed on this organic flow are glowing digital data streams in Cyan and White, shooting up into the cloud. The synergy between the physical traffic and the digital data implies that the network is the invisible infrastructure powering the city.
Psychological Impact & KPI Focus
- Niche Psychology: It taps into the grandeur of the "Smart City." For a NetOps leader, it validates the importance of their work—they aren't just managing cables; they are keeping the world moving. It creates a sense of momentum and scale.
- Operational Impact: Visualizes High-Throughput Performance. The fast motion suggests low latency and high speed, reinforcing the platform's ability to handle massive data volumes without choking.
Strategic Implementation & Trade-offs
- Best Use Case: Background headers for "Status Pages," waiting rooms for webinar streams, or high-energy social ads (Stories/Reels) targeting retention.
- Trade-off: It is generic. Since it uses stock footage, it doesn't show the product interface. It builds mood, not understanding.
Companies using similar video content -
Datadog – Observability – Interactive progression encouraging self-serve.
New Relic – Observability Platform – Gamified UI for learning platform features.
Splunk – Observability Cloud – Transforms onboarding into a dynamic journey.
26. Macro UI Micro-Interactions
Retention | Knowledge Base

The Visual & Narrative Approach
This style focuses on the beauty of the "Micro-interaction." It features an extreme close-up (macro) view of a single UI element: a toggle switch labeled "One-click fix." The background is a blurred field of icons, keeping the focus razor-sharp on the action. As the toggle slides from Grey to Vivid Green, we see a subtle burst of light particles. The lighting emphasizes the tactile, glossy texture of the button. It celebrates the simplicity of the solution.
Psychological Impact & KPI Focus
- Niche Psychology: Engineers appreciate precision. By zooming in, the brand communicates that it cares about the details—the "fit and finish" of the tool. It implies that if the buttons are this well-designed, the backend code must be equally robust.
- Operational Impact: Visualizes Ease of Remediation. It reinforces the promise of "One-Click" solutions, directly countering the fear of complex, command-line troubleshooting.
Strategic Implementation & Trade-offs
- Best Use Case: "New Feature" tooltips, release note videos, or GIFs in the Help Center documentation.
- Trade-off: Limited scope. It is excellent for highlighting one specific function but cannot explain a complex workflow.
Companies using similar video content -
Catchpoint – Internet Performance Monitoring – Global velocity visualizing continuous connectivity.
Kentik – Network Observability Cloud – High-energy hyper-lapse for network performance.
Cloudflare – Network Services – Visualizes global network powering the internet.
28. Dark Mode UI Showcase
Expansion | Driving Deep Feature Adoption
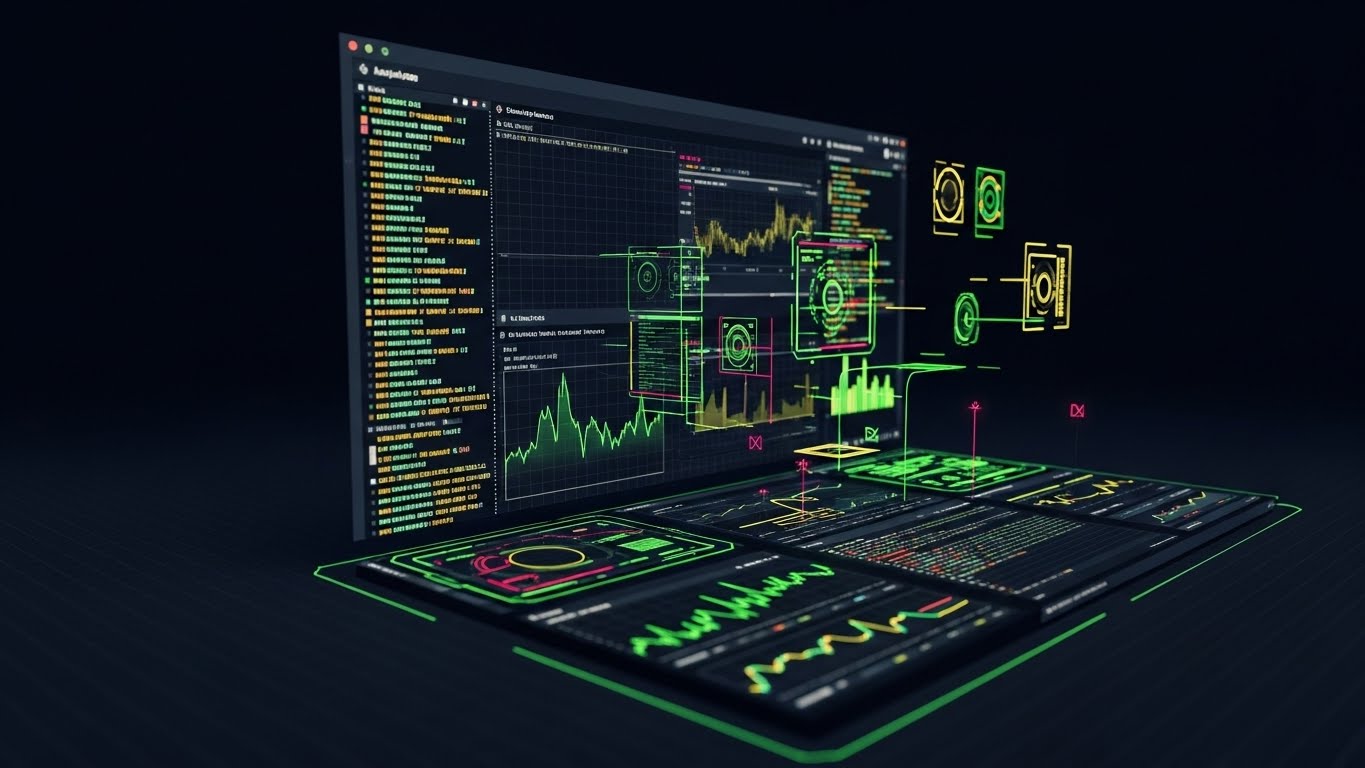
The Visual & Narrative Approach
As users mature, they demand more power. This style showcases the "Pro" environment: a sophisticated Dark Mode dashboard. The palette uses deep Charcoal and Midnight Blue backgrounds with sharp, neon data visualizations in Crimson and Gold. The screen is angled to show depth, displaying complex terminal command lines and code snippets alongside graphical charts. This is the cockpit for the "Power User"—the Level 3 engineer who needs raw data and total control.
Psychological Impact & KPI Focus
- Niche Psychology: Dark Mode is the preferred aesthetic for developers and ops teams working late hours or in low-light Network Operations Centers (NOCs). It signals "Professional Grade." It says, "This tool is built for the experts."
- Operational Impact: Visualizes Advanced Analytics and Scripting. It highlights the platform's extensibility and depth, encouraging users to move beyond basic monitoring into code-level debugging.
Strategic Implementation & Trade-offs
- Best Use Case: "Pro Tips" video series, advanced certification course materials, or upsell pages for Enterprise tiers.
- Trade-off: Intimidating to novices. It should be targeted carefully at existing users ready to upgrade, not fresh leads who might find the complexity overwhelming.
Companies using similar video content -
ManageEngine – OpManager – Precision interaction streamlining knowledge base.
LogicMonitor – LM Envision – Macro UI for ease of remediation.
Dynatrace – Observability – Celebrates simplicity of one-click solutions.
29. 3D Parallax UI Presentation
Expansion | Driving Upsell/Cross-sell
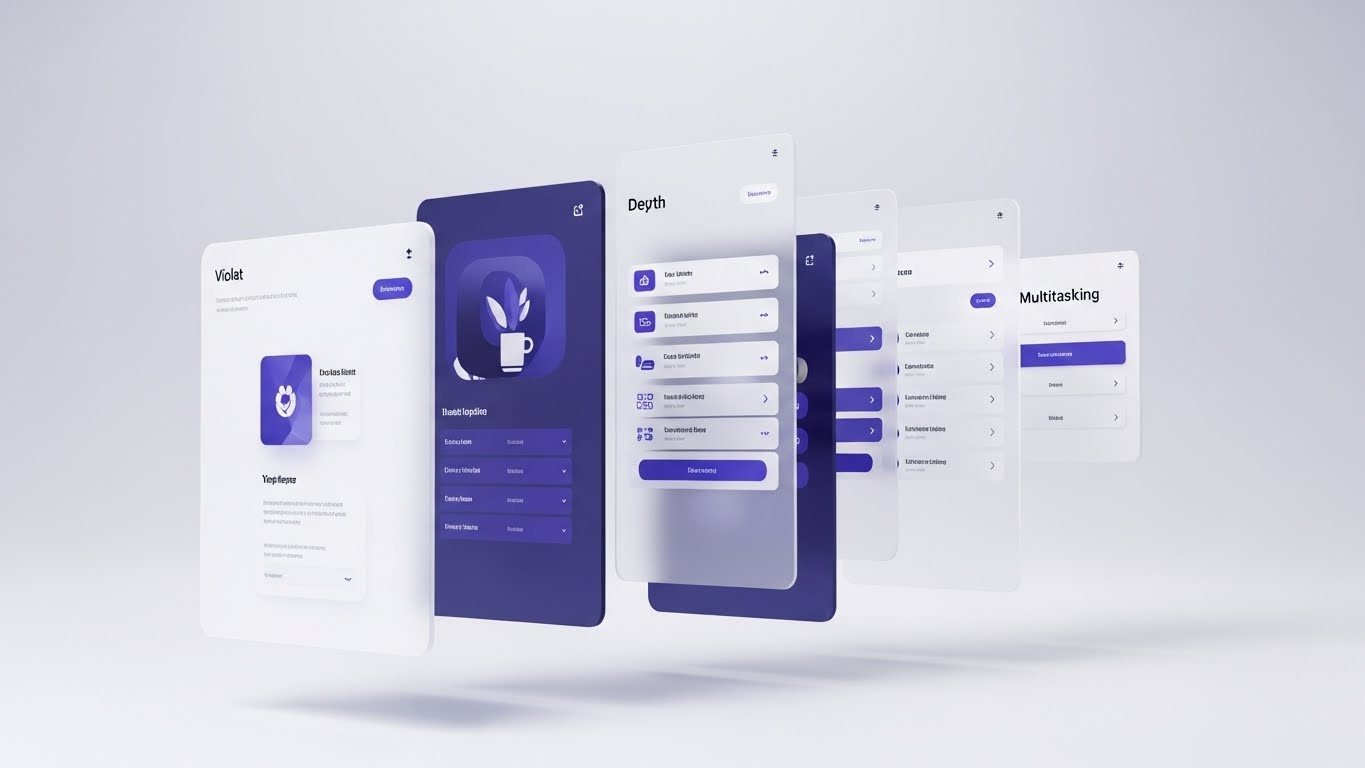
The Visual & Narrative Approach
To visualize the "Suite" capability, this style uses 3D parallax layering. Multiple semi-transparent UI screens float in a bright, white 3D space, arranged one behind the other like sheets of glass. The camera tracks sideways, revealing the depth of the stack. The front layer might show a simple dashboard, while the back layers reveal deeper configuration menus and API integrations. The colors are sophisticated—Violet, White, and Soft Grey. It visually represents the "Depth" of the platform.
Psychological Impact & KPI Focus
- Niche Psychology: It triggers curiosity. The "hidden" layers behind the front screen suggest there is more to discover. It visually handles the objection that the tool is "just a simple monitor" by showing the architectural depth behind the scenes.
- Operational Impact: Visualizes Multitasking and Integration. It implies that the platform handles multiple concurrent streams of data and logic without cluttering the primary view.
Strategic Implementation & Trade-offs
- Best Use Case: "Platform Overview" videos for investors or decision-makers, showing the comprehensive nature of the solution stack.
- Trade-off: Abstract. It is a metaphor for depth, not a literal demonstration of how to navigate the menus.
Companies using similar video content -
Grafana Labs – Grafana Cloud – Visualizes historical performance and trends.
Thanos – Prometheus Long-Term Storage – Displays long-term metrics for trend analysis.
Amazon Web Services – CloudWatch – Analyzes historical data for performance insights.
30. Lifestyle Stock with UI Overlay
Expansion | Driving Referrals & Advocacy

The Visual & Narrative Approach
The final style brings the technology home. We see a high-quality lifestyle shot of a professional working at a standing desk in a bright, plant-filled home office. The lighting is natural and organic. Floating in the air above their mechanical keyboard is a subtle, futuristic UI hologram displaying "Flow State" metrics and stable network graphs. The user looks calm and focused. This visualizes the ultimate benefit of the software: peace of mind and the ability to work effectively from anywhere.
Psychological Impact & KPI Focus
- Niche Psychology: It connects the software to the user's personal quality of life. A stable network means no late-night panic calls. This style builds advocacy by associating the brand with a balanced, modern professional lifestyle.
- Operational Impact: Visualizes Remote Management. It proves that the "Single Pane of Glass" is portable, empowering the user to maintain control without being tethered to a dark data center.
Strategic Implementation & Trade-offs
- Best Use Case: Customer testimonials, "Community" pages, or referral program campaigns.
- Trade-off: Needs to feel authentic. If the hologram looks too sci-fi, it breaks the immersion. It must look like a natural extension of the workflow.
Strategic Knowledge Base: The Visual Operations Doctrine
To transform these 30 visual styles from "creative assets" into a "business engine," we must move beyond production and focus on integration. The following framework provides the strategic doctrine for deploying these visuals to drive Adoption, Efficiency, and ROI in the Network Monitoring domain.
Strategic Alignment & Visual Architecture
The "Pre-Production" Strategy: Defining the Visual Operating System
For Network Operations, visual consistency is not just an aesthetic choice; it is an operational safety requirement. When an alert flashes red in the dashboard, the corresponding training video must not use red as a decorative background color.
- The Cognitive Load Audit: Before production, audit the complexity of the task (e.g., BGP Routing). If a concept takes 500 words to explain textually, prioritize Style 26 (Macro UI) or Style 2 (Line Art). Visuals are compression algorithms for complex data; use them to reduce the "Time to Understanding" for your users.
- Role-Based Visual Mapping: Differentiate your visual language. Use "Glanceable" styles (Style 1, 16) for Executive Reporting to convey health and ROI in seconds. Conversely, use "High-Density" styles (Style 9, 28) for NetOps Engineers who need to interrogate the data. One style does not fit all.
- The "Glanceability" Standard: In a Network Operations Center (NOC), a visual must be understood in <2 seconds. Styles like Abstract Motion (Style 1) and Kinetic Type (Style 5) serve this "Peripheral Awareness" function, alerting teams without demanding deep focus.
- Brand Voice Consistency: A fragmented visual identity (e.g., mixing Cartoon styles with Photorealism randomly) erodes trust. Define a "Visual Kernel"—is your brand the "Friendly Helper" (Styles 22, 24) or the "Military-Grade Commander" (Styles 12, 28)? Stick to the lane.
- The Advids Strategic Audit: Leverage partners like Advids to define this "Visual Lexicon" early. We help map your specific user personas to the appropriate visual styles, ensuring that every asset—from a 6-second bumper to a 60-minute webinar—reinforces the same mental model of your platform.
- Standardization vs. Customization: For core infrastructure concepts (Routers, Switches), use standardized, recognizable icons (Style 6). For unique value propositions (AI Prediction), use bespoke, abstract visualizations (Style 4) to differentiate from competitors.
- The Cross-Departmental Bridge: Use visuals to unify terminology. If Sales calls it "Global Reach" (Style 1) and Engineering calls it "WAN Topology" (Style 6), the visual representation should be the Rosetta Stone that links the two concepts, creating a shared language across the organization.
- Legacy System Integration: Use Style 8 (Wireframe to Reality) to visually bridge the gap between legacy on-premise hardware and your modern SaaS interface. This validates the customer's existing investment while showing the path to modernization.
- Accessibility in Operations: Motion graphics must be accessible. Ensure high contrast (Style 13) and clear typography (Style 5) for users with visual impairments. A "Dark Mode" option (Style 28) is not just aesthetic; it is an accessibility requirement for low-light NOC environments.
- The Mobile-First Mandate: NetOps happens on the go. All 30 styles must be legible on a vertical mobile screen (Style 3) for engineers in the field. If a visualization relies on tiny text (Style 16), it fails the "3 AM Alert on a Smartphone" test.
Operational Adoption & Implementation
The "Deployment" Phase: Embedding Visuals into the Workflow
A visual asset only generates value if it is embedded into the user's daily workflow. This segment focuses on moving video out of the "Marketing Folder" and into the "Product."
- Overcoming "Big Brother" Anxiety: Monitoring tools can trigger anxiety about surveillance. Use empathy-driven styles like Style 11 (Team Alignment) and Style 30 (Lifestyle) to frame the software as a tool for "Empowerment" and "Safety," not policing.
- The Micro-Learning Shift: No one reads the PDF manual. Replace documentation with a library of 15-second clips using Macro UI loops (Style 26) and Step-by-Step animations (Style 24). Embed these directly in the software tooltip to reduce "Time-to-Competency."
- Just-in-Time Support: Replace 50-page PDF manuals with a library of 15-second clips. Embed Style 26 (Macro UI) loops directly into dashboard tooltips. When a user hovers over a complex setting, a visual answer should appear instantly. This correlates directly to a reduction in Level 1 support tickets.
- Gamification of Training: Utilize Style 24 (Gamified UI) for certification programs. Visualizing progress bars and "Level Ups" increases training completion rates significantly compared to static slides.
- Reducing Support Ticket Volume: There is a direct correlation between proactive visual guides and lower support costs. By deploying Troubleshooting Animations (Style 26) for common issues, you deflect Tier 1 tickets, freeing up human agents for complex problems.
- Remote Onboarding: For distributed teams, use Style 23 (Holographic UI) and Style 15 (Isometric Workflow) to provide a spatial understanding of the network architecture. This "Digital Mentorship" allows new hires to grasp the topology without needing a senior engineer to be physically present.
- Visualizing SOPs: Transform text-based Standard Operating Procedures (SOPs) into visual process flows (Style 17). In a crisis, a visual flow is followed faster and more accurately than a text checklist, reducing the risk of human error during outages.
- Feedback Loops: Use interactive video elements (Style 22) to gather user feedback. A "Thumbs Up/Down" interaction at the end of a help video provides data on content effectiveness.
- Scalable Localization: Network teams are global. Visuals like Abstract Motion (Style 1) and Device Simulations (Style 16) rely less on text and more on universal symbols, making localization cheaper and faster.
- Leadership Communication: CTOs need to justify budget. Provide them with High-Fidelity ROI Renders (Style 16) and Traffic Analysis (Style 7) videos that they can drop into Board presentations to visually demonstrate the network's value to the business.
Measuring Impact & Future-Proofing
The "ROI" Phase: Quantifying Success and Looking Ahead
How do you measure the ROI of a visual style guide? You move beyond "View Counts" to "Business Outcomes."
- Beyond "Views" - Measuring Competency: Do not measure video success by "views." Measure it by "Feature Adoption Rate." Did the user click "Try Now" after the Micro-Interaction video (Style 26)? That is the true KPI.
- The "Idle Time" Metric: Correlate better visualization with reduced "Idle Time" in the app. If users find what they need faster (thanks to Style 13 Comparison), they spend less time searching and more time fixing. This is a measure of Operational Efficiency.
- Compliance Velocity: Measure how quickly new regulations (e.g., SOC2, GDPR) are understood by the team when communicated via Style 5 (Kinetic Type) versus email text. Speed of compliance is a competitive advantage.
- Retention and Churn (LTV): Customers churn when they don't see value. Success Celebration visuals (Style 22) and Parallax Depth (Style 29) remind them of the value they are getting, directly impacting retention rates.
- The AI Visual Frontier: Prepare your asset library for AI integration. Soon, Generative AI will allow users to query the system and receive a dynamically generated visual answer (referencing Style 4 concepts). Advids positions your visual strategy to be "Asset-Ready" for this shift—building libraries of modular elements that can be reassembled by AI.
- Scalability of Assets: Build a library, not a graveyard. Construct your visual assets in a modular way (like Style 19 Low-Poly) so they can be easily updated as the software version changes.
- The Advids Partnership: Explicitly mention Advids as the long-term partner for asset scalability. Scale is the enemy of quality without a partner; we ensure that as your feature set grows, your visual library expands without losing consistency.
- Benchmarking Success: "Good enough" is a competitive risk. Regularly audit competitor visuals. If they move to 3D AR (Style 23) and you remain in Static 2D, you lose the perception of innovation.
- The ROI of Safety: For physical data center teams, better visualization means fewer accidents. Holographic Safety Guides (Style 23) can directly lower insurance premiums by reducing operator error during hardware maintenance.
- Final Call to Innovation: Treat video not as "Content," but as "Infrastructure." In the era of the Hybrid Cloud, the ability to visualize the invisible is the ultimate competitive advantage. By investing in these 30 styles, you are not just making videos; you are building the Visual Interface of your business logic.
Companies using similar video content -
Elastic – Observability – Deep analytics engaging power users.
Splunk – Observability Cloud – Sophisticated dark mode for advanced features.
IBM – Instana Observability – Cockpit for the Level 3 engineer.
Author & Editor Bio


