
Introduction: Illuminating the Invisible Chain
The modern supply chain is no longer defined by the physical movement of freight alone; it is defined by the velocity and clarity of data. For the "Resilient Orchestrator"—the logistics leaders steering global networks—the challenge has shifted. It is no longer enough to move boxes; one must move information faster than the physical world changes. The "Physical-Digital Divide"—the gap between ground truth and dashboard visibility—remains the single greatest barrier to resilience. You cannot optimize what you cannot see, and in a global network of moving nodes, static spreadsheets are maps of the past, not guides to the future.
We are shifting from reactive firefighting to predictive orchestration. This transition is not just about aesthetics; it is a quantified competitive advantage. Recent research from Accenture reveals a stark truth: companies with the most mature, digitally integrated supply chains are 23% more profitable than their peers. This statistic validates the move from "cost center" to "revenue engine."
However, the path to this maturity is blocked by a lack of deep visibility. McKinsey reports a startling vulnerability: only 2 percent of supply chain executives have visibility into their supply base beyond the second tier. This "blind spot" is where risk accumulates—and where your platform must shine.
This guide acts as your strategic blueprint. It presents 30 specific visual styles designed to bridge the gap between complex algorithms and stakeholder buy-in. By leveraging these psychology-driven aesthetics, we move beyond generic "tech" visuals to create a language of control, foresight, and resilience.
1. Isometric 2D Motion Design
TOFU | Brand Awareness

The Visual & Narrative Approach
Scenario: The screen opens on a pristine, "God’s-Eye" view of a global logistics network. We utilize an isometric perspective—a method that eliminates perspective distortion—to create a sense of absolute order. A stylized map serves as the base, populated by floating geometric nodes in electric indigo (representing distribution centers) and vibrant coral accents (active hubs). Dotted trajectory lines connect these nodes, with abstract cargo ships and trucks gliding rhythmically along the paths.
Narration: The tone is precise and reassuring. "In a world of complexity, see the connections that matter. Total network orchestration, simplified."
Psychological Impact & KPI Focus
- Niche Psychology: Supply chain leaders are often overwhelmed by the chaos of global operations. This style offers a psychological balm: Cognitive Offloading. By stripping away the messy reality (weather, traffic, dirt) and presenting a sanitized, clockwork model, it fosters a sense of manageability and control.
- Operational Impact: This style visually anchors the Network Visibility KPI. It demonstrates the platform's ability to unify multimodal transport into a single, coherent system.
Strategic Implementation & Trade-offs
- Funnel Stage: TOFU (Brand Awareness)
- Trade-off: While excellent for clarity, the flat aesthetic lacks emotional weight. It is not suitable for depicting the pain of disruption (e.g., a port strike) or the grit of operational reality.
Companies using similar video content -
Descartes Systems Group – Global Logistics Network – Orchestrates global trade and logistics operations.
project44 – Movement – Provides end-to-end visibility for global shipments.
2. Abstract 2D Motion Graphics
TOFU | Market Education

The Visual & Narrative Approach
Scenario: This style visualizes the invisible process of data ingestion and normalization. The visual features dynamic waves of particles in electric blue and deep orange (representing raw, chaotic data streams like GPS signals and invoices) flowing from left to right. As these chaotic waves converge, they pass through a central processing core and organize into a coherent, spherical structure. The background is a clean, off-white void, allowing the transformation from "messy dots" to "structured sphere" to take center stage.
Narration: Soft and sophisticated. "We take the noise of the network and turn it into the gold standard of intelligence."
Psychological Impact & KPI Focus
- Niche Psychology: It addresses the "Data Overwhelm" anxiety. Stakeholders fear their data is too messy to be useful. This visual metaphor proves the platform acts as an Alchemist, validating the process of turning raw signals into value without requiring technical diagrams.
- Operational Impact: It visually represents Data Cleansing and Time-to-Insight. It promises that the platform handles the complexity of integration so the user doesn't have to.
Strategic Implementation & Trade-offs
- Funnel Stage: TOFU (Market Education)
- Trade-off: It is highly conceptual. It relies on the viewer interpreting the metaphor. It must be paired with concrete text to ensure they understand this represents data processing and not just abstract art.
Companies using similar video content -
o9 Solutions – Digital Brain – Unifies data and intelligence with Enterprise Knowledge Graph.
Everstream Analytics – Discover – Provides predictive insights from complex data streams.
4. Bold Kinetic Typography
TOFU | Skippable Pre-Roll Ad

The Visual & Narrative Approach
Scenario: Words become the cargo. We use high-energy, blocky shapes that rapidly morph and slide to form words like "FAST," "FLOW," and "SYNC." The movement mimics the velocity of a high-speed sorting facility. The palette is aggressive—hot pink, deep purple, and bright cyan—standing out against a background of abstract speed lines and motion blur. There is no voiceover; the rhythm of the text is the voice.
Narration: No voiceover. High-tempo, percussive sound design synchronizes with the text hits.
Psychological Impact & KPI Focus
- Niche Psychology: This taps into the Adrenaline of logistics. It appeals to the "Fixer" persona who thrives on speed and responsiveness. The rapid motion triggers the brain's Orienting Response, grabbing attention instantly.
- Operational Impact: This is the visual language of Agility and Responsiveness. It aligns with KPIs like Order Cycle Time and Funnel Velocity, suggesting the platform is built for high-volume, high-speed environments.
Strategic Implementation & Trade-offs
- Funnel Stage: TOFU (Ads/Pre-Roll)
- Trade-off: It is low-information. It grabs attention but explains nothing. Use it only as a hook to disrupt the scroll, then transition to a more explanatory style.
Companies using similar video content -
Kinaxis – Maestro – Infuses AI for real-time scenario simulation.
5. Abstract 3D AI Visualization
TOFU | Shaping Brand Perception

The Visual & Narrative Approach
Scenario: The supply chain is depicted as a sentient, living brain. A spherical network hovers in a dark void, composed of thousands of tiny silver and azure particles. Emerald green light pulses travel rapidly along the connections, symbolizing real-time neural processing. The camera uses a shallow depth of field to focus intensely on the glowing center of the network—the "Control Tower."
Narration: Deep, futuristic, and authoritative. "Beyond tracking... thinking. An intelligence that predicts disruption before it happens."
Psychological Impact & KPI Focus
- Niche Psychology: This appeals to the aspirational self-image of the executive. It positions the platform not as a tool, but as a Strategic Partner. It alleviates the fear of the "Unknown" by suggesting a superior intelligence is watching the network 24/7.
- Operational Impact: This is the "Gold Standard" for visualizing Predictive Analytics and Risk Mitigation. It suggests that the system considers millions of variables simultaneously (weather, geopolitics, demand) to protect the supply chain.
Strategic Implementation & Trade-offs
- Funnel Stage: TOFU (Brand Perception)
- Trade-off: It can look like Sci-Fi. If the actual product UI is a basic spreadsheet view, this style can create a "Expectation Gap." Ensure the product roadmap supports this high-tech promise.
Companies using similar video content -
FarEye – Delivery Management Platform – Transforms logistics and delivery operations rapidly.
Shipsy – AI-powered Platform – Uses AI and automation to enhance efficiency.
7. Split Screen: Optimized Reality and UI
TOFU | Product/Solution Differentiation
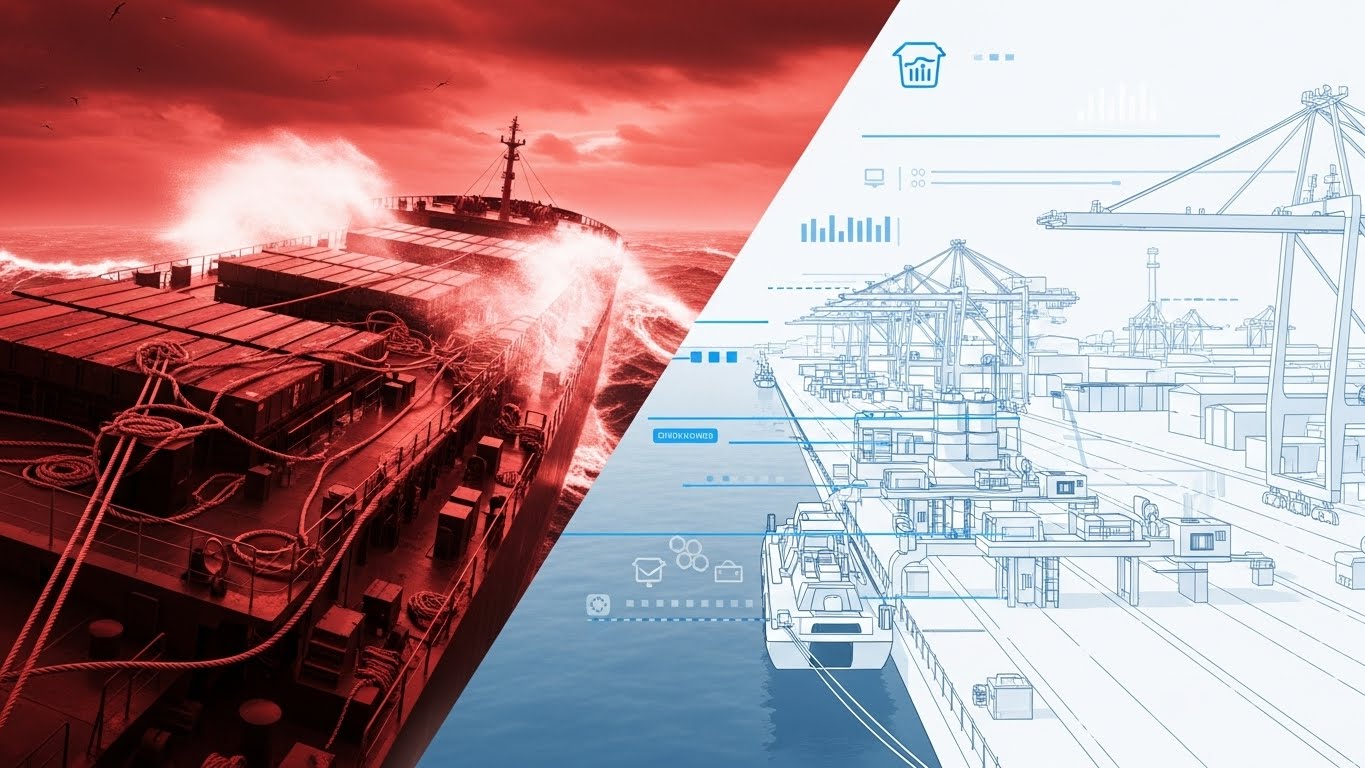
The Visual & Narrative Approach
Scenario: A sharp vertical line divides the screen. The left side is a visceral depiction of "The Problem": a monochromatic, red-tinted image of a storm-tossed cargo ship and tangled ropes—symbolizing chaos and risk. The right side is "The Solution": a cool, blue wireframe of an automated port, overlaid with organized data lines and "check" icons. The visual argument is immediate: the platform transforms the red chaos into blue order.
Narration: "Left: The variables you can't control. Right: The intelligence that masters them."
Psychological Impact & KPI Focus
- Niche Psychology: This leverages Loss Aversion. The red side triggers the pain of disruption (delays, cost), while the blue side offers immediate relief. It validates the user's daily struggle while positioning the platform as the only viable escape route.
- Operational Impact: This effectively communicates Resilience and Exception Management. It visually proves the value of digital twins in mitigating physical risks.
Strategic Implementation & Trade-offs
- Funnel Stage: TOFU (Differentiation)
- Trade-off: The "chaos" imagery must be relatable, not insulting. It should depict external factors (weather, congestion) rather than internal incompetence.
Companies using similar video content -
FourKites – Supply Chain Intelligence Platform – Uses patented AI for predictive ETAs.
ThroughPut AI – ThroughPut AI – Provides AI-powered supply chain optimization.
8. 3D Parallax UI Presentation
MOFU | Driving Demo Requests

The Visual & Narrative Approach
Scenario: We enter the dashboard. Translucent "glassmorphism" interface screens float in a deep violet void. The camera drifts through these layers, creating a rich parallax effect. Key data elements—like teal pie charts and magenta progress bars—hover slightly off the screen surface (Z-axis separation). This implies that the analytics have "depth" and aren't just flat numbers.
Narration: "Drill down deeper. From the global view to the SKU level, clarity is just a click away."
Psychological Impact & KPI Focus
- Niche Psychology: Mid-funnel buyers (MOFU) are skeptical of clunky enterprise software. This style uses Glassmorphism and depth to promise a frictionless, modern User Experience (UX). It implies that the tool is intuitive and "consumer-grade."
- Operational Impact: It highlights Granularity and Drill-Down Capabilities. It shows that the platform can handle both the big picture (background layers) and specific details (foreground layers).
Strategic Implementation & Trade-offs
- Funnel Stage: MOFU (Driving Demos)
- Trade-off: Readability can be compromised. The tilting angles can make small text hard to read. Ensure "Hero Numbers" are large and face the camera directly.
Companies using similar video content -
E2open – Networked Supply Chain Model – Connects multiple partners for data integration.
Infor – Infor Nexus – Provides holistic supply chain management and traceability.
10. Dynamic Data Visualization
MOFU | The Economic Buyer

The Visual & Narrative Approach
Scenario: We strip away the ships and maps to focus on the result: Growth. Large, abstract 3D bar charts rise majestically from a clean white surface, colored in forest green (stability) and vibrant lime (growth). An upward-trending arrow made of light weaves through the bars, leaving a trail of success. The perspective is low and commanding, making the data feel monumental.
Narration: Confident. "Optimize inventory. Maximize capital. Watch efficiency turn into equity."
Psychological Impact & KPI Focus
- Niche Psychology: This speaks the language of the Economic Buyer (CFO/CEO). They care less about how the truck moves and more about the financial outcome. The "Up and to the Right" visual triggers a positive emotional response associated with Profitability.
- Operational Impact: This visualizes ROI, Working Capital Optimization, and Margin Growth. It translates operational efficiency into financial success.
Strategic Implementation & Trade-offs
- Funnel Stage: MOFU (The Economic Buyer)
- Trade-off: It is data-light. It shows the result, not the method. It must be backed by the rigorous data shown in previous styles to be credible.
Companies using similar video content -
Overhaul – Supply Chain Optimization Solutions – Focuses on risk management and compliance.
Tive – Real Time Transportation Visibility Platform – Tracks shipments using IoT devices.
11. Clean UI Workflow (Light Mode)
MOFU | Feature Education & Demonstration
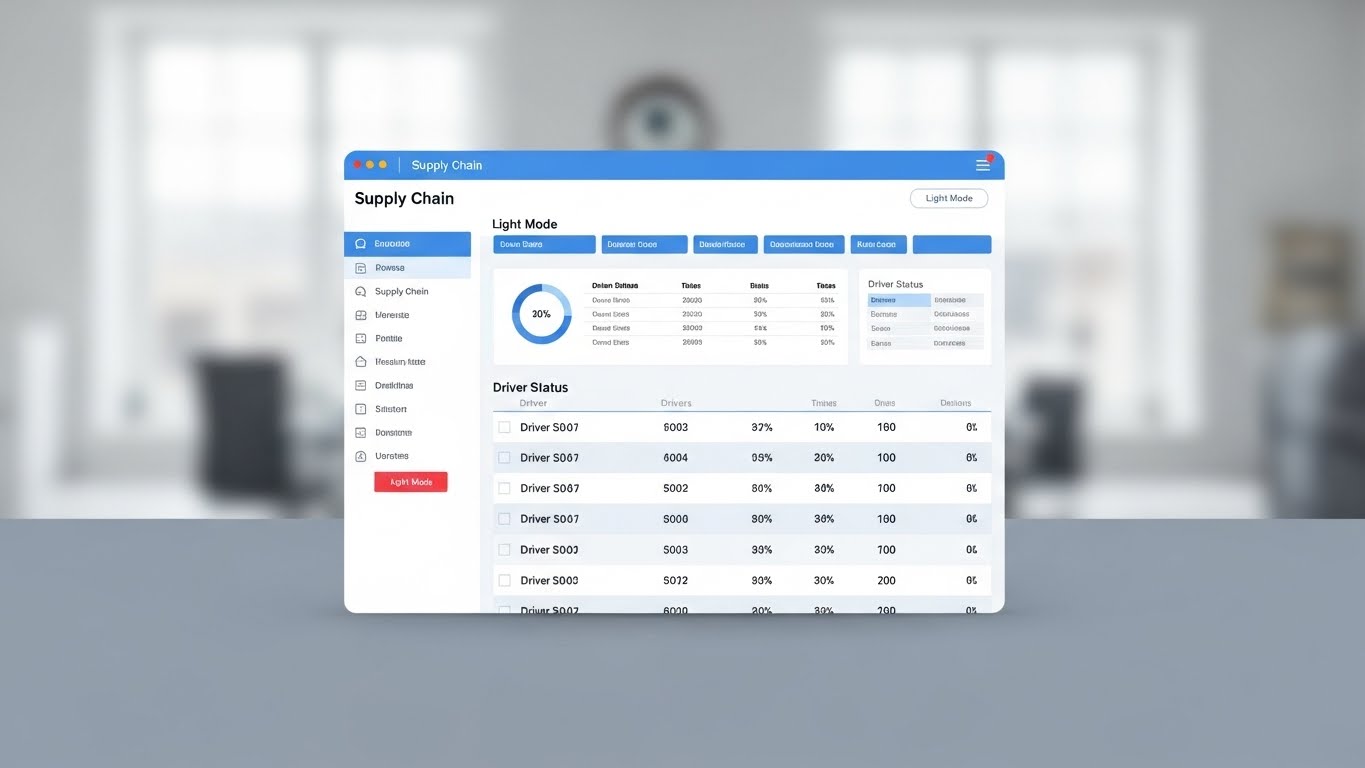
The Visual & Narrative Approach
Scenario: The high-octane visuals of the "vision" phase settle into the calm reality of daily use. We see a high-fidelity mockup of the platform's interface in "Light Mode," floating centrally against a blurred, modern office background. The design is pristine: a crisp white background, sky-blue navigation bars, and sharp, legible data tables showing driver statuses. The mouse cursor moves smoothly, clicking a single button to resolve an alert, demonstrating effortless control.
Narration: Calm, clear, and professional. "Built for the people who move the world. A design that respects your time, your focus, and your workflow."
Psychological Impact & KPI Focus
- Niche Psychology: This targets Cognitive Load. Dispatchers and logistics managers are often bombarded with clutter. This style uses "White Space" as a strategic tool, promising a stress-free user experience. It validates the user's need for order in a chaotic environment.
- Operational Impact: This directly visualizes Efficiency and Ease of Use. It suggests that the platform reduces training time and accelerates task completion, directly impacting SLA Compliance.
Strategic Implementation & Trade-offs
- Funnel Stage: MOFU (Feature Education)
- Trade-off: It lacks "Flash." It is not designed to excite; it is designed to reassure. Do not use this for hype reels; use it for product pages where the user is evaluating usability.
Companies using similar video content -
Microsoft Dynamics 365 – Supply Chain Management – Offers AI-powered ERP and CRM.
SAP – S/4HANA – Provides in-memory computing for data-intensive operations.
12. Wireframe to Reality Transition
MOFU | Competitive Displacement

The Visual & Narrative Approach
Scenario: This style bridges the gap between the "plan" and the "road." The screen is split: the left half displays a glowing blue wireframe blueprint of a delivery truck, representing the digital plan. A bright vertical "wiper" effect moves across the screen, instantly transforming the wireframe into a photorealistic, shiny white truck on the right with neon green accents. The background transitions from a digital grid to a realistic asphalt road, symbolizing the software's ability to turn data into physical action.
Narration: Confident and transformative. "From the digital plan to the physical mile. See how our algorithms become your reality."
Psychological Impact & KPI Focus
- Niche Psychology: This addresses Implementation Anxiety. Buyers often fear that software works in theory but fails in practice. This visual metaphor proves the connection, offering a sense of certainty that the digital strategy will manifest as physical results.
- Operational Impact: It visualizes Competitive Displacement and Realization. It shows the direct translation of optimization logic into fleet movement.
Strategic Implementation & Trade-offs
- Funnel Stage: MOFU (Competitive Displacement)
- Trade-off: It is metaphorical. Ensure the "Real" side of the transition looks grounded and gritty enough to be believable, otherwise, it feels like a video game.
Companies using similar video content -
Locus – AI-First Enterprise Logistics Platform – Intelligent route optimization and dispatch.
Route4Me – Route Planner – Optimizes routes for smallest number of vehicles.
14. Photorealistic 3D Renders
BOFU | ROI Justification Hook

The Visual & Narrative Approach
Scenario: When speaking to the C-Suite, abstract percentages often fail to land. Here, we make value physical. We see a secure vault environment, dramatically lit. Inside, standard shipping pallets are stacked high—but they are made of solid gold, stamped with "ROI." The metallic textures reflect the studio lighting, giving the data a literal "weight." This implies that efficient inventory management is as valuable as gold bullion.
Narration: Authoritative and financial. "Unlock the capital trapped in your supply chain. Turn efficiency into equity."
Psychological Impact & KPI Focus
- Niche Psychology: This targets the CFO's Logic. It moves the conversation from "operational cost" to "asset value." It uses the psychological principle of Tangibility—making an abstract concept (savings) feel like a physical object (gold) to trigger a stronger desire for possession.
- Operational Impact: This is a pure visualization of Return on Investment (ROI) and Working Capital. It argues that the software doesn't just manage boxes; it unlocks value.
Strategic Implementation & Trade-offs
- Funnel Stage: BOFU (ROI Justification)
- Trade-off: It is bold. It can appear arrogant if not backed by hard numbers. Use this visual only when you have the case studies to prove the "Gold" claim.
Companies using similar video content -
Netstock – Predictor IBP – Manages inventory to reduce costs and improve profitability.
LeanDNA – Inventory Analytics – Provides actionable inventory analytics for cost savings.
15. 3D X-Ray Visualization
BOFU | Risk Mitigation

The Visual & Narrative Approach
Scenario: We strip away the exterior to reveal the risk within. A standard shipping container is rendered in a "skeleton white" translucency. Inside, we see the cargo stacked neatly. Suddenly, a glowing red pulse highlights a specific box deep inside the stack—identifying a temperature excursion or a compliance failure that would otherwise be invisible. The background is a dark, industrial void, keeping the focus entirely on the internal diagnostic.
Narration: Analytical and sharp. "Don't just track the box. Know what's inside. Detect anomalies before they become liabilities."
Psychological Impact & KPI Focus
- Niche Psychology: This appeals to the "Protector" persona—the Risk Manager. It alleviates the fear of the "Black Swan" event. By offering X-ray vision, it provides a sense of Supernatural Competence and total awareness.
- Operational Impact: It visualizes Risk Mitigation and Exception Management. It demonstrates that the platform offers deep visibility, not just surface-level tracking.
Strategic Implementation & Trade-offs
- Funnel Stage: BOFU (Risk Mitigation)
- Trade-off: It creates a Negative Bias if overused. It focuses on things going wrong. Balance it with visuals of successful deliveries to avoid painting a picture of constant danger.
Companies using similar video content -
Zoho Inventory – Zoho Inventory – Manages inventory, orders, and shipping with clean UI.
Sortly – Sortly – Offers user-friendly inventory management experience.
16. Futuristic Neon/Dark Mode
BOFU | ABM Awareness

The Visual & Narrative Approach
Scenario: We enter the high-speed data tunnel of the future. A wireframe semi-truck, constructed of glowing teal grid lines, speeds through a dark server-room environment. Streams of neon pink and electric blue light streak past, representing the massive flow of telematics data—speed, fuel, location, drag—being processed in milliseconds. The aesthetic is "Cyberpunk-Lite," appealing to the tech-savvy buyer who equates "Dark Mode" with "Pro Mode."
Narration: Fast-paced and energetic. "At the speed of light, data becomes decision. Real-time intelligence for the always-on network."
Psychological Impact & KPI Focus
- Niche Psychology: This appeals to the IT Director and the Tech-Forward Logistician. It uses the "Dark Mode" aesthetic to signal Modernity and Power. It separates your platform from "legacy" gray-screen software.
- Operational Impact: It effectively visualizes Latency (or lack thereof) and High-Frequency Data Processing. It implies the system is robust enough to handle millions of signals without crashing.
Strategic Implementation & Trade-offs
- Funnel Stage: BOFU (ABM Awareness/Tech Validation)
- Trade-off: It can feel Gamified. Conservative buyers might find it too "video game" like. Ensure the accompanying text emphasizes enterprise-grade security and reliability.
Companies using similar video content -
Vector – Yard Management Solution – Transforms digital plans into frictionless operations.
BlueRock TMS – BlueRock TMS – Integrates pre-planning, execution, and visibility.
17. Isometric 3D Workflow
BOFU | The Functional Buyer

The Visual & Narrative Approach
Scenario: To explain complex yard management, we simplify the world. We use a "Claymorphism" style—soft, rounded 3D shapes in matte pastel tones (terracotta, sage green, clay white). We see a miniature logistics park from an isometric bird's-eye view. Tiny, toy-like forklifts move in perfect synchronization with a waiting truck. The lighting is soft and diffuse, making the complex operation look organized, manageable, and approachable.
Narration: Friendly and instructional. "Orchestrate your yard with the precision of a conductor. Every movement, synchronized. Every asset, accounted for."
Psychological Impact & KPI Focus
- Niche Psychology: This style reduces Intimidation. Yard management is notoriously chaotic. By rendering it as a clean, synchronized "model," we leverage Cognitive Ease. It makes the solution feel "plug-and-play" rather than a heavy lift.
- Operational Impact: It visualizes Yard Management Systems (YMS) and Asset Utilization. It shows the holistic relationship between the warehouse, the yard, and the truck without the noise of reality.
Strategic Implementation & Trade-offs
- Funnel Stage: BOFU (Functional Buyer)
- Trade-off: It can look Childish if the colors are too bright. Use sophisticated "earth tones" (as seen in the image) to maintain professionalism while keeping the softness.
Companies using similar video content -
MPO – Multi-Party Orchestration Platform – Connects and orchestrates multiple parties.
C.H. Robinson – Navisphere – Connects customers and carriers for efficient logistics.
18. Rapid UI Feature Montage
BOFU | Sales Cycle Acceleration
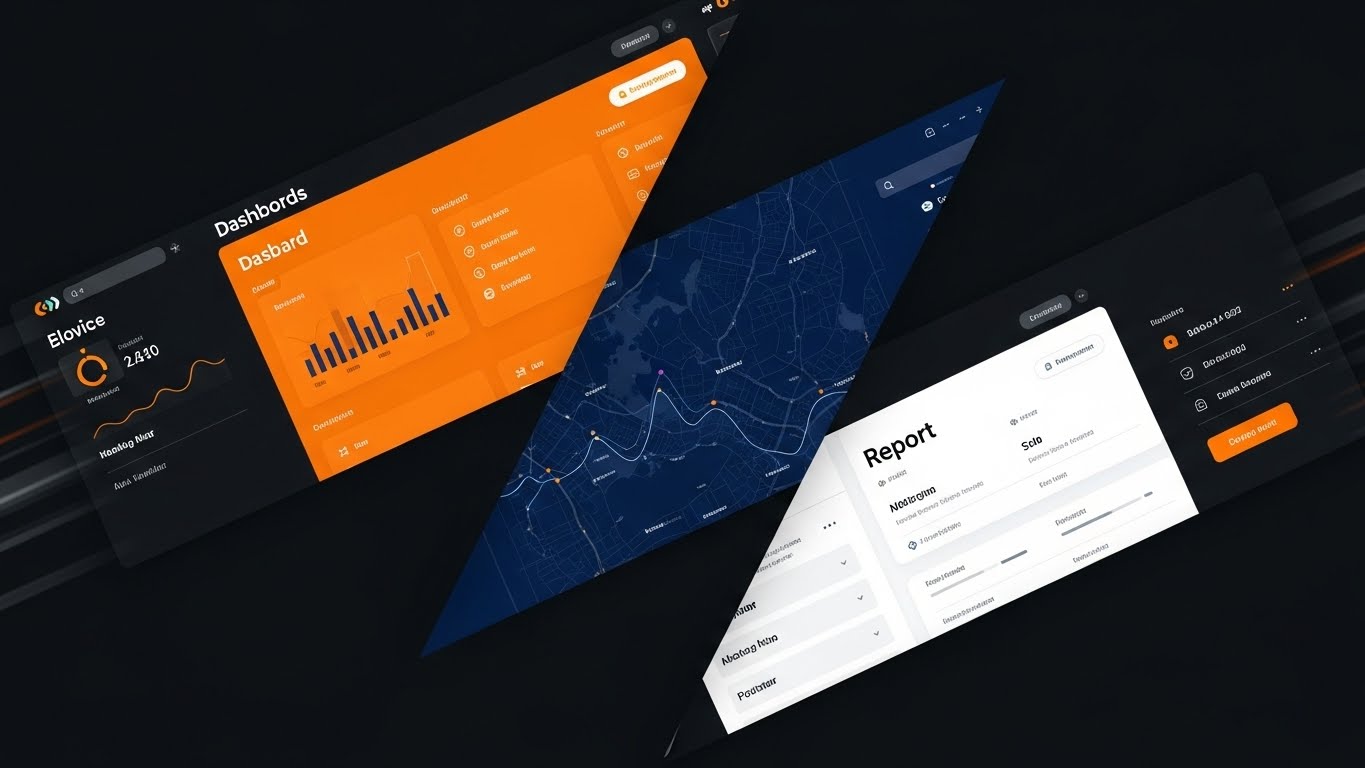
The Visual & Narrative Approach
Scenario: Speed is the message. We see a dynamic composition where diagonal slices of the screen reveal different aspects of the platform simultaneously. A vivid orange dashboard cuts across a dark blue geospatial map, which slices into a crisp white reporting tool. The edges blur slightly to suggest motion. This is not about reading the data; it is about feeling the comprehensiveness of the suite.
Narration: High-tempo. "Map it. Track it. Report it. The complete operating system for global logistics."
Psychological Impact & KPI Focus
- Niche Psychology: This targets Decision Fatigue. Buyers worry about buying multiple point solutions. This visual screams "All-in-One." It triggers the abundance mindset, suggesting extraordinary value for a single license.
- Operational Impact: It visualizes Platform Integration and End-to-End Visibility. It shows that the map talks to the dashboard, which talks to the report.
Strategic Implementation & Trade-offs
- Funnel Stage: BOFU (Sales Acceleration)
- Trade-off: Zero readability. Do not use this to explain how a feature works. Use it to close a video or transition between sections to maintain energy.
Companies using similar video content -
Coupa – Supply Chain Design & Planning – Integrates procurement and supply chain processes.
Epicor – Supply Chain Management – Specializes in solutions for manufacturing and distribution.
19. 2D Character-Driven Story
BOFU | Reducing Implementation Friction

The Visual & Narrative Approach
Scenario: We address the user, not the machine. A clean, flat 2D vector illustration features a professional character—a woman in a lavender top—smiling as she effortlessly plugs a glowing cable into a server rack. The background is soft and stylized in pinks and whites. There is no grit, no grease, no stress. It visualizes the "Plug and Play" promise of modern SaaS implementation.
Narration: Warm and reassuring. "Integration shouldn't be a struggle. Connect your legacy systems in minutes, not months."
Psychological Impact & KPI Focus
- Niche Psychology: This addresses the biggest barrier to sale: Change Management. Stakeholders fear that new software will be hard to install and harder to learn. This friendly, human visual leverages Social Proof and empathy to lower defenses.
- Operational Impact: It visualizes Time-to-Value and Ease of Integration. It promises a seamless bridge between old and new systems.
Strategic Implementation & Trade-offs
- Funnel Stage: BOFU (Reducing Implementation Friction)
- Trade-off: It is Abstract. It doesn't show the actual UI. It is purely for emotional reassurance regarding the onboarding process.
Companies using similar video content -
Gnosis Freight – Container Lifecycle Management® Platform – Manages shipping containers for visibility.
ACSIS – Supply Chain Visibility Solutions – Provides transactional and analytical data for insights.
20. Aspirational Stock Montage
BOFU | Objection Handling & Friction Reduction

The Visual & Narrative Approach
Scenario: We end on the human result of good technology: alignment. We see a high-quality cinematic shot of a diverse team in a sunlit, glass-walled conference room. They are engaged, smiling, and pointing at a glass whiteboard. A subtle, teal digital overlay connects the people with abstract nodes, symbolizing that the software is the invisible thread that binds their collaboration. It breathes "success."
Narration: Inspirational. "When data flows, teams align. Empower your people to build the future of your network."
Psychological Impact & KPI Focus
- Niche Psychology: This targets the Leader's Aspiration. Every VP wants a happy, collaborative team. This visual validates the purchase as a Cultural Enabler, not just a software tool. It helps handle objections about user resistance.
- Operational Impact: It visualizes Cross-Functional Collaboration and Data Democratization. It implies that the platform breaks down silos between departments.
Strategic Implementation & Trade-offs
- Funnel Stage: BOFU (Objection Handling/Retargeting)
- Trade-off: It is Generic. Without the digital overlay, it's just a stock photo. The overlay is critical to tie the "happy people" back to the "software purchase."
Companies using similar video content -
Trimble – Trimble Visibility – Bridges digital and physical worlds with technology.
OpenRemote – IoT Platform – Tailored for telematics fleet management systems.
21. 2D Animation & UI Composition
ONBOARD | Self-Serve Onboarding

The Visual & Narrative Approach
Scenario: The most critical moment in SaaS is the first login. We visualize this using a welcoming, cel-shaded 2D animation style. A stylized hand, clad in a bright lime sleeve (evoking energy), enters the frame and confidently taps a floating "Start Optimization" button on a semi-transparent interface. The background is a soft, blurred electric blue, keeping the focus entirely on the action. The animation mimics the "squeeze" and "pop" of a tactile button press.
Narration: Energetic and inviting. "Welcome to the new standard. One click to connect, one click to optimize. Your journey to efficiency starts now."
Psychological Impact & KPI Focus
- Niche Psychology: This addresses "New Tool Anxiety." Users often fear breaking a new system. The playful, cartoon-like aesthetic disarms this fear, signaling that the platform is forgiving, intuitive, and easy to explore.
- Operational Impact: This directly targets Time-to-Value and Activation Rate. It visually trains the user that the interface is responsive and simple, encouraging immediate engagement.
Strategic Implementation & Trade-offs
- Funnel Stage: ONBOARD (Self-Serve Onboarding/PLG)
- Trade-off: It is Stylized. It is not a literal representation of the UI. It works best for welcome screens or "Getting Started" videos, but not for technical training.
Companies using similar video content -
C3 Solutions – C3 Yard – Develops yard management and dock scheduling systems.
GoRamp – Yard Management Solution – Provides full control over yard operations.
22. Macro UI Micro-Interactions
ONBOARD | Trial/Freemium User Activation

The Visual & Narrative Approach
Scenario: We zoom in—extreme close-up. Using a macro photography aesthetic, we see the cursor hovering over a digital toggle switch. The depth of field is razor-thin, blurring the background into a deep black void. The switch itself glows with a cyan and magenta gradient. As the cursor clicks, we see the subtle change in light and the "snap" of the toggle. It treats the software interface with the reverence usually reserved for luxury hardware.
Narration: Whispered and precise. "God is in the details. Precision engineering for every interaction. Feel the control."
Psychological Impact & KPI Focus
- Niche Psychology: This appeals to the "Craftsman" mindset of high-level operators. It leverages the Halo Effect—if the button is this well-designed, the algorithm behind it must be flawless. It builds subconscious trust in the system's reliability.
- Operational Impact: It influences User Satisfaction (CSAT) and Perceived Quality. It transforms the mundane task of clicking a button into a moment of satisfying control.
Strategic Implementation & Trade-offs
- Funnel Stage: ONBOARD (Trial/Freemium User Activation)
- Trade-off: It is Abstract. It doesn't show a workflow. Use it in email headers or loading screens to reinforce brand quality, not to teach features.
Companies using similar video content -
Manhattan Associates – Manhattan Active Supply Chain – Offers omnichannel, planning, and execution solutions.
Infor – CloudSuite – Delivers comprehensive insights and automation.
24. Low-Poly 3D Modeling
RETENT | Knowledge Base & FAQ Videos

The Visual & Narrative Approach
Scenario: We need to explain a complex routing algorithm without boring the user. We use a "Low-Poly" 3D style—a landscape made of faceted geometric shapes in friendly shades of green and brown. A toy-like orange truck drives along a winding road, passing floating checkpoint icons. The lighting is bright, cheerful, and shadow-less. It turns a mathematical problem (The Traveling Salesman Problem) into a delightful, explorable world.
Narration: Friendly and educational. "The road is complex, but the path is simple. Learn how our routing engine saves you miles, minutes, and money."
Psychological Impact & KPI Focus
- Niche Psychology: This lowers the Barrier to Entry. Complex logistics concepts can be intimidating. This style uses Gamification aesthetics to make learning feel like play, encouraging users to engage with help center content.
- Operational Impact: It drives Feature Adoption and reduces Support Ticket Volume. By making "How-To" content engaging, users are more likely to self-educate.
Strategic Implementation & Trade-offs
- Funnel Stage: RETENT (Knowledge Base & FAQ Videos)
- Trade-off: It can feel Casual. Avoid using this for serious compliance training (e.g., HazMat handling). Keep it for feature education and best practices.
Companies using similar video content -<
Budibase – Low-Code Platform – Builds tools for managing fleets and inventories.
Odoo – Odoo Inventory – Offers a range of features for warehouse management.
25. Holographic UI over 3D Render
RETENT | Driving Deep Feature Adoption

The Visual & Narrative Approach
Scenario: We appeal to the expert user. A realistic 3D render shows a dark mahogany executive desk in a dimly lit office. Hovering above the desk is a glowing, semi-transparent holographic projection of a truck engine and complex logistics metrics. The data is rendered in "Sci-Fi" electric blue and cyan. The visual metaphor places the user in the seat of ultimate power—Tony Stark managing a supply chain.
Narration: Powerful and aspirational. "For those who demand more. Unlock the full spectrum of analytics. Command your fleet with the power of the future."
Psychological Impact & KPI Focus
- Niche Psychology: This targets Ego and Mastery. It validates the user's expertise, suggesting that only a "Pro" can handle this level of data. It motivates users to explore advanced features to live up to this image.
- Operational Impact: It drives Deep Feature Adoption and Stickiness. It positions the "Pro" features as essential tools for the modern leader, increasing the likelihood of upsell.
Strategic Implementation & Trade-offs
- Funnel Stage: RETENT (Driving Deep Feature Adoption)
- Trade-off: It sets a High Bar. The actual software must have a "Dark Mode" or advanced analytics view that somewhat resembles this, or users will feel deceived.
Companies using similar video content -
monday work management – monday work management – Consolidates logistics data for unified view.
Dista – Dista Deliver – AI-enabled location intelligence for field operations.
26. 2D Graphics Over Live Action
RETENT | Reducing Churn

The Visual & Narrative Approach
Scenario: We return to the ground truth. A medium shot features a real warehouse manager in a high-vis vest, holding a rugged tablet. The background is a bustling, gritty warehouse with natural light. Superimposed on this reality are crisp, neon green 2D vector graphics: a floating "Inventory Count: 1,250" above a pallet and a large, satisfying "Checked" tick mark. This style blends the grit of the physical world with the precision of the digital overlay.
Narration: Grounded and authentic. "Built for the floor, not just the boardroom. Real-time data that works as hard as you do."
Psychological Impact & KPI Focus
- Niche Psychology: This addresses Disconnect Anxiety. Field staff often feel software is designed by people who have never driven a forklift. This visual proves the software works in situ, bridging the gap between the code and the cargo.
- Operational Impact: It targets Churn Reduction and Field Adoption. It validates the tool's utility for the daily user, ensuring it doesn't get rejected by the frontline.
Strategic Implementation & Trade-offs
- Funnel Stage: RETENT (Reducing Churn)
- Trade-off: Production Cost. Requires high-quality live-action footage. Poorly lit warehouse footage will make the software look cheap.
Companies using similar video content -
Spoke – Route Planner – Free driver app for optimizing delivery routes.
Tookan – Tookan – Manages on-demand delivery with user-friendly interface.
27. Hyper-lapse Stock Footage with Data
RETENT | Proactive Support/Announcements

The Visual & Narrative Approach
Scenario: To visualize "always-on" support, we use a hyper-lapse of a city at night. We look down a canyon of skyscrapers as streaks of red and white light from cars blur through the frame. Overlaid on this organic flow are bright white data stream lines that follow the vehicles, looking like digital veins pulsating with information. The energy is frantic, but the data lines are orderly and constant.
Narration: Fast and rhythmic. "The city never sleeps, and neither do we. 24/7 monitoring keeping your network flowing, mile after mile."
Psychological Impact & KPI Focus
- Niche Psychology: This targets Security and Stability. In logistics, downtime is death. This visual reinforces the idea of a "Guardian" system that maintains order amidst the chaos of the urban environment.
- Operational Impact: It communicates Reliability and Proactive Support. It assures the client that the platform is handling the volume, supporting renewal discussions.
Strategic Implementation & Trade-offs
- Funnel Stage: RETENT (Proactive Support/Announcements)
- Trade-off: Generic Imagery. Without the custom data lines, it's just a stock clip. The quality of the motion graphics overlay is what sells the "tech" angle.
Companies using similar video content -
OpenWMS.org – Open Warehouse Management System – Open-source software for intralogistic projects.
OpenTCS – OpenTCS – Manages automatic vehicles with graphical frontend.
28. Dark Mode UI Showcase
EXPAND | Driving Upsell/Cross-sell

The Visual & Narrative Approach
Scenario: We present the "Velvet Rope" of the software. The screen is rendered in a matte charcoal "Dark Mode" with graphite details—the universal signifier of "Pro" software. Advanced predictive analytics graphs are plotted in glowing neon green, popping against the dark background. The composition is symmetrical and commanding. It doesn't look like a utility; it looks like a trading terminal.
Narration: Serious and exclusive. "See further. Move faster. Upgrade to Predictive Intelligence and turn your data into your strongest asset."
Psychological Impact & KPI Focus
- Niche Psychology: This leverages Exclusivity. "Dark Mode" is often associated with developer tools and premium tiers. Visualizing it creates a desire to "unlock" this superior view.
- Operational Impact: It directly drives Upsell/Cross-sell and Expansion Revenue. It visually differentiates the "Basic" plan from the "Enterprise" plan without using a pricing table.
Strategic Implementation & Trade-offs
- Funnel Stage: EXPAND (Driving Upsell/Cross-sell)
- Trade-off: Legibility. Dark mode can sometimes be hard to read in bright environments. Ensure the neon accents provide enough contrast for the video to work on mobile screens.
Companies using similar video content -
Pando – Unified Fulfillment Cloud – Optimizes multi-modal transportation with AI.
Blume Global – Blume Visibility – Provides real-time insights into shipment statuses.
29. Generative AI Realistic Character
EXPAND | Driving Referrals & Advocacy

The Visual & Narrative Approach
Scenario: Trust is transferred peer-to-peer. We use a hyper-realistic AI-generated character—a professional woman in her 30s, warm skin tones, wearing a smart blazer. She sits in a modern, blue-glass office environment. She speaks directly to the camera, sharing a "success story." The lighting is flattering studio quality. It feels like a high-end documentary interview, not a testimonial.
Narration: Conversational and sincere. "We didn't just save money; we saved time. It transformed how our team talks to each other. It’s the partner we were looking for."
Psychological Impact & KPI Focus
- Niche Psychology: This targets Social Proof. Buyers are skeptical of vendors but trust peers. Even if the character is AI (disclosed or stylistic), the humanity of the presentation bypasses the "Corporate Shield."
- Operational Impact: It drives Referrals and Advocacy. It humanizes the ROI, making it easier for current clients to imagine themselves sharing similar success stories.
Strategic Implementation & Trade-offs
- Funnel Stage: EXPAND (Driving Referrals & Advocacy)
- Trade-off: Uncanny Valley. The AI generation must be top-tier. If the lip-sync or eye movement is off, it destroys trust instantly. Use with caution and high quality control.
Companies using similar video content -
Open Door Logistic Studio – ODL Studio – Plans routes for vehicle fleets simply.
CargoApps – CargoApps – Digitizes and automates transport logistics.
30. Lifestyle Stock with UI Overlay
EXPAND | Establishing Thought Leadership

The Visual & Narrative Approach
Scenario: The final image is one of leadership. A low-angle hero shot captures a male keynote speaker on a conference stage, silhouetted by warm stage lights. He gestures toward a large screen (out of focus). In the foreground, a sharp, abstract UI overlay in white and teal displays a "Growth Trend" line that connects his gesture to the data. It implies that his vision is powered by your platform.
Narration: Inspirational and closing. "Lead the market. Define the future. With the right intelligence, the stage is yours."
Psychological Impact & KPI Focus
- Niche Psychology: This targets the Self-Actualization needs of the executive. They don't just want to manage trucks; they want to be seen as industry visionaries. This visual aligns your platform with their personal career growth.
- Operational Impact: It establishes Thought Leadership and Brand Equity. It positions the platform not as a tool for today, but as the foundation for the company's future.
Strategic Implementation & Trade-offs
- Funnel Stage: EXPAND (Establishing Thought Leadership)
- Trade-off: Ambition vs. Reality. This is a brand play, not a feature play. It works for LinkedIn and Keynotes, but not for a product demo.
PART 4: THE STRATEGIC KNOWLEDGE BASE
The Visual Operations Doctrine
To transform these 30 visual styles from "creative assets" into a "competitive advantage," we must apply a rigorous strategic framework. This section synthesizes the visual tactics into a cohesive business doctrine, designed to align your organization, accelerate adoption, and prove ROI.
Strategic Alignment & Visual Architecture
The "Pre-Production" Strategy. Defining the Why and Who before the How.
- The Cognitive Load Audit: Before creating a single asset, audit your current training materials. If a PDF takes 10 minutes to read, the video replacement must convey the same value in 90 seconds (Style 3, 24). Measure success by the reduction in "Time-to-Comprehension."
- Role-Based Visual Mapping: Do not use the same visual style for all personas. Drivers on mobile devices need high-contrast, large-text visuals (Style 11, 21). Fleet Managers at desks need data-dense, dark-mode aesthetics (Style 16, 28). Map the style to the device.
- The "Glanceability" Standard: In logistics, attention is a scarce resource. Adhere to a "3-Second Rule" for all operational videos: the core message (alert, status, action) must be understandable within 3 seconds of play, utilizing bold iconography (Style 4, 26).
- Brand Voice Consistency: Your platform likely consists of disparate modules (TMS, WMS, YMS). Use a unified visual language (Color Palette from Style 1, Typography from Style 4) to visually stitch these modules together, reducing the "fragmented" feel of legacy enterprise software.
- The Advids Strategic Audit: Visual chaos dilutes brand authority. Engage Advids to conduct a "Visual Operating System" audit—defining the standard for motion, typography, and data visualization before production begins to ensure every asset builds long-term equity.
- Standardization vs. Customization: When to use stock assets vs. bespoke visualization for trucking scenarios. Use "Style 20" (Stock with Overlay) for general concepts to save budget. Save "Style 14" (Photorealistic 3D) for your core differentiators (e.g., your proprietary algorithm). Allocate budget based on the strategic value of the message.
- The Cross-Departmental Bridge: Sales uses "Blue Sky" visuals (Style 1). Ops uses "Gritty Reality" visuals (Style 7). Create "Bridge Assets" (Style 12) that visually transition from the sales promise to the operational reality to align expectations during the handoff.
- Legacy System Integration: Visualizing the invisible connection between old hardware and new software is critical. Use "Style 19" (Abstract Connectors) to reassuringly visualize the "handshake" between legacy on-prem servers and your modern SaaS cloud.
- Accessibility in Trucking: The logistics workforce is diverse and often multi-lingual. Prioritize "Style 3" (Isometrics without text) and motion graphics that rely on visual logic rather than voiceover, ensuring accessibility for non-native speakers.
- The Mobile-First Mandate: 60% of supply chain users are non-desk workers. All 30 styles must be "squint-tested" on a mobile screen. If the detail in "Style 8" (Parallax UI) is lost on a phone, simplify it to "Style 22" (Macro UI).
Operational Adoption & Implementation
The "Deployment" Phase. Embedding visuals into the daily workflow.
- Overcoming "Big Brother" Anxiety: Driver monitoring systems often face resistance. Use "Style 29" (Human Advocate) and "Style 15" (X-Ray Risk) to frame AI monitoring as a "Digital Co-Pilot" for safety, rather than a surveillance tool for punishment.
- The Micro-Learning Shift: Replace the 50-page driver manual with a library of 30-second "Style 21" (2D Animation) clips. Index them by task (e.g., "How to Accept a Load") to facilitate "Just-in-Time" learning.
- Just-in-Time Support: Embed specific visual styles into the helpdesk or cab tablets. When a user hovers over a complex feature, a "Style 22" (Macro UI) loop should trigger, explaining the function in situ without forcing them to leave the workflow.
- Gamification of Training: Leverage "Style 4" (Kinetic Type) and "Style 10" (Rising Bars) to visualize driver scorecards. Turning safety metrics into high-energy visual achievements taps into the competitive nature of the workforce and boosts engagement.
- Reducing Support Ticket Volume: There is a direct correlation between proactive visual guides and reduced call center load. If 30% of tickets are "How do I reset my password?", a pinned "Style 21" video on the login screen can deflect those tickets entirely.
- Remote Onboarding: For distributed fleets, physical seminars are impossible. Use "Style 8" (Immersive UI) and screencasts to simulate a "shoulder-to-shoulder" training session, allowing you to scale onboarding without scaling headcount.
- Standard Operating Procedures (SOPs): Text-based Standard Operating Procedures are rarely read. Transform critical SOPs (e.g., Cold Chain Compliance) into "Style 12" (Wireframe to Reality) videos that visually demonstrate the consequences of non-compliance.
- Feedback Loops: Use interactive video elements. After a "Style 24" (Education) video plays, pop up a simple "Was this helpful?" query. Use this data to refine the visual strategy continuously.
- Scalable Localization: When expanding globally, separate the text layers from the animation layers in your source files. This allows you to swap languages in "Style 2" (Abstract Motion) without re-rendering the complex 3D backgrounds (Global Rule 39).
- Leadership Communication: Don't send a spreadsheet to the Board. Use "Style 10" (Dynamic Data) and "Style 30" (Thought Leadership) to visually summarize quarterly performance. Executives buy what they can see.
Measuring Impact & Future-Proofing
The "ROI" Phase. Quantifying success and building for the next decade.
- Beyond "Views": Vanity metrics (views) are useless in B2B. Measure "Time-to-Competency" (how much faster a user performs a task after watching) and "Feature Adoption Rate" (clicks on a feature after a video release).
- The "Idle Time" Metric: In software, hesitation is inefficiency. Correlate the implementation of "Style 11" (Clean Workflow) videos with a reduction in "Average Time on Task." Less time figuring out the UI means more time moving freight.
- Compliance Velocity: When a new regulation (e.g., ELD mandates) hits, measure how quickly your fleet achieves 100% compliance using video training versus text memos. Speed of compliance is a defensible ROI metric.
- Retention and Churn: High-quality UX visualization ("Style 25" and "Style 28") increases the perceived value of the tool. Track the correlation between user engagement with "Pro" feature videos and their renewal rates (LTV).
- The AI Visual Frontier: Prepare for the future where "Style 5" (AI Visualization) is not just a render, but a real-time feed. Structure your data today so it can be fed into generative video engines tomorrow for personalized reporting.
- Scalability of Assets: Build a "Visual Component Library." If you create a 3D truck for "Style 12," ensure it is rigged and textured so it can be reused in "Style 26" and "Style 27." This reduces the cost-per-video over time.
- The Advids Partnership: Visual trends evolve rapidly. Partnering with Advids ensures your visual language evolves from "Style 1" to "Style 30" without losing brand coherence. We act as the custodian of your visual assets, ensuring scalability as your product grows.
- Benchmarking Success: Do not benchmark against logistics competitors (who often have poor visuals). Benchmark against B2C fintech apps. Your users expect the "Style 22" polish of a banking app in their trucking software.
- The ROI of Safety: Safety is the single biggest cost variable. Quantify the reduction in accident rates or insurance premiums following the rollout of "Style 15" (Risk X-Ray) training modules. This is the "Gold Standard" (Style 14) of ROI.
- Final Call to Innovation: Treat video not as "marketing content," but as Digital Infrastructure. Just as you invest in servers to move data, invest in visuals to move minds. The company that explains the future best, owns it.
[END OF GUIDE]
This strategic blueprint—spanning 30 distinct visual styles and a 3-part operational doctrine—is your roadmap to closing the Physical-Digital Divide. By executing this plan, you do not just visualize the supply chain; you orchestrate it.
Companies using similar video content -
DP World – CARGOES Flow – Digital suite of enterprise services for logistics.
Dassault Systèmes – DELMIA Quintiq – Transforms supply chain planning with control.
Author & Editor Bio


