
Introduction: The Visual Architecture of Resilience
The global supply chain has fundamentally shifted from a linear series of transactions to a dynamic, living nervous system. For Operations Directors and Supply Chain Leaders, the challenge is no longer just moving goods; it is orchestrating a synchronized performance across a fragmented global stage. The gap between physical logistics—containers, trucks, and warehouses—and digital strategy is where efficiency is either won or lost.
We are witnessing a profound transition from reactive tracking to predictive orchestration. This shift is powered by data, but data without clarity is merely noise. The ability to visualize complex networks, predict disruptions before they occur, and communicate these insights instantly to stakeholders is becoming the definitive competitive advantage.
The market urgency is palpable. The global Supply Chain Visibility market is projected to reach USD 19.2 billion by 2033, reflecting a universal recognition that transparency is the bedrock of modern resilience. This is not just about avoiding cost; it is about capturing value. Leading organizations that have achieved end-to-end visibility have realized up to a 20% improvement in operational efficiency. This "efficiency dividend" is the prize for those who can successfully bridge the physical/digital divide.
However, capturing this value requires a visual language that can translate complex "Control Tower" data into intuitive narratives. This guide explores 30 distinct visualization styles tailored for the Supply Chain Visibility sector. It serves as a strategic framework to help you select the right visual vocabulary—from minimalist maps to holographic digital twins—ensuring your technology is not just seen, but understood and trusted.
1. The Macro-Network Visualization
TOFU | Brand Awareness

The Visual & Narrative Approach
This style utilizes a disciplined "clean room" aesthetic to depict global connectivity. The visual anchors on a stylized, clean Slate Grey world map, which serves as a low-contrast stage for the hero elements: Vivid Azure shipping routes and geometric white nodes. The dotted lines representing logistics lanes are simplified to their essence, stripping away the chaotic reality of actual shipping lanes to present a curated, idealized view of global trade. The lighting is completely flat and shadowless, ensuring that every pixel is dedicated to information conveyance rather than atmospheric depth.
Psychological Impact & KPI Focus
For a Supply Chain Manager bombarded with spreadsheet rows and messy raw data, this clean geometry offers immediate psychological relief (Cognitive Ease). It signals "Structure" and "Control." By abstracting the complex reality of multimodal transport into a clean 2D/Isometric hybrid, the viewer immediately grasps the concept of Network Reach without the cognitive load of interpreting satellite imagery. It visually promises that the software simplifies global chaos into manageable nodes.
Strategic Implementation & Trade-offs
- Best Use Case: High-frequency LinkedIn feeds (Brand Awareness) where you have milliseconds to stop the scroll.
- Duration: 6-10 Seconds (Looping).
- Trade-off: The simplicity is its strength but also its limitation; it lacks the fidelity to show granular features like "Exception Management" or specific UI dashboards.
Companies using similar video content -
Project44 – Movement – Global real-time freight visibility.
FourKites – Real-Time Visibility Platform – End-to-end supply chain tracking.
2. The Fluidity of Data Integration
TOFU | Category Creation

The Visual & Narrative Approach
This style abandons literal representation for metaphorical storytelling. It uses liquid-like shapes in Electric Teal and Lime Green that flow and merge across a Bright White digital void. These organic forms represent disparate data streams—ERP logs, carrier status updates, weather data—converging into a central point of clarity. Floating particle effects in Lime Green suggest the constant, real-time pulse of digital activity. The glossy, modern finish gives the visual a premium, tech-forward feel, while the movement implies progress and speed.
Psychological Impact & KPI Focus
This visual style addresses "Silo Anxiety"—the fear that data is fragmented and disconnected. By visualizing the merging of shapes, you subconsciously validate the desire for Data Unification. It elevates the conversation from tactical logistics (trucks and boxes) to strategic orchestration (data flow), positioning the brand as a modern innovator (Category Creator) rather than a legacy freight provider.
Strategic Implementation & Trade-offs
- Best Use Case: "Category Creation" videos on YouTube where you are defining a new methodology (e.g., "Predictive Logistics") rather than selling a specific feature.
- Duration: 30-45 Seconds.
- Trade-off: Highly engaging but abstract; it requires a strong voiceover to connect the visual metaphors to concrete business benefits like ROI or OTIF improvements.
Companies using similar video content -
E2open – Networked Supply Chain Platform – Unifying disparate supply chain data.
One Network Enterprises – NEO Platform – Orchestrating multi-party supply chain data.
3. Building the Narrative of Weight
TOFU | Market Education

The Visual & Narrative Approach
Here, the medium is the message. 3D geometric block shapes, textured to resemble industrial shipping containers, are stacked to form the structural weight of a headline. The palette—Signal Orange, Matte Navy, and Silver—mimics the standard color coding of intermodal containers. Sharp, dramatic lighting casts hard shadows, emphasizing the solidity and "heaviness" of the subject matter. The subtle corrugated metal texture on the Matte Navy background grounds the abstract typography in the physical reality of a port terminal.
Psychological Impact & KPI Focus
This style bridges the gap between the physical weight of logistics and the intellectual weight of software. It appeals to the "Builder" archetype in supply chain leaders—professionals who value tangible assets and robust infrastructure. The use of containers as building blocks visually reinforces the concept of Reliability and Capacity, commanding attention through high contrast and dimensional weight.
Strategic Implementation & Trade-offs
- Best Use Case: Short, punchy LinkedIn Organic posts (Market Education) designed to deliver a manifesto or key statistic.
- Duration: 10-15 Seconds (Vertical/Portrait).
- Trade-off: Excellent for impact and retention, but poor for explaining complex workflows. It is a "shout," not a "conversation."
Companies using similar video content -
Navis – N4 Terminal Operating System – Managing container terminal operations.
CyberLogitec – OPUS Terminal – Optimizing port and terminal logistics.
4. The Future-Tech Mobile Network
TOFU | Vertical Social Organic

The Visual & Narrative Approach
Designed for the vertical screen, this style utilizes a "Glassmorphism" aesthetic. Floating, translucent glass spheres in Electric Violet and Magenta are connected by glowing neon filaments, simulating a neural network of logistics nodes. The frosted glass effect blurs the background—a high-key bokeh reminiscent of a clean server room—creating a sense of depth without clutter. The internal glowing lighting of the spheres gives the entire composition a futuristic, "always-on" energy.
Psychological Impact & KPI Focus
This style targets the aspirational side of the persona—the forward-looking leader who wants to be associated with cutting-edge tech (AI/ML). The "Neural Network" visual metaphor implies Autonomous Intelligence. It moves away from the "gritty" reality of logistics to the "clean" ideal of digital orchestration, stopping the scroll on platforms like TikTok or Reels by promising a peek into the future.
Strategic Implementation & Trade-offs
- Best Use Case: Recruitment videos or "Culture of Innovation" content aimed at digital natives.
- Duration: 9-15 Seconds (Looping).
- Trade-off: It risks looking too sci-fi; it must be grounded with captions or voiceovers that reference real-world applications like "AI-Driven Route Optimization."
Companies using similar video content -
Tive – Solo 5G Tracker – Real-time in-transit shipment monitoring.
Nexxiot – Connect Platform – IoT solutions for rail and intermodal.
5. The Physical-Digital Bridge
TOFU | Skippable Pre-Roll Ad
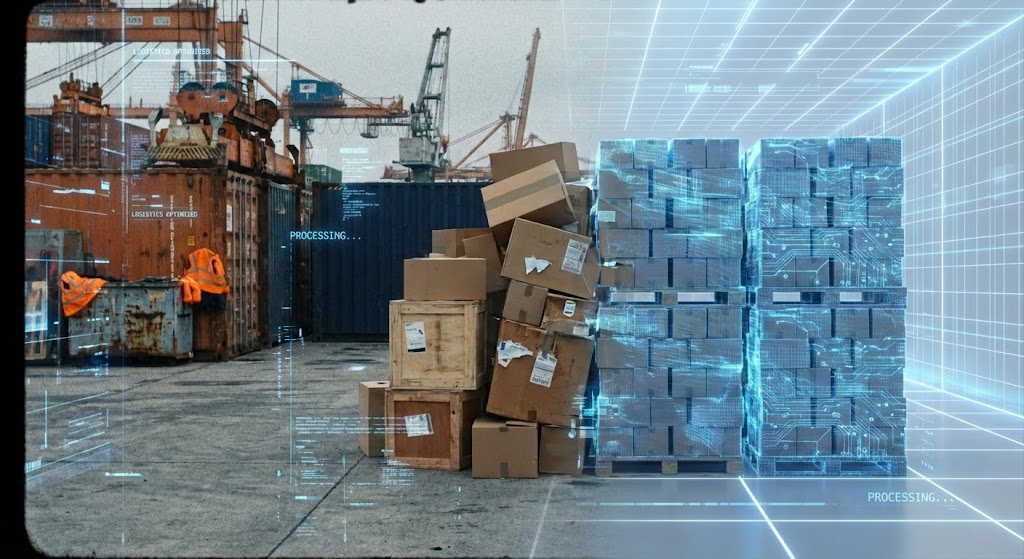
The Visual & Narrative Approach
This dynamic collage style literally visualizes "Digital Transformation." It blends the gritty, real-world textures of a shipping port (concrete, rusted metal) with clean, high-contrast digital overlays. In the center, a chaotic pile of cardboard boxes and shipping crates visually morphs into a perfectly organized, palletized stack wrapped in a glowing digital "shrink wrap" of Navy Blue data lines. The background transitions from a grey concrete floor to a clean, bright digital grid.
Psychological Impact & KPI Focus
This is a direct visual metaphor for the core value proposition: bringing order to chaos. It validates the viewer's current pain point (the chaotic pile) and immediately presents the solution (the organized digital stack). The juxtaposition of "Real" vs. "Digital" creates a high level of Visual Concordance with the industry's actual challenge—managing physical goods through digital means.
Strategic Implementation & Trade-offs
- Best Use Case: High-impact YouTube Pre-Roll ads where you need to communicate "Transformation" in the first 5 seconds to prevent skipping.
- Duration: 15-30 Seconds.
- Trade-off: The "mixed media" look can feel disjointed if the transition isn't smooth. It requires high-quality stock footage to match the fidelity of the digital overlays.
Companies using similar video content -
Blue Yonder – Luminate Platform – Bridging physical logistics with digital intelligence.
Körber Supply Chain – K.Motion WMS – Transforming warehouse operations digitally.
6. The Seamless Process Loop
TOFU | Aspiration & Identity Hook
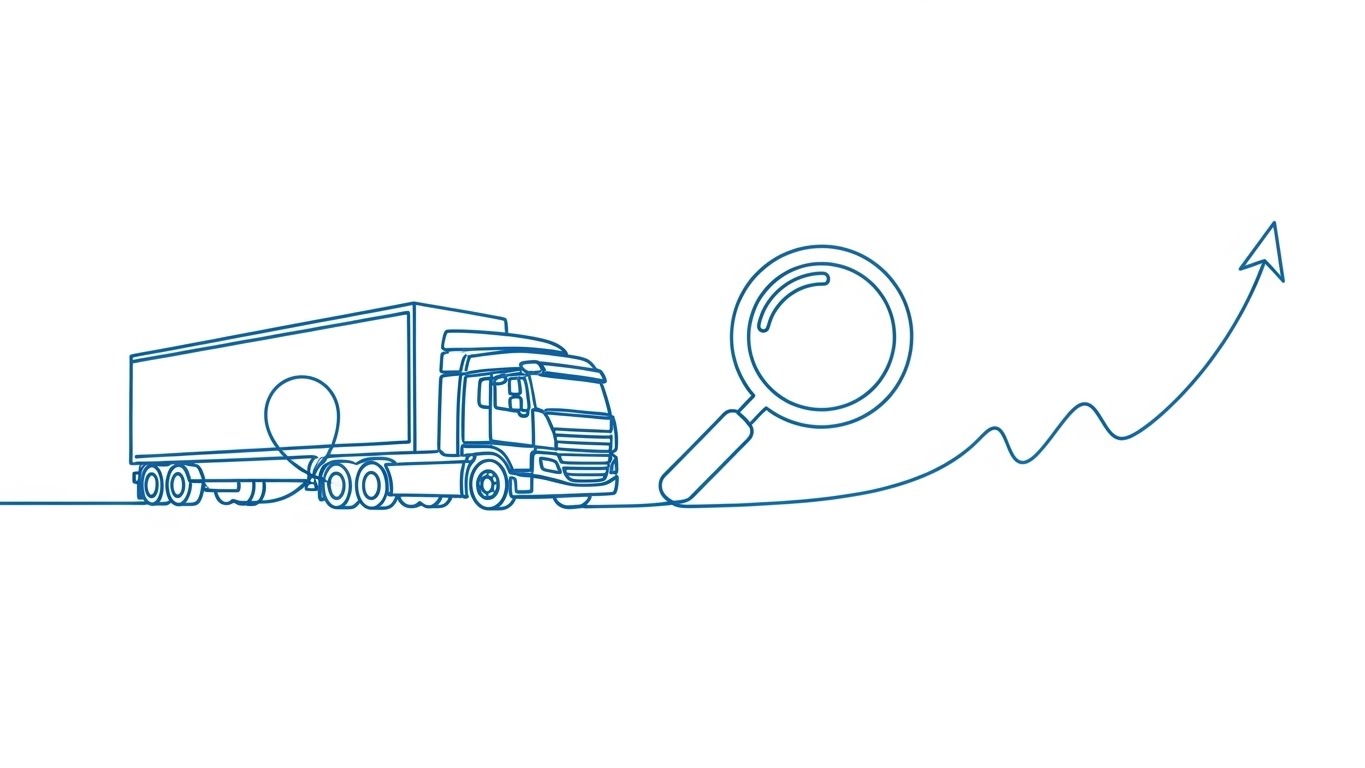
The Visual & Narrative Approach
Elegance meets precision. A single, unbroken Vivid Azure line travels across a Clean White canvas, morphing fluidly to tell a story. It forms the silhouette of a heavy-duty semi-truck, loops to become a magnifying glass (symbolizing visibility/search), and finally smoothes out into a rising trend line. The consistent stroke weight conveys stability and reliability. There are no distractions—just the pure geometry of the movement.
Psychological Impact & KPI Focus
This style appeals to the "Purist" mindset. It suggests that your software is a seamless, integrated tool that connects the dots (literally and metaphorically). The continuous line represents the End-to-End Visibility that supply chain managers seek—traceability from origin to destination without breaks. It conveys a sense of ease and flow, subtly promising that your software removes friction.
Strategic Implementation & Trade-offs
- Best Use Case: Website headers or loading screens where you want to communicate "Simplicity" and "Ease of Use" without heavy bandwidth load.
- Duration: 10-15 Seconds (Looping).
- Trade-off: It is not emotive. It works best for establishing a "Clean/Modern" brand identity but struggles to convey urgency or high stakes.
Companies using similar video content -
Kinaxis – RapidResponse – Concurrent supply chain planning and execution.
Descartes Systems Group – Logistics Technology Platform – Streamlining global logistics processes.
7. The Digital Twin Port
MOFU | Shaping Brand Perception
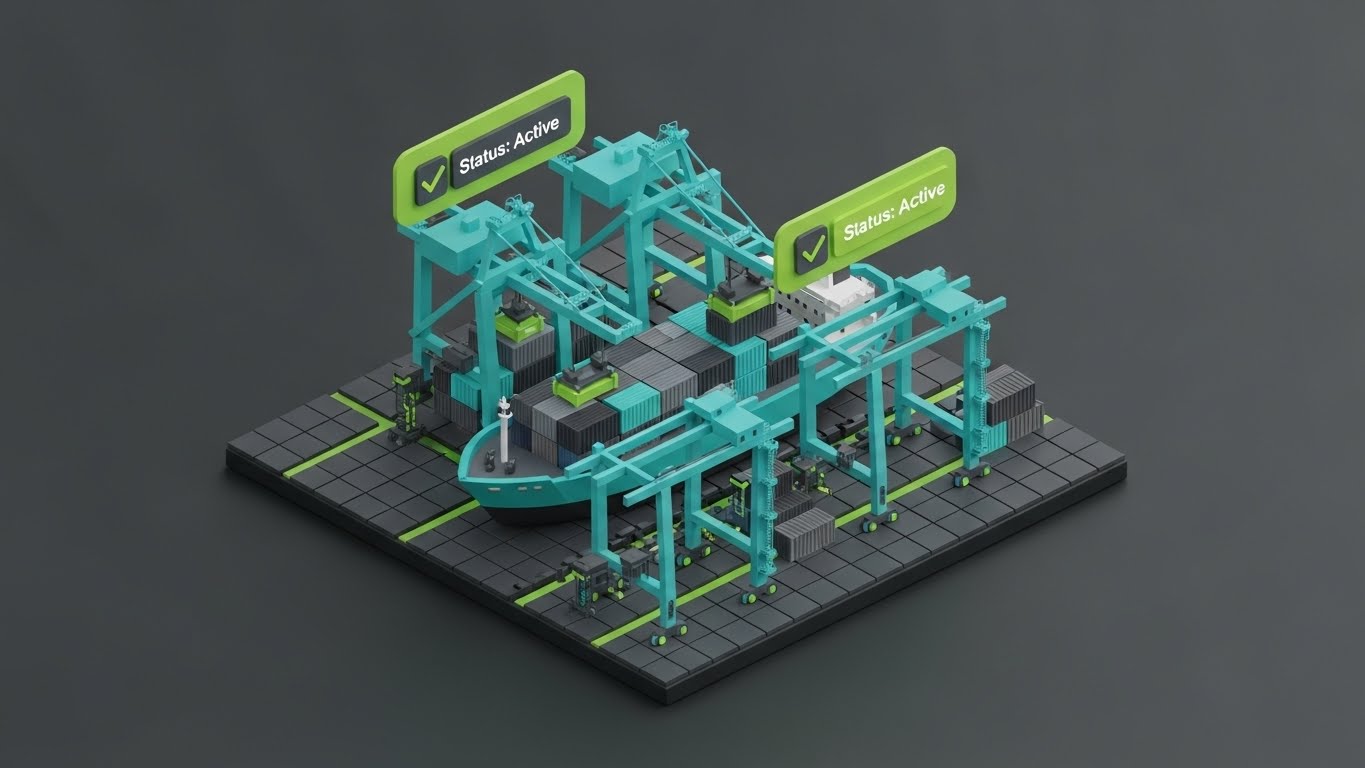
The Visual & Narrative Approach
This style utilizes a "clay-render" aesthetic to create a friendly, manageable view of a complex "Smart Port." The scene is a highly detailed miniature world: tiny, toy-like gantry cranes in Electric Teal lift containers onto a docked ship. The environment is grounded on a dark Charcoal grid. Above the machinery, Lime Green digital overlays float, displaying "Status: Active" with checkmarks. The soft global illumination gives the scene a matte, tactile finish, making the industrial machinery feel accessible.
Psychological Impact & KPI Focus
Supply chains are massive and intimidating; this style makes them look "manageable." By miniaturizing the port, you subconsciously put the viewer in a position of god-like control (The Control Tower perspective). It transforms the anxiety of managing massive infrastructure into the satisfaction of playing a strategy game. The "Active" status indicators reinforce the feeling that the system is autonomous and under control.
Strategic Implementation & Trade-offs
- Best Use Case: "How it Works" sections on landing pages. It explains the integration of physical assets and digital monitoring perfectly.
- Duration: 30-60 Seconds.
- Trade-off: Producing high-quality 3D assets is resource-intensive. It creates an expectation of a highly polished, perhaps even "gamified," user experience.
Companies using similar video content -
Siemens Digital Logistics – Digital Logistics Platform – Simulating and optimizing logistics networks.
AnyLogic – Simulation Software – Modeling complex supply chain systems.
8. The Predictive Interface Clarity
MOFU | Product/Solution Differentiation
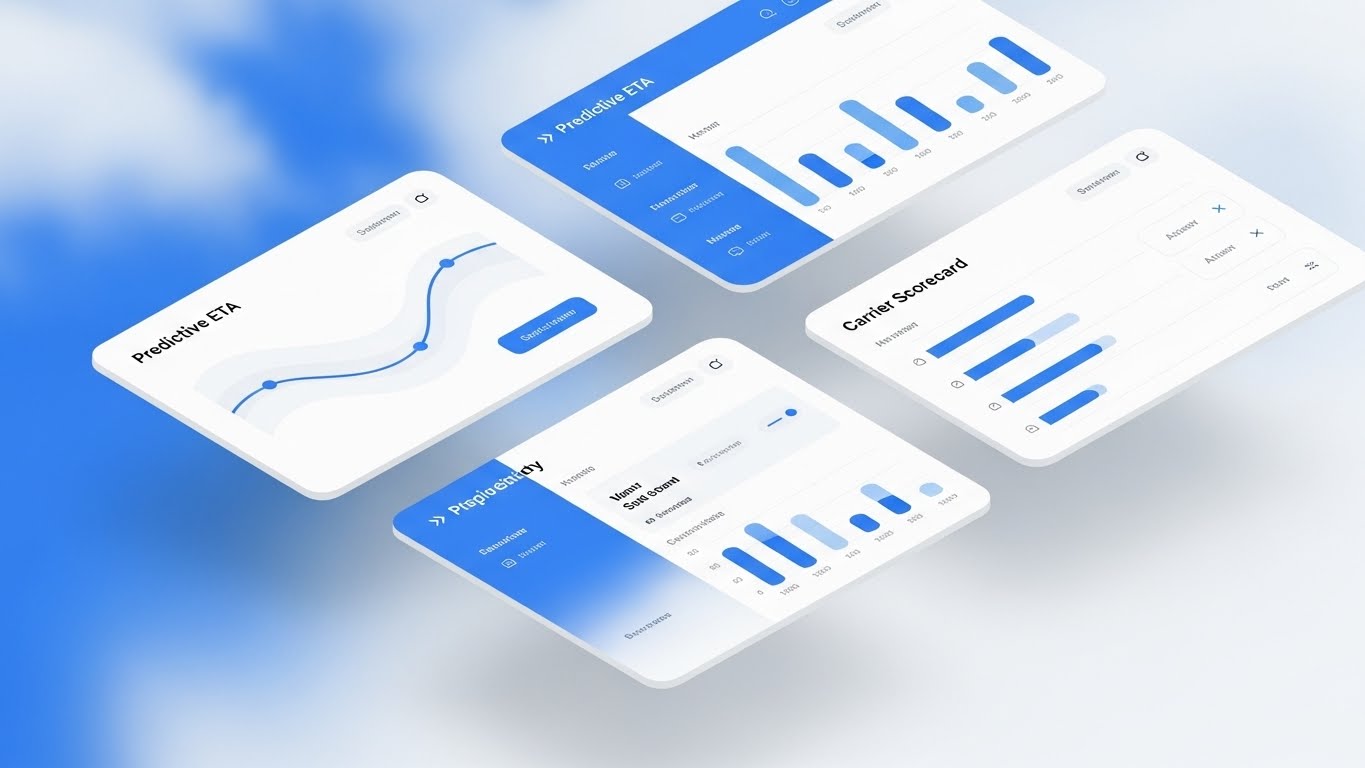
The Visual & Narrative Approach
This style focuses on the interface itself but elevates it through isometric presentation. Floating UI screens are arranged against an abstract, soft-focus Azure and White cloud computing background. The screens display crisp, white interfaces with Vivid Azure data visualizations—specifically "Predictive ETA" wave charts and "Carrier Scorecard" bar graphs. The screens have a slight Z-axis depth and soft drop shadows, making them pop as distinct, tangible layers of information.
Psychological Impact & KPI Focus
For the pragmatic buyer, the UI is the product. This style validates the User Experience (UX). By isolating specific high-value features (like ETA prediction) and presenting them in a clean, "Light Mode" aesthetic, you signal transparency and ease of daily use. It addresses the fear of "clunky, legacy software." The floating arrangement suggests that these modules are flexible and cloud-native.
Strategic Implementation & Trade-offs
- Best Use Case: Product walkthroughs and feature highlight carousels on LinkedIn. It proves you have a real, working product, not just vaporware.
- Duration: Static or Micro-motion (5-10 Seconds).
- Trade-off: You must ensure the UI shown is close to the actual product. Over-polishing here can lead to disappointment during the demo phase if the real software is less attractive.
Companies using similar video content -
Everstream Analytics – Supply Chain Risk Platform – Clarifying predictive risk insights.
Relex Solutions – Living Retail Platform – Forecasting demand and optimizing inventory.
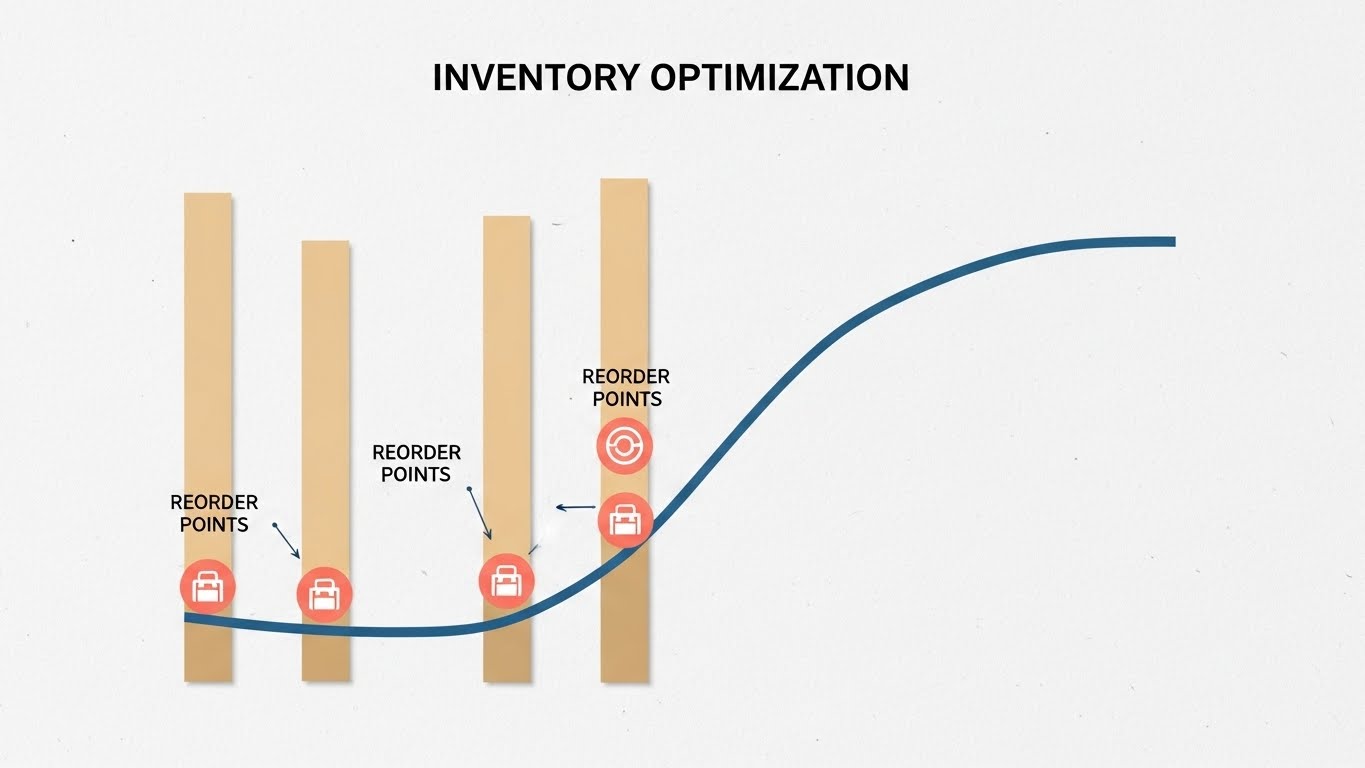
9. Precision in Inventory Logic
MOFU | Feature Education
The Visual & Narrative Approach
A clean, flat vector infographic style designed for rapid comprehension. The palette—Soft Coral, Warm Beige, and Steel Blue—is professional and distinct from the typical "tech blue." The visual centers on an "Inventory Optimization" chart: Beige bars representing stock levels align with a rising Steel Blue demand curve. Floating circular icons in Soft Coral highlight critical "Reorder Points." The background texture subtly mimics high-quality paper, adding a layer of sophistication.
Psychological Impact & KPI Focus
This appeals to the "Analyst" persona—the stakeholder who needs to justify the investment with hard numbers. It visualizes the concept of Inventory Balance (supply vs. demand). The clear marking of "Reorder Points" visualizes the specific value add: automation of decision-making. It strips away all "marketing fluff" to focus purely on the logic of the solution, building trust through data transparency.
Strategic Implementation & Trade-offs
- Best Use Case: Deep-dive blog posts or whitepapers about specific KPIs (e.g., "Reducing Safety Stock").
- Duration: Static Image or 5-10 Second GIF.
- Trade-off: It is static and dry. It relies heavily on the surrounding text to explain why this chart matters.
Companies using similar video content -
EazyStock – Inventory Optimization Software – Automating reorder points and stock levels.
Netstock – Inventory Optimization – Balancing inventory to meet demand.
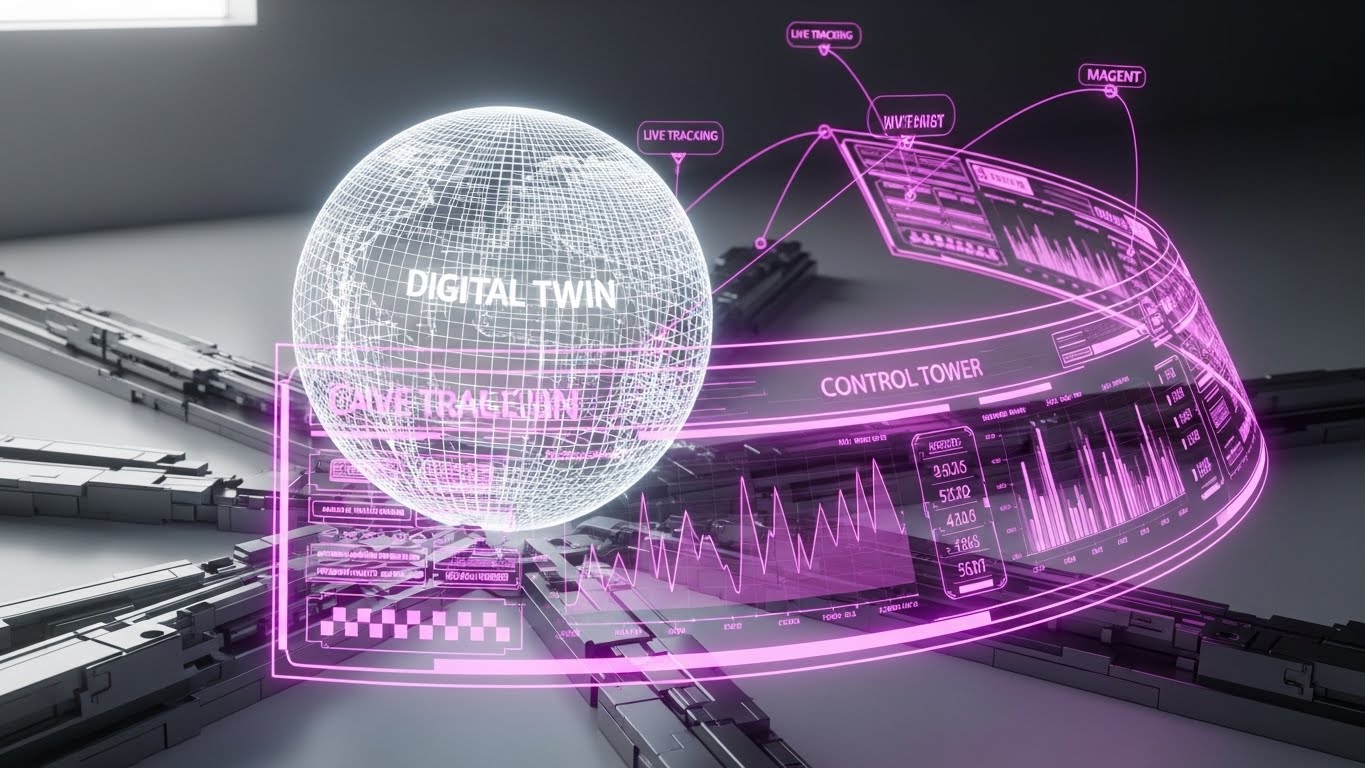
10. The Global Command Center
MOFU | Building Trust & Credibility
The Visual & Narrative Approach
This is the "Hero Shot" of supply chain technology. A 3D wireframe "Digital Twin" globe glows in the center of a clinical, white clean-room environment. Wrapped around this globe is a curved, holographic dashboard in Electric Violet and Magenta. The dashboard displays "Live Tracking" pings and connection lines that physically link to the globe. The UI elements are semi-transparent and glowing, emphasizing that the software is a "Control Tower" overlaying the physical world.
Psychological Impact & KPI Focus
This style taps into the "Command Center" fantasy. It visually represents the ultimate goal of supply chain visibility: total, god-like oversight of the global network from a single pane of glass. The clinical white background suggests sterile precision and error-free operations. It positions the software as a high-end, Enterprise-Grade solution capable of handling massive complexity without breaking a sweat.
Strategic Implementation & Trade-offs
- Best Use Case: The primary hero section of your product page. It establishes immediate authority and high perceived value.
- Duration: 15-20 Seconds (Looping).
- Trade-off: It can appear "expensive" and complex. Ensure your copy reassures the user that despite the sophisticated look, the onboarding process is streamlined.
Companies using similar video content -
Controlant – [Real-time global cold chain monitoring].
Project44 – Movement – Centralized view of global freight.
11. The Validation of Success
MOFU | Driving Demo Requests

The Visual & Narrative Approach
This style employs a "Corporate Memphis" aesthetic to humanize the user experience. A stylized logistics manager, designed with approachable, diverse features, interacts with a floating tablet in a minimalist Soft Coral and Steel Blue environment. The narrative beat is singular and triumphant: the character points to a massive, glowing "Green Checkmark" on the screen. The background is composed of simple Warm Beige geometric shapes that frame the action, ensuring the viewer's eye is guided directly to the symbol of success.
Psychological Impact & KPI Focus
This visual triggers a micro-dose of dopamine—the "Success State." It visually answers the prospect's subliminal question: "What does it feel like to use this software?" By showing a calm, happy user achieving a clear result (the Green Checkmark), you validate the Ease of Adoption. It counters the fear of complex, frustrating software implementations, presenting the demo request not as a technical hurdle, but as a path to operational relief.
Strategic Implementation & Trade-offs
- Best Use Case: Social Media Retargeting ads (LinkedIn/Meta) aimed at users who visited the pricing page but didn't convert.
- Duration: 15-20 Seconds.
- Trade-off: The "cartoonish" style can feel too casual for enterprise heavyweights if not balanced with sharp copy. It sells the feeling of the solution, not the technical specs.
Transitioning from individual user success to market dominance, the next style uses cinematic scale to displace competitors.
Companies using similar video content -
Bringg – Delivery Orchestration Platform – Ensuring successful last-mile deliveries.
DispatchTrack – Last Mile Delivery Software – Confirming delivery completion and satisfaction.
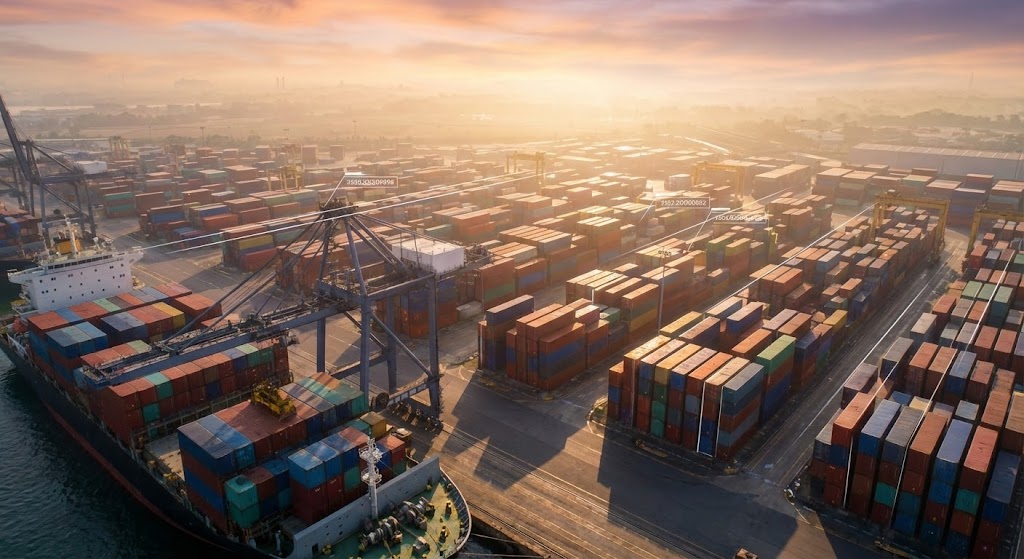
12. The Cinematic Scale of Logistics
MOFU | Competitive Displacement
The Visual & Narrative Approach
Leveraging the power of Generative AI, this style creates a high-budget, documentary-grade visual of global scale. It opens with a breathtaking aerial drone shot of a massive container terminal bathed in Golden Hour sunlight. Long shadows stretch from colorful stacks of containers, creating a sense of drama and reality. A large cargo ship is being loaded in the foreground. Subtle, white augmented reality (AR) graphics overlay specific containers, tracking their movement with precision. The aesthetic is "National Geographic meets Silicon Valley."
Psychological Impact & KPI Focus
This style is a play for Market Dominance. It suggests that your software handles the "Real World" of massive physical logistics, not just abstract data. For the Operations Director, this validates Scale and Robustness. It visually displaces competitors who use cheap stock footage or basic vector graphics, positioning your brand as the premium, enterprise-grade choice capable of managing global complexity.
Strategic Implementation & Trade-offs
- Best Use Case: YouTube TrueView ads or background video for "Enterprise Solutions" web pages.
- Duration: 30-60 Seconds.
- Trade-off: While visually stunning, Gen-AI video requires careful curation to avoid artifacts (e.g., garbled text on containers). It establishes a very high brand promise that the actual product UI must live up to.
As we move to the Bottom-of-Funnel, we must translate this scale into hard currency for the Economic Buyer.
Companies using similar video content -
C.H. Robinson – Navisphere – Managing global freight and logistics at scale.
Maersk – Maersk Flow – End-to-end logistics and supply chain services.
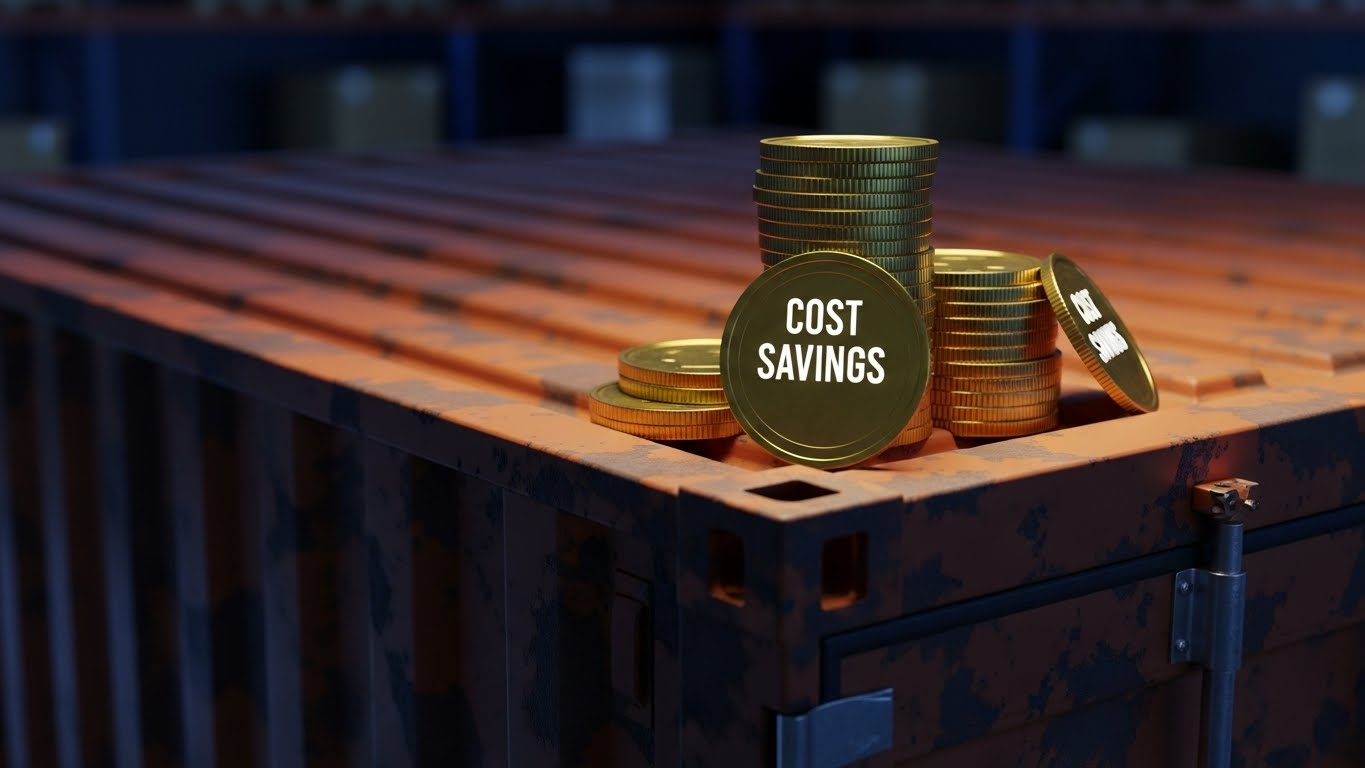
13. The Monetization of Metal
BOFU | ROI Justification
The Visual & Narrative Approach
Here, we visualize the financial bottom line. The scene is a hyper-realistic macro shot using Octane-style lighting to render the rusted, tactile metal texture of a Signal Orange shipping container. The lighting casts deep Navy Blue shadows, creating a dramatic contrast. Balanced perfectly on the corner of this heavy industrial object are stacks of realistic gold coins with the text "COST SAVINGS" embossed on a central token. The background is a shallow-depth-of-field blur of a warehouse, keeping the focus intensely on the value proposition.
Psychological Impact & KPI Focus
This targets the "Economic Buyer" (CFO/Procurement). It translates intangible software benefits (efficiency, visibility) into the universal language of business: Hard Currency. By physically stacking gold on the shipping container, you create a powerful visual metaphor for Value Extraction—showing that there is money hiding in their supply chain assets waiting to be unlocked by your software.
Strategic Implementation & Trade-offs
- Best Use Case: Sales decks and "ROI Calculator" landing pages.
- Duration: Static Image or Slow Pan (5-10 Seconds).
- Trade-off: It is a blunt instrument. It speaks only to money, not to feature functionality or user experience. It works best when paired with data on "Reduced Detention Fees."
To protect this value, the software must also demonstrate deep intelligence and risk mitigation.
Companies using similar video content -
Coupa – Business Spend Management – Driving cost savings across the supply chain.
Oracle SCM Cloud – Supply Chain & Manufacturing – Maximizing financial returns from assets.
14. Multi-Layered Risk Intelligence
BOFU | Risk Mitigation
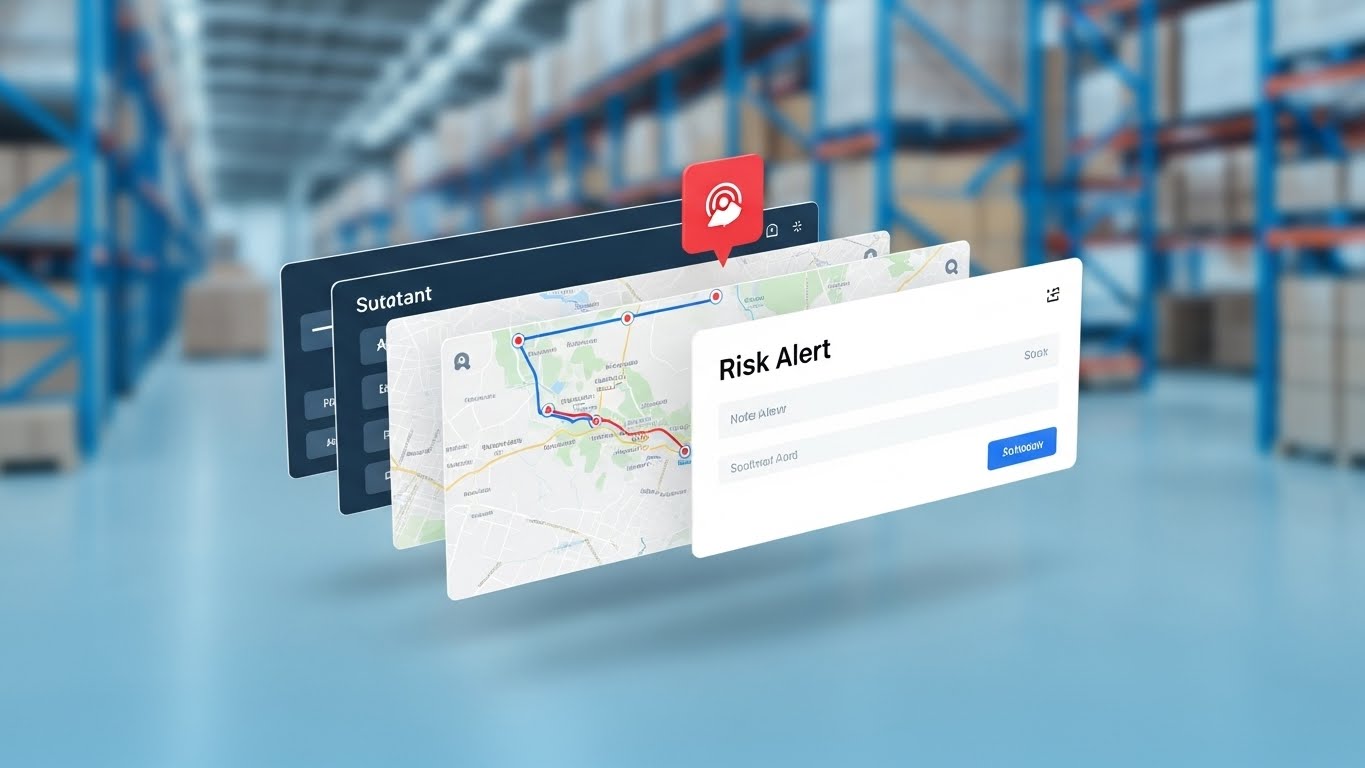
The Visual & Narrative Approach
This style deconstructs the software's logic using depth. The composition features UI interface layers separated in 3D space. The frontmost layer is a crisp "Risk Alert" notification card with a red icon popping out towards the viewer. The middle layer displays a detailed route map in Vivid Azure. The background layer is a blurred, high-quality photo of a busy warehouse. The parallax camera movement creates a sense of immersion, as if the viewer is looking into the data stack.
Psychological Impact & KPI Focus
This visual alleviates Risk Anxiety. Supply chain leaders are paid to prevent disasters; this style visualizes the software as a multi-layered shield. The depth suggests thoroughness—that your system looks deeper than surface-level tracking. By bringing the "Risk Alert" to the absolute foreground, you emphasize Proactive Exception Management, promising that the user will see problems before they impact the bottom line.
Strategic Implementation & Trade-offs
- Best Use Case: Feature pages focused on "Risk Management" or "Compliance."
- Duration: 10-15 Seconds (Looping).
- Trade-off: The complexity of the layered design requires a larger screen to be fully appreciated; it may feel cluttered on small mobile screens.
The promise of risk management relies on the accuracy of the digital twin. The next style proves that the plan matches reality.
Companies using similar video content -
Resilinc – Eventwatch AI – Proactive supply chain risk monitoring.
Riskmethods (Sphera) – Supply Chain Risk Management – Identifying and mitigating supply chain threats.
15. From Blueprint to Pavement
BOFU | Competitive Comparison
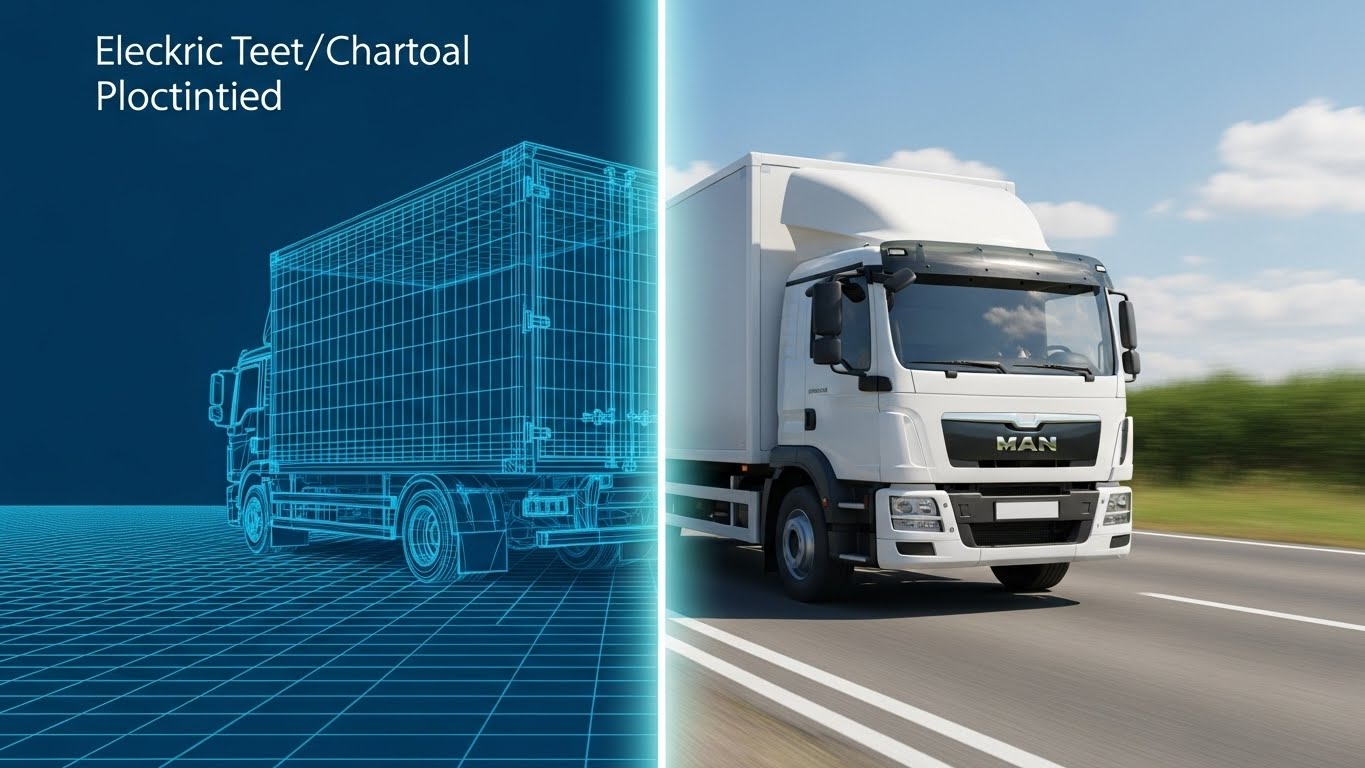
The Visual & Narrative Approach
A vertical split-screen composition that tells a "Before and After" story. The left side reveals a blue wireframe blueprint of a delivery truck on an Electric Teal grid, representing the "Plan" or "Optimization Model." The right side shows the fully rendered, photorealistic white delivery truck driving on a realistic asphalt road under natural daylight. A glowing vertical line separates the two worlds, moving slightly to reveal how the digital plan perfectly matches the physical reality.
Psychological Impact & KPI Focus
This is a powerful trust signal. It validates the Accuracy of Prediction. A common pain point is that "planning software doesn't survive the real world." This visual proves the concordance between your digital twin (wireframe) and actual operations (photo). It appeals to the "Skeptic" persona who needs to know that the algorithm's theoretical efficiency translates to real-world rubber on the road.
Strategic Implementation & Trade-offs
- Best Use Case: Case study headers or "Accuracy" proof points in sales presentations.
- Duration: 6-10 Seconds (Sliding transition).
- Trade-off: It requires high-fidelity matching between the 3D wireframe and the stock photo/footage. If the trucks don't align perfectly, the metaphor fails.
For the technical gatekeepers who must integrate this system, we need to speak their language: Code.
Companies using similar video content -
Trimble Transportation – Fleet Management Solutions – Optimizing routes from plan to execution.
Motive (KeepTruckin) – AI Dashcam – Ensuring planned routes match real-world driving.
16. The Developer’s Dark Mode Canvas
BOFU | The Technical Buyer
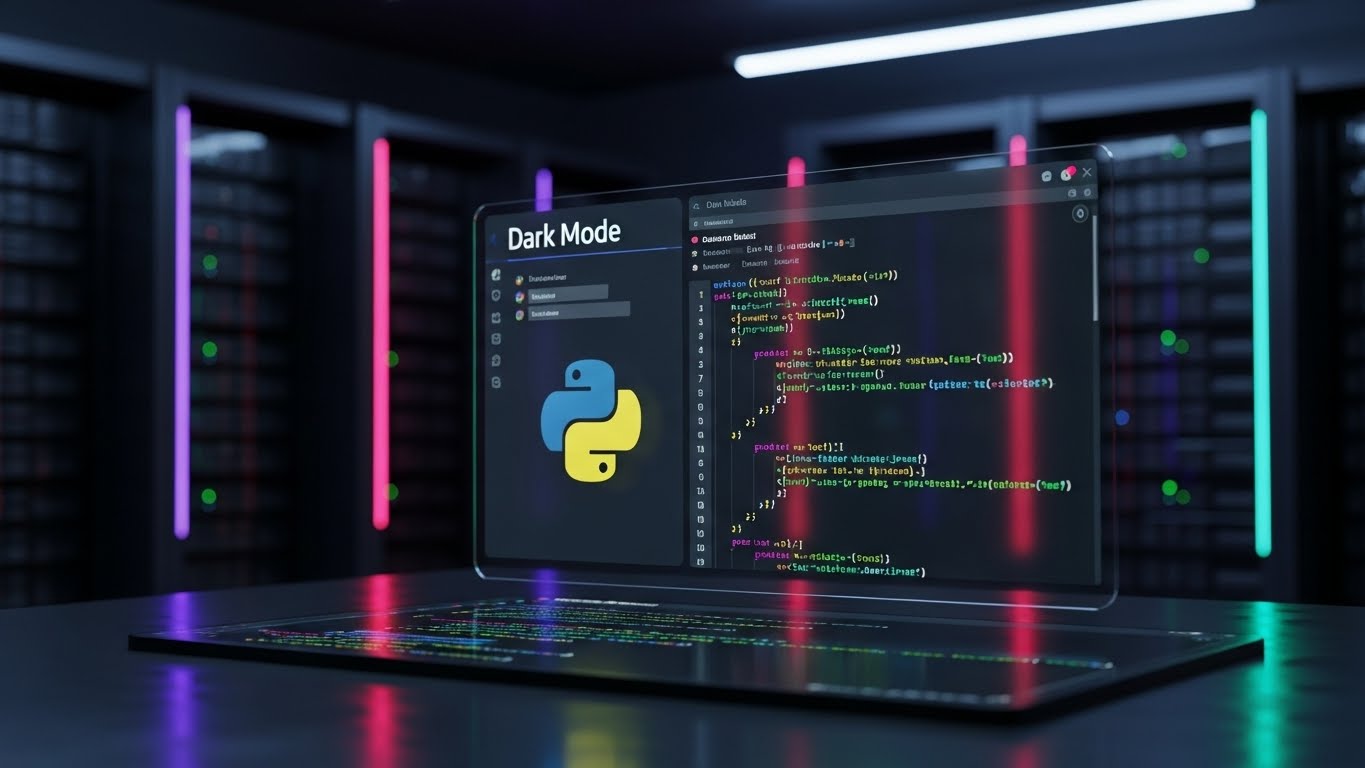
The Visual & Narrative Approach
Designed specifically for the "Gatekeeper" (CTO or IT Director), this style abandons marketing gloss for technical grit. It features a sleek Dark Mode interface in Deep Grey. The screen displays a code editor window with syntax-highlighted JSON data structures (in Neon Blue and Green) representing "API Integration." To the right, a dark-themed network node graph visualizes the data relationships. The background is a subtle, abstract circuit board pattern, keeping the focus on the code.
Psychological Impact & KPI Focus
This style screams Developer Experience (DX). It addresses the fear of "Integration Nightmares." By showing clean, structured JSON and modern API documentation, you signal that the platform is open, extensible, and built by developers, for developers. It validates Interoperability, a critical KPI for the technical team that will actually have to implement the solution.
Strategic Implementation & Trade-offs
- Best Use Case: Technical documentation pages (API Docs), Developer Portals, or "Integration" blog posts.
- Duration: Static or Micro-scroll (5-10 Seconds).
- Trade-off: It is alienating to non-technical buyers. Do not use this for the CEO or VP of Sales; it looks like "work" rather than "results."
While the backend is crucial, the daily user cares about the tactile feel of the tool.
Companies using similar video content -
Odoo – SCM Module – Open-source ERP with customizable supply chain features.
OriginTrail – Decentralized Knowledge Graph – Building transparent supply chain data solutions.
17. The Tactile Moment of Decision
BOFU | The Functional Buyer

The Visual & Narrative Approach
We zoom in to an extreme macro close-up—the view of the user in the moment of action. The palette utilizes Signal Orange for the primary call-to-action. The focus is a high-fidelity "Approve Shipment" button in the "pressed" state, emitting a soft, reactive orange glow. A stylized mouse cursor is just lifting off the button. The faint texture of screen pixels is visible, grounding the software in reality.
Psychological Impact & KPI Focus
This appeals to the "Functional Buyer"—the dispatcher or logistics coordinator who lives in the tool. It validates Usability and Responsiveness. The tactile quality of the button press visualizes the power of the user's decision. It transforms a mundane click into a "Mission Control" moment, reinforcing the idea that the software empowers the user to take decisive, effective action (e.g., Instant Dispatch).
Strategic Implementation & Trade-offs
- Best Use Case: Email campaigns announcing new features or "User Tips" newsletters.
- Duration: 3-5 Seconds (Looping GIF).
- Trade-off: It is extremely narrow in scope. It shows how to do something, but not why. It builds user affinity but not necessarily executive buy-in.
To reveal the hidden value in the broader warehouse, we use a visual metaphor for transparency.
Companies using similar video content -
Samsara – Vehicle Gateways – Real-time fleet data for immediate action.
Geotab – Telematics Device – Empowering drivers with actionable insights.
18. X-Ray Vision into Value
BOFU | The Economic Buyer
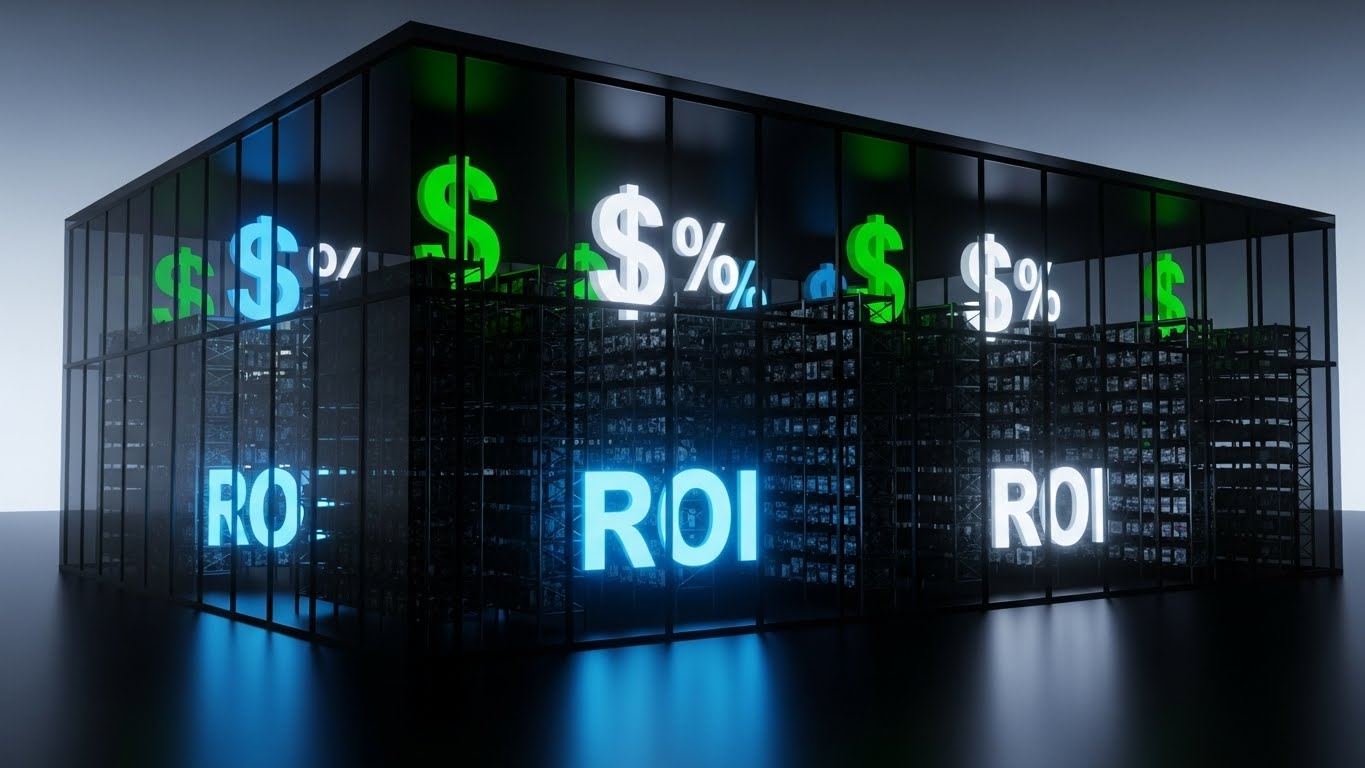
The Visual & Narrative Approach
This style uses a "Superman Vision" metaphor. A modern distribution center is rendered with semi-transparent, glass-like walls in Vivid Azure. Inside, instead of standard cardboard boxes, the shelves are stacked with glowing 3D dollar signs and "ROI" percentage symbols. The floor reflects these glowing contents against a clean, clinical white gradient background. The aesthetic is futuristic yet financially grounded.
Psychological Impact & KPI Focus
This creates a direct link between Inventory Visibility and Financial Liquidity. It helps the viewer see their warehouse not as a cost center (storing boxes), but as a value center (storing capital). It addresses the "Working Capital" KPI, suggesting that the software provides the transparency needed to unlock cash tied up in safety stock. It makes the "hidden value" of supply chain optimization undeniably visible.
Strategic Implementation & Trade-offs
- Best Use Case: Whitepapers or PDF downloads focused on "Supply Chain Finance" or "Inventory Optimization."
- Duration: Static or Slow Rotation (10-15 Seconds).
- Trade-off: It is highly metaphorical. It requires accompanying text to explain how the software converts boxes into dollars (e.g., through faster turnover).
Real-world operations require a symbiosis between the worker and the data.
Companies using similar video content -
ToolsGroup – Service Optimizer 99+ – Unlocking hidden inventory value.
Slimstock – Slim4 – Revealing working capital tied in stock.
19. The Human-Data Symbiosis
BOFU | ROI Justification Hook
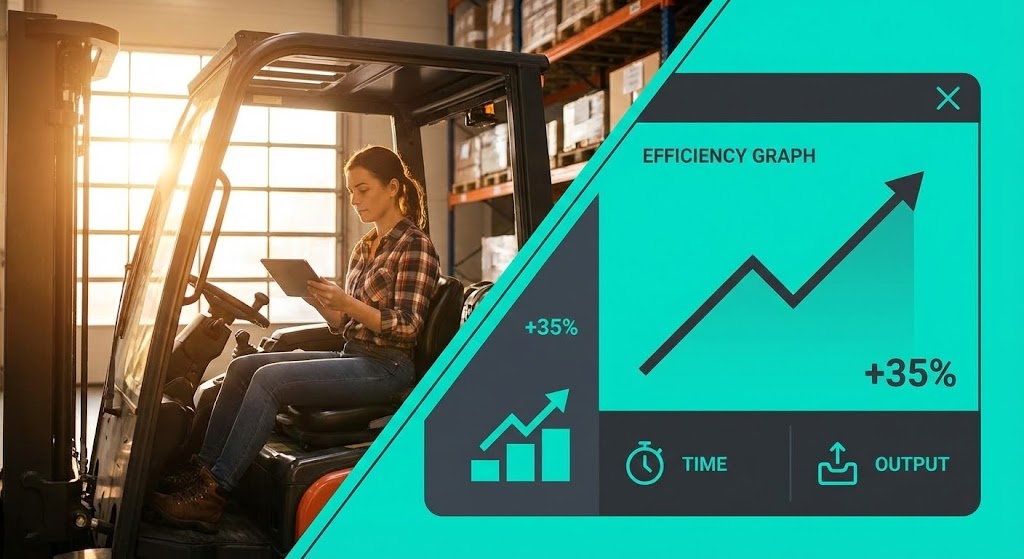
The Visual & Narrative Approach
A dynamic diagonal line splits the composition. The left half features a high-quality photograph of a warehouse forklift driver checking a tablet, bathed in warm, natural light. The right half displays a sharp, vector UI panel in Electric Teal and Charcoal, featuring a prominent "Efficiency Graph" trending upward (+35%). The layout visually connects the human effort with the digital result.
Psychological Impact & KPI Focus
This style bridges the gap between Workforce Management and Data Analytics. It validates the concept that the software augments the worker rather than replacing them. For the Operations Manager concerned about labor efficiency, this visualizes the Productivity Uplift. It anchors the abstract "35% increase" statistic to a real human face, making the ROI claim feel tangible and human rather than cold and algorithmic.
Strategic Implementation & Trade-offs
- Best Use Case: LinkedIn Display Ads or Case Study hero images.
- Duration: Static.
- Trade-off: The stock photography must be authentic; if the worker looks like a model in a pristine studio, the credibility of the "Real World" half is lost.
Finally, we accelerate the sales cycle by showing the sheer breadth of the platform.
Companies using similar video content -
Manhattan Associates – Active Warehouse Management – Enhancing worker productivity with data.
Tecsys – Omni-Channel Fulfillment Platform – Connecting human effort to operational efficiency.
20. The Velocity of Integrated Insight
BOFU | Sales Cycle Acceleration
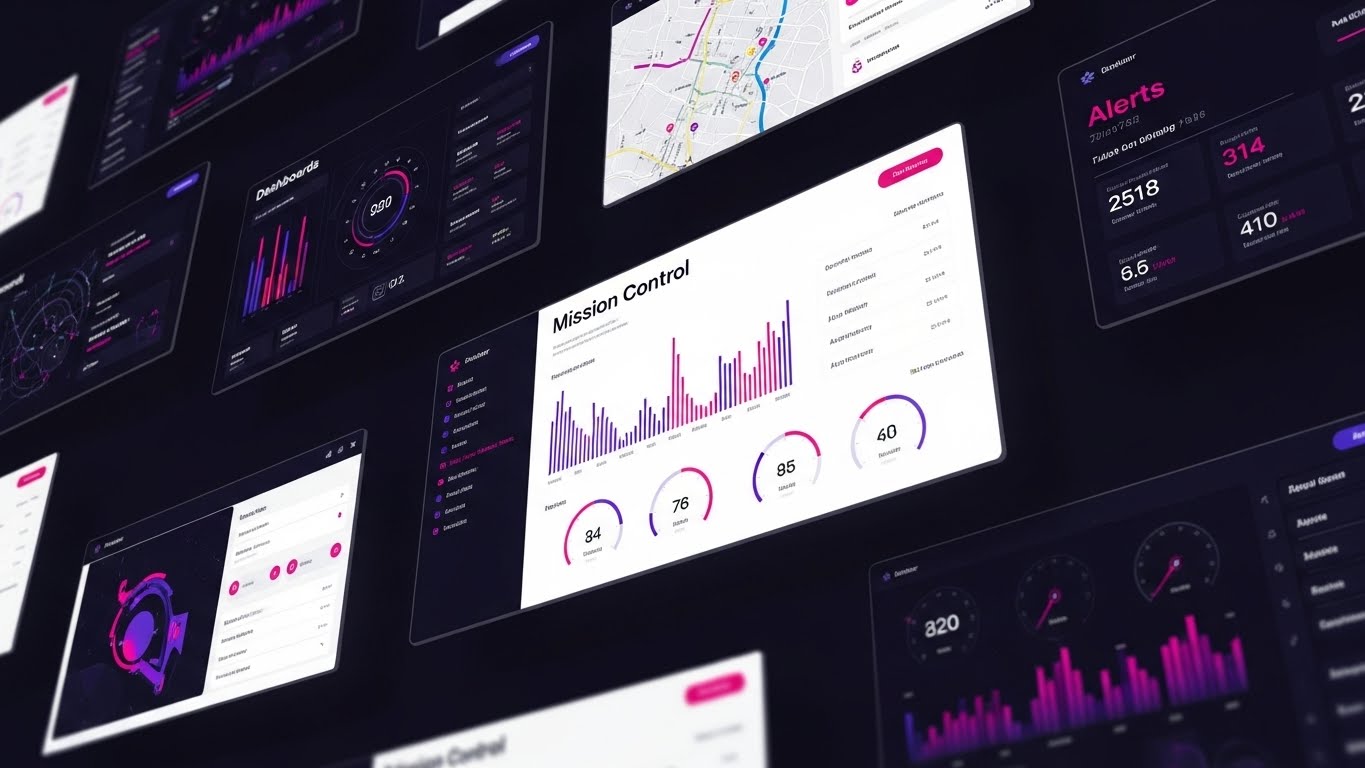
The Visual & Narrative Approach
A visual montage designed to imply speed and comprehensiveness. Multiple UI screens—Dashboards, Maps, Alerts—in Electric Violet and Magenta are layered and angled as if flying past the viewer in a digital tunnel. Motion blur effects on the edges suggest high velocity. The center screen remains in sharp focus, displaying a "Mission Control" dashboard on a white background.
Psychological Impact & KPI Focus
This serves as the "Closing Argument." It overwhelms the viewer (positively) with the sheer breadth of the platform's capabilities. It targets Platform Consolidation—showing that you have a tool for everything (maps, analytics, alerts). The speed of the montage subconsciously signals Agility and Time-to-Value, suggesting that once implemented, the organization will move faster.
Strategic Implementation & Trade-offs
- Best Use Case: The final frames of a demo video or an "Email Nurture" footer for stalled prospects.
- Duration: 5-10 Seconds.
- Trade-off: It sacrifices detail for impact. The viewer won't read the screens; they will just feel the volume of the solution. It is an impression play, not an education play.
Companies using similar video content -
E2open – Global Trade Management – Rapidly integrating global trade data.
Blue Yonder – Luminate Control Tower – Accelerating insights across the supply chain.
21. The Flow of Continuous Onboarding
Onboarding | Reducing Implementation Friction

The Visual & Narrative Approach
This style captures the kinetic energy of implementation. It utilizes a long-exposure hyper-lapse technique, turning a busy highway into a river of light. The dark night setting provides high contrast for the Signal Orange and Red taillights, which streak across the frame. Overlaying this organic chaos are structured, clean white data lines and floating coordinate tags (e.g., "LAT 34.05"). The visual transforms raw traffic into a quantified, managed data stream.
Psychological Impact & KPI Focus
The onboarding phase is often plagued by "Implementation Friction"—the fear that getting started will be slow and painful. This visual counteracts that anxiety by emphasizing Velocity and Flow. The fast-forward motion implies that the setup process is rapid and automated. It assures the client that their data will start flowing immediately, validating the Time-to-Value KPI. It frames the software as a layer of order on top of the existing physical infrastructure.
Strategic Implementation & Trade-offs
- Best Use Case: "Welcome to the Platform" introduction videos sent immediately after contract signing.
- Duration: 6-10 Seconds (Background Loop).
- Trade-off: It is atmospheric, not instructional. It sets the mood for speed but does not teach the user how to use the software.
Companies using similar video content -
Tive – SenseNext – Streamlining sensor deployment and data flow.
Roambee – BeeSense – Rapidly activating real-time asset tracking.
22. The Autonomy of Self-Service
Onboarding | Self-Serve Onboarding

The Visual & Narrative Approach
To encourage self-sufficiency, we use a friendly, illustrative approach. A 2D vector character, designed with approachable proportions, sits at a clean desk. The palette is calming: Soft Coral walls, Warm Beige furniture, and a Steel Blue laptop. The screen on the laptop is clearly visible, showing a "Self-Serve Onboarding" checklist with satisfying green checkmarks appearing one by one. The perspective is over-the-shoulder, inviting the viewer to step into the user's shoes.
Psychological Impact & KPI Focus
This style directly addresses "Support Dependency"—the fear that the user will need to call a rep for every small setting. By showing a relaxed character successfully completing the setup alone, you validate Self-Serve Adoption. The checklist visual triggers a "Completion Bias," motivating the new user to achieve that same state of "All Checked" satisfaction. It creates a friendly, low-pressure environment for learning.
Strategic Implementation & Trade-offs
- Best Use Case: In-App "First Login" wizards or "Getting Started" email sequences.
- Duration: 30-45 Seconds.
- Trade-off: The "cartoon" aesthetic can feel lightweight. It must be paired with clear, technical voiceovers to ensure the user knows this is serious training, not just a greeting.
Companies using similar video content -
ERPNext – Supply Chain Module – User-friendly self-setup for SCM.
Odoo – Inventory Management – Empowering users with self-service inventory control.
23. The Pristine First Impression
Onboarding | Trial/Freemium User Activation
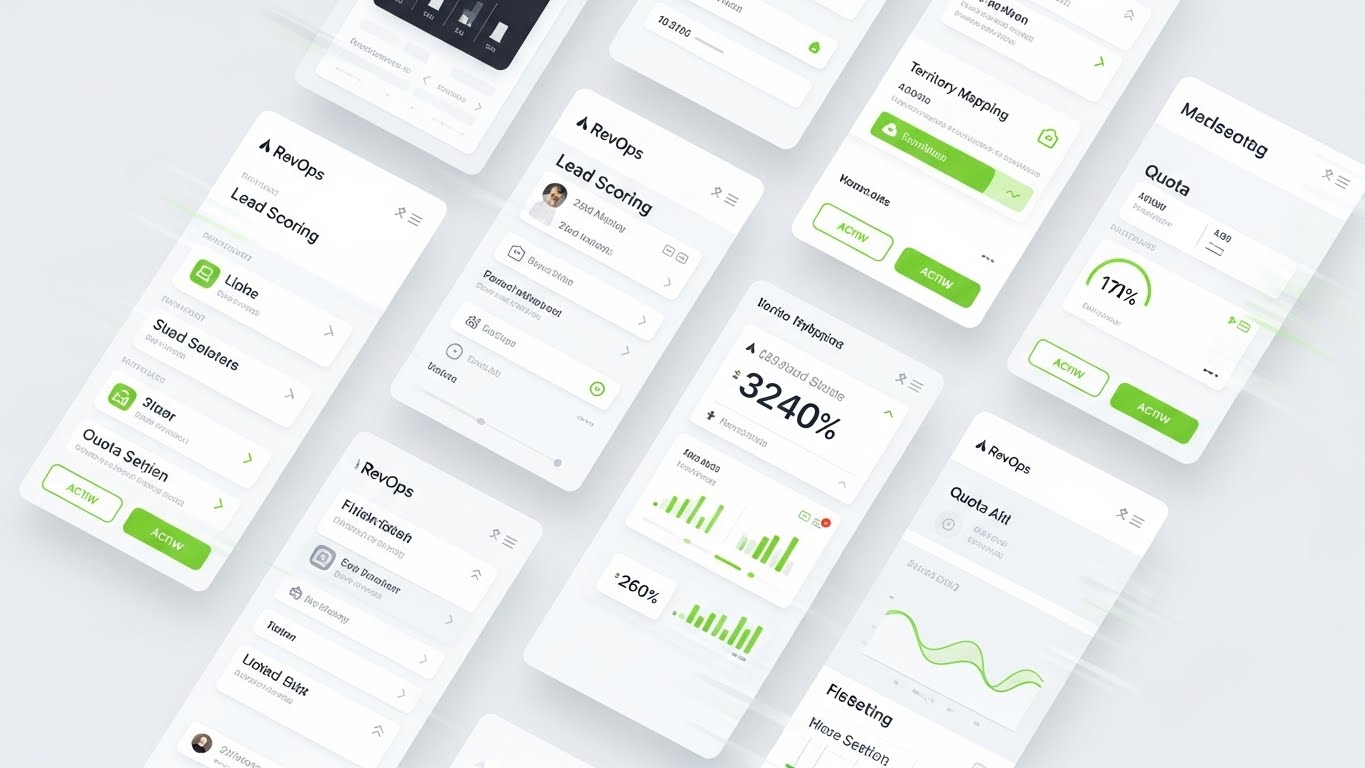
The Visual & Narrative Approach
Here, the product is the hero, stripped of all distractions. We see a series of high-fidelity mobile UI screens floating in a bright, white void. The interface is spacious, utilizing Electric Teal and Lime Green buttons against a crisp white background to guide the eye. A stylized motion-graphic cursor hovers decisively over the "Active" and "Connect" buttons. The floating arrangement suggests a modular, cloud-based architecture that is light and accessible.
Psychological Impact & KPI Focus
For Freemium or Trial users, the first 60 seconds are critical. This style focuses on Activation Rate. By highlighting the clean, "Light Mode" aesthetic, it promises a Cognitive Ease that legacy logistics software lacks. The prominent "Green" status indicators subconsciously signal that the system is "Go" and ready for business. It removes the intimidation factor of complex enterprise dashboards.
Strategic Implementation & Trade-offs
- Best Use Case: "Feature Tour" modals that pop up when a user accesses a new module for the first time.
- Duration: 10-15 Seconds (Step-by-step).
- Trade-off: It shows the "Happy Path" only. It doesn't depict how the UI handles errors or complex exception data, which can be misleading if the actual experience is messier.
Companies using similar video content -
Onfleet – Driver App – Clean UI for quick driver onboarding.
DispatchTrack – Driver App – Intuitive interface for new delivery personnel.
24. Gamifying the Last Mile
Onboarding | Accelerating Time-to-Value

The Visual & Narrative Approach
To train drivers without boring them, this style uses a "Video Game" aesthetic. A low-poly white delivery van speeds along a glowing Vivid Azure track floating in a blue digital void. The environment is stripped of realistic detail—no trees, no traffic—just the vehicle and the goal. The van approaches a giant, floating "Destination Pin." Geometric "speed lines" trail behind the vehicle, creating a sense of forward momentum and fun.
Psychological Impact & KPI Focus
This style leverages Gamification to boost Driver Engagement. Drivers often resist new tracking apps, viewing them as surveillance. By presenting the app usage as a stylized game (hitting the destination pin), you reframe the interaction from "Compliance" to "Achievement." The simplified visuals also ensure that the core message (Drive -> Arrive -> Pin) is understood instantly, regardless of the driver's native language.
Strategic Implementation & Trade-offs
- Best Use Case: Mobile-first training modules for drivers/couriers.
- Duration: 15-30 Seconds.
- Trade-off: It is highly abstract. It cannot be used to show specific button clicks within the app; it is purely for concept reinforcement and engagement.
Companies using similar video content -
Bringg – Driver App – Engaging drivers with gamified delivery tasks.
Onfleet – Driver App – Simplifying driver training through interactive elements.
25. The Empathy of Support
Retention | Reducing Support Overhead
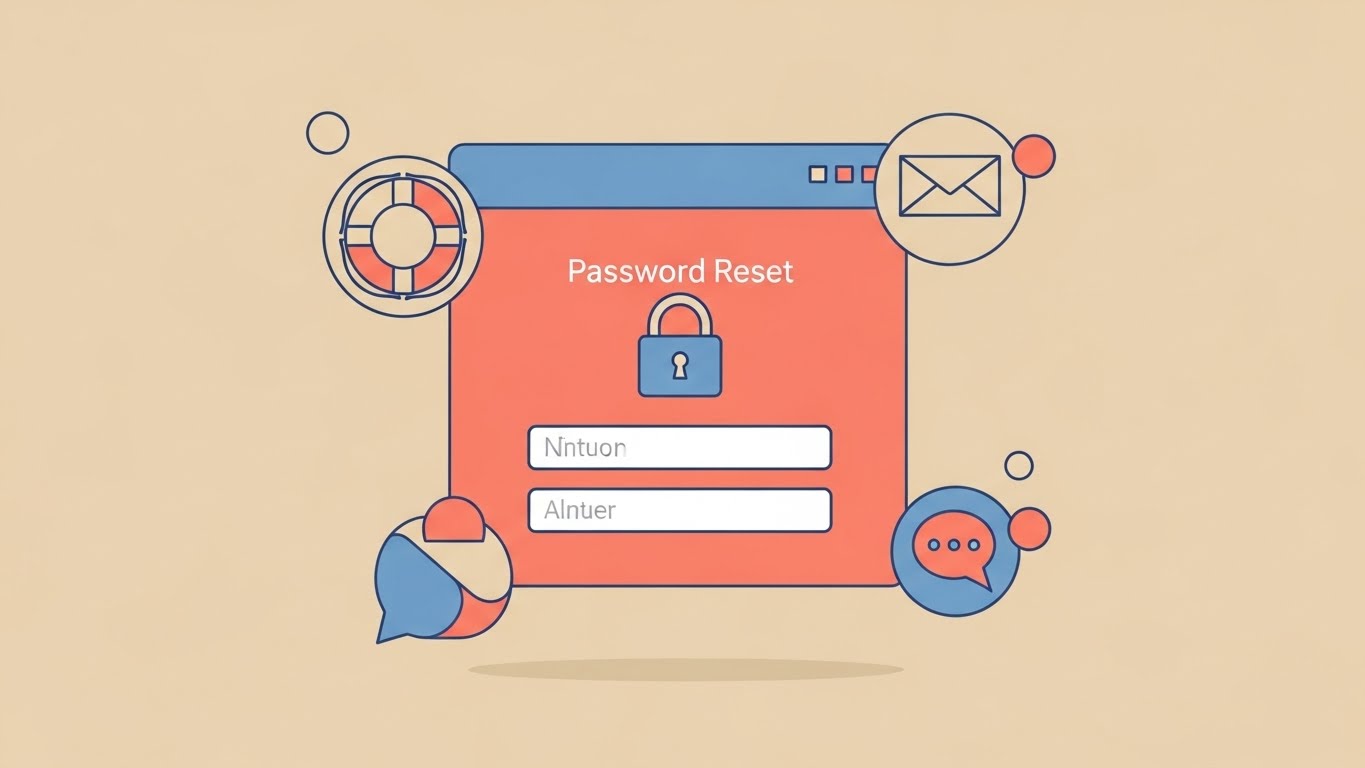
The Visual & Narrative Approach
When things go wrong, clarity is kindness. This style uses a reassuring, minimalist aesthetic. A central, simplified UI window in Soft Coral displays a "Password Reset" lock icon—a common pain point. Surrounding this are floating, helpful icons: a life ring, an envelope, and a chat bubble, all rendered in calming Steel Blue and Beige tones. The background is a solid, warm Beige, reducing eye strain and anxiety.
Psychological Impact & KPI Focus
This visual targets Support Ticket Deflection. When a user is frustrated (e.g., locked out), they don't want flash; they want a solution. The "Life Ring" iconography subliminally signals "Help is here." The clean, flat design removes visual noise, allowing the user to focus entirely on the solution path. It builds trust by showing that the support process is organized, calm, and accessible.
Strategic Implementation & Trade-offs
- Best Use Case: Help Center articles, "Reset Password" pages, or chatbot headers.
- Duration: Static or Micro-motion (3-5 Seconds).
- Trade-off: It is utilitarian. It is not "exciting" and should not be used in marketing materials where you need to generate hype.
Companies using similar video content -
SAP – Ariba Network – Providing clear support for procurement processes.
Oracle – Cloud SCM Support – Accessible help for supply chain cloud users.
26. Humanizing the Efficiency Metric
Retention | Reducing Churn
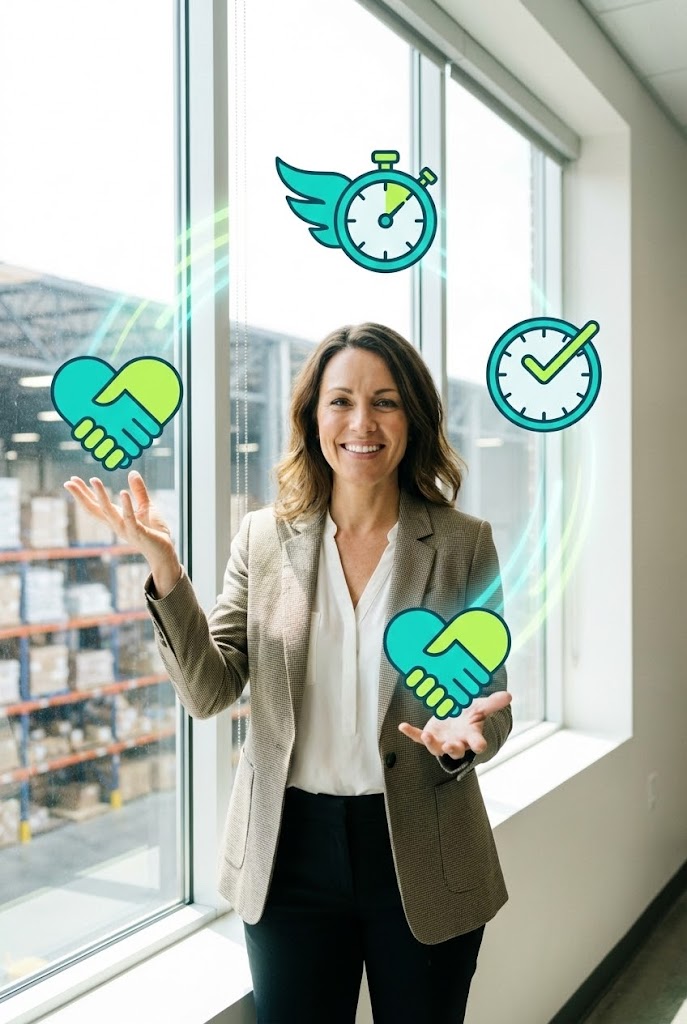
The Visual & Narrative Approach
This style blends the real with the symbolic to celebrate user success. A high-key photograph of a confident professional woman in a bright office serves as the anchor. Floating around her are animated 2D vector icons in Electric Teal and Lime Green: a "Handshake" (Partnership), a "Stopwatch" (Time Saved), and a "Checkmark" (Accuracy). The graphics interact playfully with the subject, glowing and bobbing to suggest that the software's benefits are part of her daily reality.
Psychological Impact & KPI Focus
This focuses on Customer Sentiment and Loyalty. It moves beyond "What the software does" to "How the software makes you feel." The "Heart" and "Handshake" icons visualize the Partnership aspect of the B2B relationship. It reaffirms to the client that they made the right choice, associating the software brand with professional confidence and ease. This is critical for preventing churn during renewal discussions.
Strategic Implementation & Trade-offs
- Best Use Case: Quarterly Business Review (QBR) presentations or "Year in Review" personalized videos.
- Duration: 15-20 Seconds.
- Trade-off: Requires high-quality, diverse stock photography. Poorly chosen stock photos can feel "canned" and insincere.
Companies using similar video content -
Kinaxis – RapidResponse – Celebrating team success through planning efficiency.
Blue Yonder – Luminate Platform – Showcasing human impact of optimized operations.
27. The Cyber-Physical Shield
Retention | Proactive Support/Announcements

The Visual & Narrative Approach
To remind the client of the sophisticated tech they are paying for, we use a "Dark Mode" aesthetic. A global map is rendered as a dark grid terrain, reminiscent of a command center at night. Major logistics hubs are glowing nodes of Cyan light. Neon Purple beams shoot upwards from these nodes, connecting in parabolic arcs to represent secure, encrypted data transmission. The aesthetic is "Cyberpunk Logistics"—high-tech, secure, and always active.
Psychological Impact & KPI Focus
This addresses Churn Reduction by reinforcing the "Cool Factor" and the perception of Advanced Security. It visualizes the software as a sophisticated "Shield" or "Brain" wrapping around the globe. For the IT Director, the "Dark Mode" look signals modern code and energy efficiency. It subtly implies that the system is monitoring the network 24/7, even while the user sleeps.
Strategic Implementation & Trade-offs
- Best Use Case: Product update emails announcing new security features or global expansions.
- Duration: 10-15 Seconds (Looping).
- Trade-off: It can look ominous if not balanced with bright accent colors. It leans heavily into the "tech" vibe, which may alienate non-technical users.
Companies using similar video content -
Overhaul – Supply Chain Integrity Platform – Protecting shipments with advanced security.
Interos – Resilience Platform – Visualizing global supply chain risk protection.
28. The Black Box Revealed
Expansion | Driving Deep Feature Adoption

The Visual & Narrative Approach
As you upsell "AI Features," you must visualize the invisible. This style uses an abstract 3D representation of a neural network. Glowing Magenta spheres (nodes) are connected by complex, white web-like filaments. They are arranged in the shape of a cube, symbolizing the "Package" or the "Container" being analyzed by intelligence. The background is a bright, white digital ether. The nodes pulse, visualizing the "thinking" process of the algorithm.
Psychological Impact & KPI Focus
This targets Feature Adoption (specifically AI/ML modules). Many buyers are skeptical of "AI Washing." This visual helps to "Demystify the Black Box." It shows that the AI has structure and logic (the cube shape) but is also complex and powerful (the neural web). It positions the new feature as a premium, cutting-edge add-on that brings a higher level of intelligence to the supply chain.
Strategic Implementation & Trade-offs
- Best Use Case: Landing pages for new "Premium Tier" AI modules (e.g., "Predictive Procurement").
- Duration: 15-20 Seconds (Looping).
- Trade-off: It is completely abstract. It requires strong copy to explain what the AI is actually doing (e.g., "Analyzing 50 variables per second").
Companies using similar video content -
SAS – Supply Chain Analytics – Demystifying AI-driven supply chain insights.
IBM Sterling Supply Chain – AI-powered Insights – Explaining complex AI logic for optimization.
29. The Executive Vision
Expansion | Driving Upsell/Cross-sell

The Visual & Narrative Approach
To sell to the C-Suite, mirror the C-Suite. Using high-end Generative AI video, we depict a C-level executive standing in a glass-walled office with a city skyline at dusk. He holds a tablet displaying a complex "Global Supply Chain" dashboard. The lighting is cinematic and natural. The executive's expression is one of "Insight" and "Control"—he isn't stressed; he is empowered. The tablet screen glows, illuminating his face with the data.
Psychological Impact & KPI Focus
This is purely about Upsell/Cross-sell. It sells the result of the Enterprise Plan: Executive Control. It appeals to the aspiration of the "Visionary Leader." By showing a peer (a well-dressed executive) getting value from the tablet, you validate the software as a strategic tool for the boardroom, not just a utility for the warehouse floor. It builds the case for Account Expansion to headquarters.
Strategic Implementation & Trade-offs
- Best Use Case: "Executive Summary" video reports or Account Based Marketing (ABM) campaigns targeting the C-Suite.
- Duration: 15-30 Seconds.
- Trade-off: Generative AI characters can hit the "Uncanny Valley." The facial animation must be flawless, or it risks looking cheap and eroding trust.
Companies using similar video content -
Kinaxis – RapidResponse – Providing C-suite with strategic supply chain oversight.
Oracle SCM Cloud – Executive Dashboards – Empowering leaders with high-level insights.
30. The Culture of Partnership
Expansion | Driving Referrals & Advocacy

The Visual & Narrative Approach
The final style celebrates the human outcome of technology. A high-quality stock montage captures a diverse team of professionals high-fiving in a modern, sun-lit office. In the background, a large monitor clearly displays your software's "Performance Dashboard" with a green upward trend line. The focus is on the people, but the cause of their joy is the data on the screen. The lighting is warm and natural.
Psychological Impact & KPI Focus
This targets Net Promoter Score (NPS) and Advocacy. It associates your software with "Team Success." It subliminally suggests that using your platform creates a happier, more collaborative workplace culture. This is the emotional hook needed to turn a customer into an advocate who will refer you to peers. It frames the software as a "Team Member" that helps everyone win.
Strategic Implementation & Trade-offs
- Best Use Case: Case Study videos, Testimonial headers, or "Thank You" pages after a renewal.
- Duration: Static or Slow Zoom.
- Trade-off: It is generic "Corporate Happiness." To be effective, the dashboard in the background must be clearly recognizable as your software, or it could be an ad for anything.
Strategic Knowledge Base: The Visual Operations Doctrine
The 30 styles outlined above are not merely artistic choices; they are functional components of a Visual Operating System for the modern supply chain. To extract the full ROI from these assets, organizations must integrate them into a cohesive strategy. This knowledge base synthesizes the visual examples into three actionable frameworks for Strategic Alignment, Operational Adoption, and Future-Proofing.
Strategic Alignment & Visual Architecture
"The Pre-Production Strategy"
- The Cognitive Load Audit: Before commissioning a video, audit the complexity of the task it replaces. If a driver manual is 50 pages, a Style 24 (Low Poly) video is essential. If it’s a 1-page memo, a Style 1 (Minimalist) image suffices. Match visual density to information density.
- Role-Based Visual Mapping: Do not use the same style for everyone. Use High-Contrast/Large Text (Style 4) for drivers on mobile devices to ensure "Glanceability." Use Data-Dense Dashboards (Style 10) for desktop-based planners who need granularity.
- The "Glanceability" Standard: In logistics, seconds matter. Establish a standard where the core message of any TOFU/MOFU asset must be understood in <3 seconds (the speed of a scroll). Styles 6 (Line Art) and 13 (Gold Coins) excel here.
- Brand Voice Consistency: Ensure that your "Dark Mode" marketing videos (Style 27) don't clash with a "Light Mode" product interface (Style 23). Visual disconnects create trust gaps. Your marketing aesthetics should evolve from your UI, not compete with it.
- The Advids Strategic Audit: Partner with experts like Advids before production to define a "Visual Vocabulary" that scales. A disjointed library of mixed styles (cartoons next to hyper-realism) signals a fragmented product strategy.
- Standardization vs. Customization: Use standardized, abstract styles (Style 28) for global features to save localization costs. Use bespoke, photographic styles (Style 15) for region-specific case studies where local scenery builds trust.
- The Cross-Departmental Bridge: Use Style 5 (Mixed Media) to unify terminology. When Sales says "Optimization" and Ops says "Route Planning," a single video showing the transition from blueprint to road aligns the definitions visually.
- Legacy System Integration: Visualizing the invisible link between old hardware and new software is critical. Use Style 2 (Fluid Streams) to metaphorically show how your modern SaaS "ingests" data from legacy ERPs, reducing fear of incompatibility.
- Accessibility in Trucking: The logistics workforce is multilingual. Prioritize styles like Style 24 (Gamified 3D) that rely on universal symbols (arrows, pins, checks) rather than heavy text or voiceover, ensuring global comprehension.
- The Mobile-First Mandate: 70% of supply chain execution happens on mobile. All 30 styles must be legible on a 5-inch screen. Avoid Style 18 (Complex Parallax) for driver-facing content; reserve it for the C-Suite desktop experience.
Operational Adoption & Implementation
"The Deployment Phase"
- Overcoming "Big Brother" Anxiety: Drivers often fear tracking software. Use empathy-driven styles like Style 26 (Human Success) to frame tracking features as "Safety" and "Protection" rather than "Monitoring." Visuals can reframe "Surveillance" as "Protection."
- The Micro-Learning Shift: Kill the PDF manual. Break training into 30-second clips using Style 23 (Clean UI). A library of 50 short videos is more searchable and consumable than one 20-minute webinar.
- Just-in-Time Support: Embed specific visual loops (like Style 25) directly into the helpdesk or the cab tablet. When a driver clicks "Error," show them the 10-second animation on how to fix it immediately.
- Gamification of Training: Use Style 24 (Low Poly) to visualize driver scorecards. Show a "Level Up" animation when they complete their safety training. Visual rewards trigger dopamine and increase training compliance.
- Reducing Support Ticket Volume: There is a direct correlation between the quality of your visual guide (e.g., Style 2) and the number of "How do I...?" tickets. Invest in "Pre-emptive Visualization"—videos that answer questions before they are asked.
- Remote Onboarding: You cannot fly a trainer to every depot. Use Style 7 (Isometric 3D) to create a "Virtual Walkthrough" of the installation process. This allows you to scale onboarding globally without scaling headcount.
- Standard Operating Procedures (SOPs): Text-based SOPs are rarely read. Transform them into visual process flows using Style 6 (Line Art). A continuous line animation showing the flow of a package is infinitely more memorable than a numbered list.
- Feedback Loops: Use interactive video elements. At the end of a Style 22 onboarding video, ask "Did this help?" The data you gather here is invaluable for refining your product and your content.
- Scalable Localization: When you use abstract styles like Style 8 (Abstract Motion) or Style 2 (Line Art), you minimize the need for text translation. Visual language is global; use it to scale across regions without massive localization costs.
- Leadership Communication: Don't send a spreadsheet to the VP of Supply Chain. Send a Style 29 (Executive View) video summary. Visualizing their fleet's performance in a cinematic format validates their decision to buy your software.
Measuring Impact & Future-Proofing
"The ROI Phase"
- Beyond "Views": Do not measure success by "Views." Measure it by Time-to-Competency. Did the group that watched the Style 24 video master the app faster than the group that read the PDF? That delta is your ROI.
- The "Idle Time" Metric: Correlate better visualization in the UI (e.g., Style 23) with reduced "Idle Time" inside the software. If users are navigating faster, they are working more efficiently.
- Compliance Velocity: How fast can you get 100% of your fleet to understand a new regulation (like ELD)? A viral, shareable video using Style 3 (Kinetic Typo) can achieve compliance in days, whereas email memos take weeks.
- Retention and Churn: High-quality UX visualization directly impacts Customer Lifetime Value (LTV). If the software feels premium (thanks to Style 27 and Style 10), the client is less likely to churn for a cheaper, uglier competitor.
- The AI Visual Frontier: Prepare for Generative Video. Soon, you will be able to generate Style 12 (Photorealistic) videos on the fly for specific client shipments. Start building your asset library now so you are ready to train these models.
- Scalability of Assets: Build a "Visual Legos" system. If you create a 3D truck for Style 15, ensure it is rigged and ready to be used in Style 7 and Style 24. Reuse assets to lower the cost-per-video over time.
- The Advids Partnership: Scalability requires a partner who understands the long game. Advids doesn't just make one-off videos; we help you manage and evolve this asset library, ensuring that as your software updates, your visuals update with it, keeping your documentation "Evergreen."
- Benchmarking Success: Compare your visuals to the B2C apps your drivers use (TikTok, Instagram). That is your competition for attention. If your B2B training looks like 1990s corporate stock, you will lose the engagement war.
- The ROI of Safety: Quantify the unquantifiable. If a safety video using Style 14 (Risk Intelligence) prevents just one accident by clearly visualizing a blind spot, the ROI of that video is effectively infinite.
- Final Call to Innovation: Treat video as Infrastructure. It is as important as your servers or your code. In a world of complex supply chains, the company that explains the world the clearest, wins. Be the signal in the noise.
Companies using similar video content -
SAP – Digital Supply Chain – Fostering collaboration and shared success.
E2open – Partner Ecosystem – Building advocacy through integrated solutions.
Author & Editor Bio


