
Introduction: Visualizing the Pulse of Precision
In the exacting world of industrial metrology, "accuracy" is the baseline, but "trust" is the currency. For Lab Managers and Quality Directors, the daily operational reality is a high-stakes balancing act between physical precision and digital compliance. The industry is currently undergoing a massive transformation, with the global calibration services market size valued at $19.8 billion in 2024. This growth is driven by a singular urgent need: to close the gap between the instrument on the bench and the certificate in the cloud.
However, the cost of failing to bridge this physical/digital divide is staggering. Unplanned downtime costs industrial manufacturers an estimated $50 billion annually—a figure often traceable to equipment drift, missed calibration intervals, or "silent failures" in the traceability chain.
For a SaaS platform in this space, the marketing challenge is unique. You are not just selling features; you are visualizing peace of mind. Your video content must dismantle the skepticism of a risk-averse audience by proving—visually—that your digital solution is as robust as their physical hardware. This guide provides a strategic visual vocabulary to do just that. By leveraging these distinct styles, we transform abstract concepts like "traceability" and "uncertainty" into tangible, compelling visual narratives that drive adoption and build unshakeable trust.
1. Minimalist Flat 2D Vector
TOFU | Brand Awareness

(Minimalist Flat Vector): Geometric Shield Ensuring Compliance
The Visual & Narrative Approach
Scenario: A 2D vector illustration in a minimalist, flat aesthetic. The background is a solid, soothing slate blue. Central to the composition is a stylized icon of a "shield" formed by geometric shapes in vivid coral and soft white. Inside the shield, abstract representations of measurement tools—a ruler and a dial—are interlocking. The lighting is even and shadowless.
Narration: "In a world of variables, we are your constant. The shield that protects your traceability, simplified."
Psychological Impact & KPI Focus
- Niche Psychology: The target persona lives in fear of the "Audit Trap." By using the semiotic of a shield, we instantly lower Cognitive Load and trigger a feeling of safety. It creates a visual anchor that says, "You are covered."
- Operational Impact: This style simplifies the complex reality of a lab into a single, manageable icon. It addresses the KPI of Brand Trust, positioning the platform as a guardian of compliance rather than just a tool.
Strategic Implementation & Trade-offs
- Best Use Case: LinkedIn feed ads (15 seconds) designed to stop the scroll.
- Trade-off: It is highly abstract. It builds emotional reassurance but fails to demonstrate technical capability. It opens the door but doesn't close the deal.
Companies using similar video content -
Beamex – CMX – Digital calibration management solution.
SafetyCulture – Mobile-first inspection and calibration.
GageList – Online calibration management system.
2. 2D Line Art Animation
TOFU | Category Creation

(2D Line Art): Continuous Flow Digitizing Assets
The Visual & Narrative Approach
Scenario: A 2D line art animation still featuring elegant, continuous thin lines in electric cyan and lime green against a pure white background. The lines flow from left to right, forming the outline of a laboratory bench with abstract instruments like microscopes, seamlessly morphing into a digital cloud icon. The aesthetic is clinical and precise.
Narration: "From the bench to the cloud, the line is unbroken. Physical precision, meet digital perfection."
Psychological Impact & KPI Focus
- Niche Psychology: Metrologists value Continuity. The unbroken line subconsciously validates the concept of "End-to-End Traceability." It assures the viewer that data is never lost or corrupted as it moves from the physical to the digital realm.
- Operational Impact: It visually solves the "Silo Problem." It proves that the platform connects disconnected islands of equipment into a single, unified stream.
Strategic Implementation & Trade-offs
- Best Use Case: YouTube pre-roll ads or "Our Story" videos (30 seconds).
- Trade-off: The clinical aesthetic can feel cold. It appeals to the logical brain but may lack the emotional warmth needed to build a deeper connection.
Companies using similar video content -
MasterControl – Asset Excellence – End-to-end asset and calibration management.
Labsols – CALIBRATION LIMS – LIMS for calibration labs.
IndySoft – Comprehensive asset and calibration software.
7. Abstract 2D Flat Vector Organic
TOFU | Pre-Roll Ad

(Abstract Organic): Fluid Dynamics Smoothing Workflows
The Visual & Narrative Approach
Scenario: Abstract 2D flat vector organic modern motion graphics with glossy textures. Liquid-like shapes in a gradient of teal and silver flow across a screen, representing fluid data management. The shapes merge and split rhythmically against a clean white background. The visual suggests the smoothing out of calibration data anomalies.
Narration: "Data shouldn't be a bottleneck. It should be a stream. Harmonize your lab's workflow with intelligent data ingestion."
Psychological Impact & KPI Focus
- Niche Psychology: Lab Managers are often overwhelmed by "Data Friction"—the struggle to format and organize records. This "Organic Flow" creates a sense of Ease and Release. It promises that the software will handle the complexity.
- Operational Impact: It addresses the challenge of Data Integrity, showing that the system actively manages and polishes the data, rather than just storing it.
Strategic Implementation & Trade-offs
- Best Use Case: Website backgrounds and section headers (Looping).
- Trade-off: It is purely metaphorical. It requires clear text overlays to explain that the "liquid" represents data.
Companies using similar video content -
SIMCO – CERDAAC – Cloud quality management for regulated industries.
AmpleLogic – Asset Management Software (AMS) – Enterprise asset management.
Optimiso Group – Optimiso Suite – ISO 17025 QMS software.
1. Abstract 3D AI Visualization
TOFU | Brand Awareness

(Abstract 3D AI): Networked Nodes Connecting IIoT
The Visual & Narrative Approach
Scenario: An abstract 3D AI visualization featuring a network of glowing silver nodes connected by fine pale blue lines against a bright white void. The nodes cluster to form the silhouette of a microscope. The visualization represents the connectivity of the Industrial Internet of Things (IIoT) within a clean, sterile calibration ecosystem.
Narration: "Every instrument is a node. Every measurement is a signal. Connect your lab to the future of IIoT."
Psychological Impact & KPI Focus
- Niche Psychology: For the CTO or Innovation Director, this triggers the Future-Ready ambition. It signals that the platform is not just a logbook, but a sophisticated piece of Industry 4.0 infrastructure.
- Operational Impact: It visualizes Scalability. The "node" structure implies that the system can expand indefinitely, connecting thousands of assets without breaking.
Strategic Implementation & Trade-offs
- Best Use Case: Account-Based Marketing (ABM) campaigns targeting Enterprise clients (20 seconds).
- Trade-off: High production complexity. It positions the brand as "Premium/High-Tech," which is great for enterprise sales but might alienate smaller labs looking for a simple tool.
Companies using similar video content -
KloudGin – Field Service and Asset Management – FSM & EAM with calibration.
MaintWiz – CMMS for instrument calibration.
PTC – ThingWorx – IIoT platform for industrial data.
2. Photorealistic 3D Renders
TOFU | Category Creation

(Photorealistic 3D): Macro Lens Revealing Precision
The Visual & Narrative Approach
Scenario: A photorealistic 3D render of a high-end digital multimeter. The camera is in a macro position, focusing on the LCD screen which glows with a vivid "LCD Green" digital readout of "100.00%". The casing is matte black with yellow grips. The background is an infinite studio white, emphasizing the product's hardware quality.
Narration: "Precision you can touch. Accuracy you can trust. We manage the hardware that drives your business."
Psychological Impact & KPI Focus
- Niche Psychology: Metrologists have a deep respect for their tools. By rendering the hardware with such care, you establish Domain Authority. You prove that you understand the physical reality of their work.
- Operational Impact: It bridges the Physical/Digital Divide. It creates a subconscious link that "Using this software = Perfect Hardware Health."
Strategic Implementation & Trade-offs
- Best Use Case: Product pages and "Supported Devices" feature videos (30 seconds).
- Trade-off: Expensive. It requires high-quality 3D assets. Use sparingly for "Hero" moments.
Companies using similar video content -
Fluke Calibration – MET/CAL – Automated calibration software.
Mitutoyo – MCOSMOS – Integrated metrology software suite.
Zeiss – Calypso – Advanced metrology & inspection software.
10. Lifestyle Stock with UI Overlay
MOFU | Feature

(Lifestyle UI): Field Scanning Verifying Instantly
The Visual & Narrative Approach
Scenario: A professional female technician with tied-back hair, wearing a white lab coat, holding a smartphone. She is focused on scanning a QR code tag attached to a metallic pressure gauge in an industrial setting. Overlaid in the air near the phone is a sleek, semi-transparent white UI card displaying "Verified," symbolizing instant identification.
Narration: "Identify. Scan. Verify. The power of the lab, now in the palm of your hand."
Psychological Impact & KPI Focus
- Niche Psychology: It addresses the fear of Process Friction. It demonstrates that compliance doesn't require running back to a desktop; it happens at the point of work. It validates the modern technician's desire for mobile tools.
- Operational Impact: It visualizes Efficiency. The instant "Verified" feedback loop demonstrates a reduction in cycle time and elimination of manual data entry errors.
Strategic Implementation & Trade-offs
- Best Use Case: Social media shorts (Reels/Stories) and "Day in the Life" demos (45 seconds).
- Trade-off: Requires high-quality stock footage. If the stock looks "staged" or the UI tracking is poor, it ruins the credibility.
Companies using similar video content -
SafetyCulture – Mobile-first inspection and calibration.
Beamex – bMobile – Mobile calibration application.
GageList – Online calibration management system.
9. Rapid UI Feature Montage
MOFU | Feature

(Rapid UI Montage): Document Flow Automating Audits
The Visual & Narrative Approach
Scenario: A dynamic composition suggesting a rapid montage. Multiple floating semi-transparent document sheets with abstract "certificate" layouts fly towards the center. The sheets are glowing white with emerald green "seal" accents. The background is a motion-blurred gradient of silver and tech-blue.
Narration: "From one to one million. Automate your compliance certificates at the speed of business."
Psychological Impact & KPI Focus
- Niche Psychology: It targets Audit Anxiety. The sheer volume of flying certificates reassures the user that the system can handle their backlog without breaking a sweat. It turns the "mountain of paperwork" into a "stream of success."
- Operational Impact: Visualizes Batch Processing. It shows that the platform is built for enterprise scale, capable of generating thousands of compliant reports in seconds.
Strategic Implementation & Trade-offs
- Best Use Case: Retargeting ads focused on ROI and time-savings (15 seconds).
- Trade-off: It is intense. Use it to create excitement about speed, but slow down when you need to explain accuracy.
Companies using similar video content -
PrimeTechnology – ProCalV5 – Enterprise calibration management.
Qualityze – Calibration Management – Cloud-based compliance & calibration.
QT9 Software – QT9 QMS – ISO 17025 quality management system.
11. Wireframe to Reality Transition
MOFU | Competitive Displacement
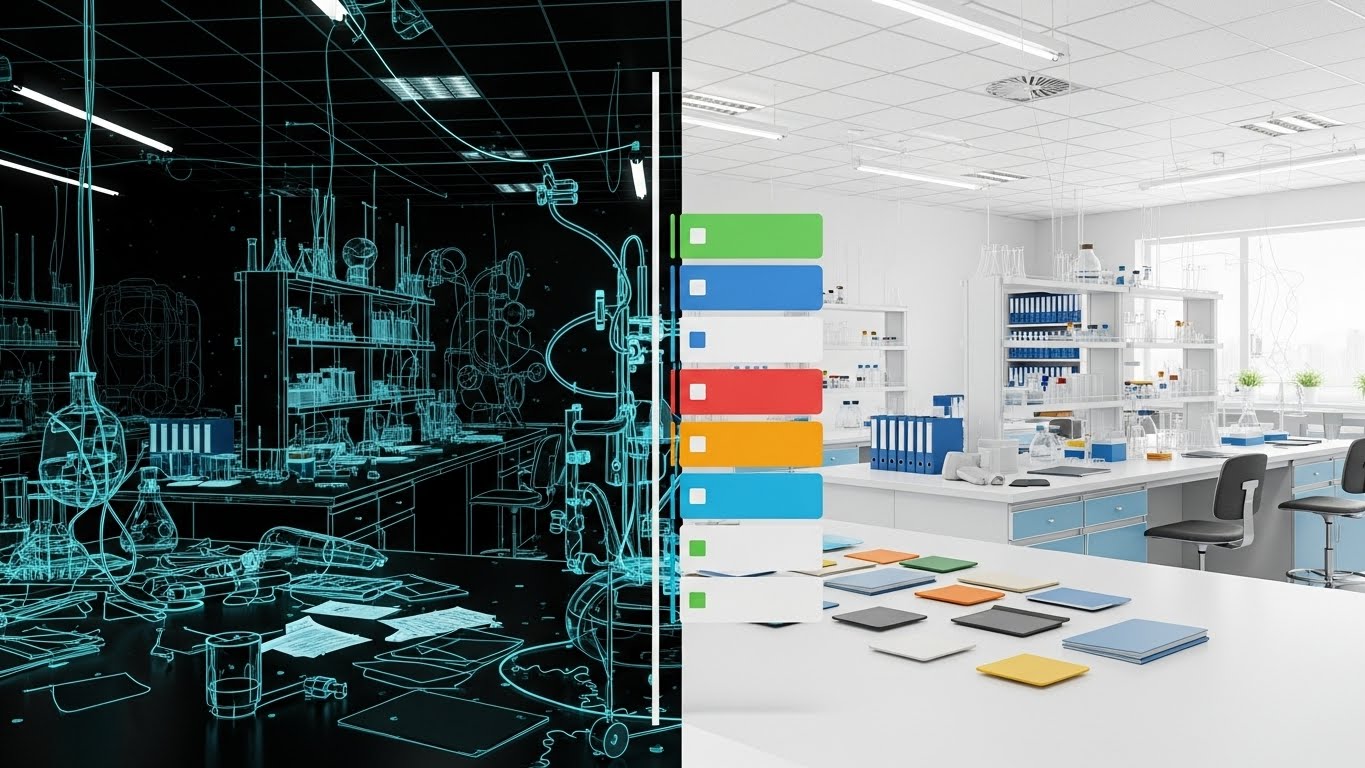
(Wireframe to Reality): Blueprint Transitioning to Order
The Visual & Narrative Approach
Scenario: A split-screen composition separated by a sliding vertical bar. The left side depicts a "Wireframe" view of a laboratory—a chaotic blue-and-white blueprint of unorganized equipment. As the slider moves right, it reveals the "Reality": a pristine, photorealistic, and highly organized workspace. The visual metaphor represents the bridge between intention and execution.
Narration: "Stop planning for efficiency. Start living it. We turn your theoretical workflows into operational reality."
Psychological Impact & KPI Focus
- Niche Psychology: Many Lab Managers are stuck in "Planning Paralysis," constantly designing workflows that never get implemented due to legacy constraints. This visual triggers a feeling of Actualization. It shows that the software doesn't just map the process; it enforces the ideal state.
- Operational Impact: Visualizes Implementation Speed. It suggests that the gap between "designing a process" and "running a process" is instantaneous with your platform, reducing the fear of a long deployment.
Strategic Implementation & Trade-offs
- Best Use Case: LinkedIn conversion ads targeting users who have engaged with previous content (15 seconds).
- Trade-off: Requires excellent motion design to make the transition feel smooth, not jarring. If the "before" state looks too abstract, the specific pain of the current chaos may be lost.
Companies using similar video content -
MasterControl – Asset Excellence – CMMS & calibration management.
PEMAC – ASSETS – Modular CMMS for calibration.
Ideagen – Quality Management – ISO 17025 compliance software.
12. Clean UI Workflow (Light Mode)
MOFU | Demo Requests
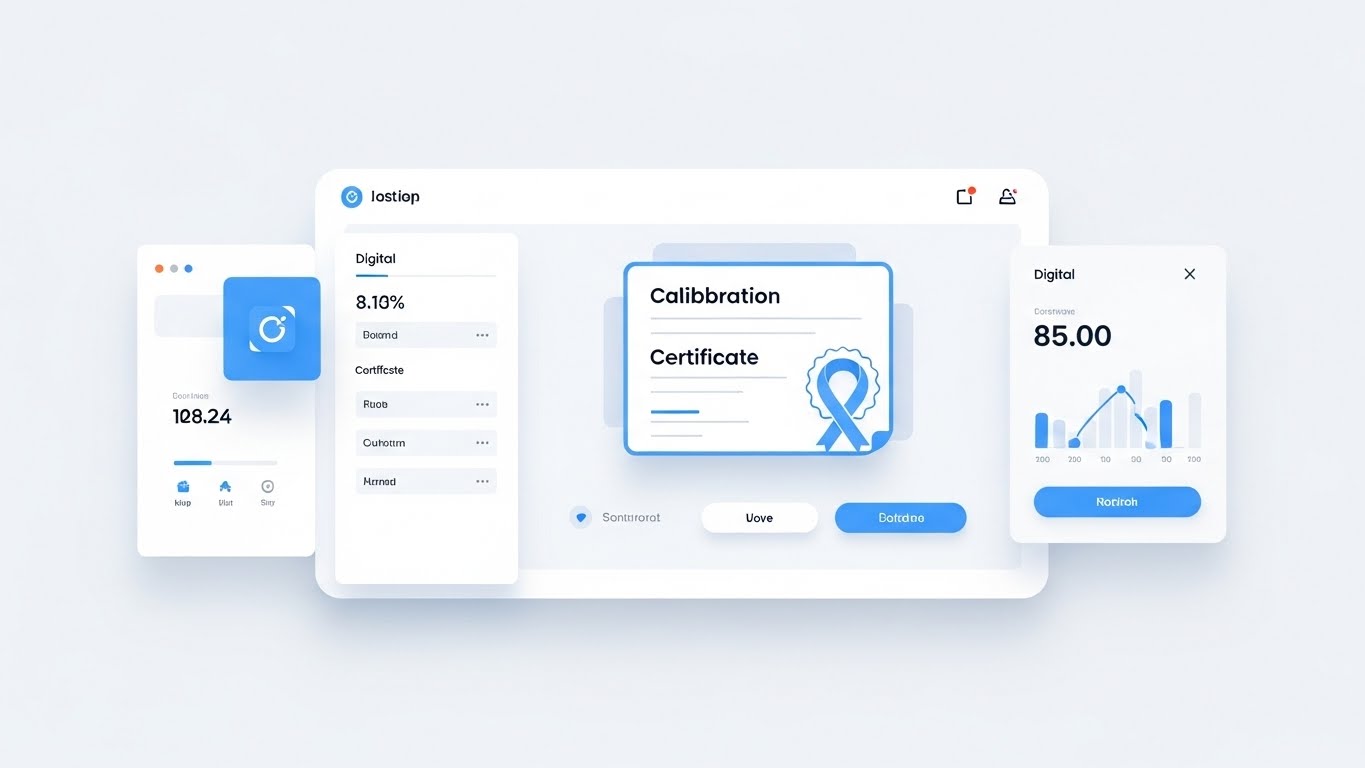
(Clean UI Light): Pristine Interface Certifying Quality
The Visual & Narrative Approach
Scenario: A static, high-fidelity UI mockup of the platform’s dashboard in "Light Mode." The aesthetic is airy, using sky blue and pure white. A stylized digital calibration certificate with a prominent ribbon icon is the focal point, floating slightly above the background with subtle drop shadows.
Narration: "Clarity is compliance. Experience an interface designed for the eyes of the auditor and the ease of the operator."
Psychological Impact & KPI Focus
- Niche Psychology: Metrology data is dense and often visually overwhelming. A clean, beautiful UI signals Cognitive Fluency. It reassures the user that the software is modern and user-friendly, reducing the fear of a steep learning curve for their technicians.
- Operational Impact: Visualizes Usability. It directly addresses the "User Adoption" KPI, proving that technicians won't need weeks of training to generate a simple, compliant certificate.
Strategic Implementation & Trade-offs
- Best Use Case: The "Features" page of your website or as the hero image on a "Request Demo" landing page.
- Trade-off: It shows the "ideal" state. Ensure your actual UI is polished enough to match this marketing asset, or you risk a "bait and switch" perception during the demo.
Companies using similar video content -
Ape Software – Calibration Control – Customizable calibration management.
EasyCal – Automated calibration management solution.
QMSys – Calibration Management – Simplified calibration process software.
13. Split Screen: Optimized Reality
MOFU | Competitive Comparison
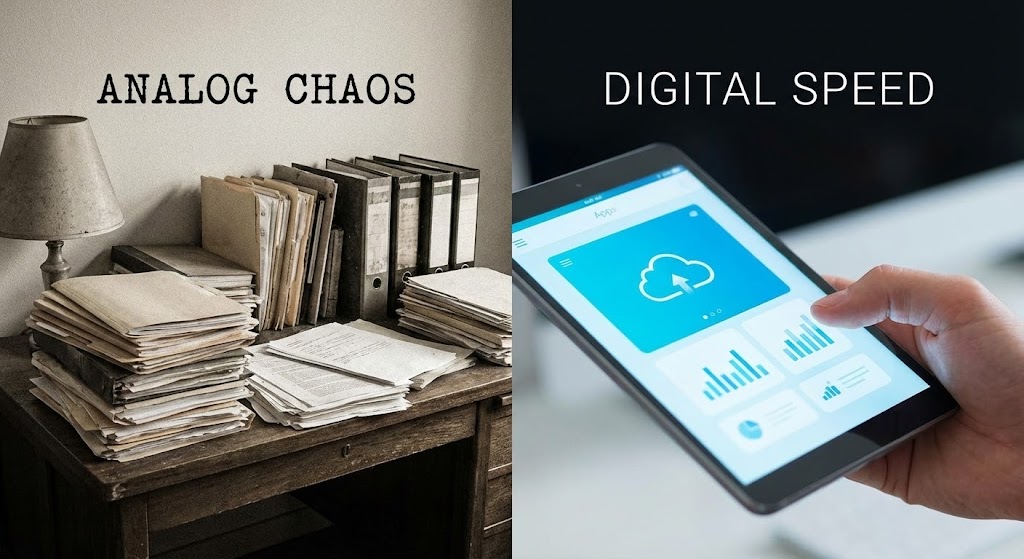
(Split Screen): Analog Chaos vs Digital Speed
The Visual & Narrative Approach
Scenario: A stark split-screen comparison. The left side ("Analog Chaos") is a desaturated, gritty photo of a desk overwhelmed by paper files and binders. The right side ("Digital Speed") is a vibrant, high-contrast image of a hand holding a tablet displaying a sleek cloud interface.
Narration: "Buried in paper or powered by the cloud? The choice is binary. Leave the legacy behind."
Psychological Impact & KPI Focus
- Niche Psychology: This exploits the Pain of Disorganization. Every Quality Director hates the "paper chase" during an audit. This visual juxtaposes that pain with the pleasure of instant digital access.
- Operational Impact: Visualizes Digitization. It creates a clear "Before/After" scenario that demonstrates the elimination of physical storage costs and retrieval latency.
Strategic Implementation & Trade-offs
- Best Use Case: Competitor displacement campaigns (e.g., "Still using Excel?") on social feeds.
- Trade-off: It is highly effective but can be a cliché. To work, the "Chaos" side must look genuinely stressful, and the "Speed" side must look effortlessly superior.
Companies using similar video content -
PrimeTechnology – ProCalV5 – Enterprise calibration management.
GageList – Online calibration management system.
xTrak – Cloud-based calibration tracking.
14. 3D X-Ray Visualization
BOFU | Building Trust

(3D X-Ray): Internal Mechanics Revealing Health
The Visual & Narrative Approach
Scenario: A high-end 3D visualization of an industrial pressure gauge. The outer casing is rendered in translucent glass/blue, revealing the complex internal brass gears and springs, which are glowing gold. The visual metaphor suggests seeing "inside" the asset.
Narration: "Don't just calibrate. Understand. See deep inside your asset health with predictive analytics."
Psychological Impact & KPI Focus
- Niche Psychology: This speaks to the Curiosity and Rigor of the engineer. It promises that the software provides depth, not just superficial data. It validates the user's need to understand why an instrument is drifting.
- Operational Impact: Visualizes Predictive Maintenance. It implies that the software analyzes the internal mechanics (via data trends) to predict failure before it happens, reducing downtime.
Strategic Implementation & Trade-offs
- Best Use Case: "Technology" or "Analytics" deep-dive pages.
- Trade-off: Highly abstract. You must explicitly link this visual to your "Drift Analysis" or "Asset Health" features via copy, otherwise, it serves only as aesthetic decoration.
Companies using similar video content -
Hexagon – PC-DMIS – 3D metrology & inspection software.
New River Kinematics – SpatialAnalyzer – Portable 3D metrology software.
InnovMetric – PolyWorks – Universal 3D metrology software.
15. Dynamic Data Visualization
BOFU | ROI Justification

(Dynamic Data): Piston Charts Driving Growth
The Visual & Narrative Approach
Scenario: A 3D animated chart where the bars look like metallic engine pistons. They rise rhythmically from a metallic floor, textured in gold, silver, and bronze. As they reach their peak, they emit a soft glow, symbolizing power and output.
Narration: "Calibration isn't a cost center. It's an engine. Drive ROI with data that optimizes your entire production line."
Psychological Impact & KPI Focus
- Niche Psychology: The CFO often views calibration as a necessary evil (cost). This style reframes it as a Performance Driver. The "engine" metaphor speaks the language of manufacturing and production.
- Operational Impact: Visualizes ROI and Efficiency. It links technical compliance directly to financial growth, helping the internal champion sell the software to their finance team.
Strategic Implementation & Trade-offs
- Best Use Case: Investor decks or Executive Summary slides in a sales proposal.
- Trade-off: If the data points aren't labeled clearly (e.g., "Uptime," "Savings"), it becomes generic stock art. Context is king here.
Companies using similar video content -
Labsols – BI – Data intelligence for calibration labs.
CompuCal – Calibration management software.
Honeywell – Traceable Calibration Management – Industrial calibration solutions.
16. 2D Character-Driven Story
BOFU | Overcoming Objections

(2D Character): Effortless Lift Managing Complexity
The Visual & Narrative Approach
Scenario: A friendly, stylized 2D vector character of a technician in an orange jumpsuit. He is smiling and holding up a massive, heavy-looking server block labeled "DATA" with a single hand, while giving a thumbs up. The background is a soft, cloud-filled gradient.
Narration: "Heavy data? Light workload. We shoulder the IT burden so you can focus on the measurements."
Psychological Impact & KPI Focus
- Niche Psychology: Addresses the fear of Workload Overwhelm. Implementing a new system often feels like "more work." This character makes the process look friendly, manageable, and even fun.
- Operational Impact: Visualizes Cloud Management. It reassures the user that the vendor handles the heavy lifting (server maintenance, updates, security), not the lab's IT team.
Strategic Implementation & Trade-offs
- Best Use Case: Email nurture sequences addressing implementation fears or "Onboarding" guides.
- Trade-off: Can appear "childish" if not executed with a professional color palette. Avoid cartoony styles; keep it corporate-friendly.
Companies using similar video content -
1LIMS – Cloud LIMS for lab operations.
Zendo Lims – Laboratory quality management system.
Labsols – CALIBRATION LIMS – LIMS for calibration labs.
17. Dark Mode UI Showcase
BOFU | Risk Mitigation

(Dark Mode UI): Encrypted Interface Signaling Security
The Visual & Narrative Approach
Scenario: A sleek, angled perspective of the UI in "Dark Mode." The background is matte charcoal. The screen displays a Security Audit Log with glowing amber "Alert" icons and silver "Encrypted" badges. The lighting is low-key and dramatic.
Narration: "Your data is your IP. Protect it with bank-grade encryption and unalterable audit trails."
Psychological Impact & KPI Focus
- Niche Psychology: For the IT Director/CTO, "Dark Mode" often signifies Developer-Grade Tools and seriousness. It visually communicates robustness and cyber-security.
- Operational Impact: Visualizes Data Integrity & Security. It directly addresses the risk of data tampering or loss, a critical concern in regulated industries (FDA, aerospace).
Strategic Implementation & Trade-offs
- Best Use Case: The "Security" or "Compliance" section of the website.
- Trade-off: Dark mode can sometimes feel "hostile" or technical. Use it specifically to sell security features, not general ease-of-use.
Companies using similar video content -
MasterControl – Asset Excellence – CMMS & calibration management.
Qualtrax – Compliance & ISO 17025 adherence software.
Ideagen – Quality Management – ISO 17025 compliance software.
18. 2D Graphics Over Live Action
BOFU | Sales Acceleration

(2D over Live Action): Augmented Technician Walking Efficiently
The Visual & Narrative Approach
Scenario: A high-quality photo of a confident lab manager walking through a modern, sunlit aisle. Tracked into the 3D space around him are floating 2D white vector icons: a speedometer ("Speed"), a cloud upload symbol ("Cloud"), and a signal icon ("WiFi").
Narration: "The connected worker is the productive worker. Augment your team with tools that move as fast as they do."
Psychological Impact & KPI Focus
- Niche Psychology: This taps into the desire for Modernization. It shows the human element enhanced by technology, not replaced by it. It validates the technician's role as a skilled knowledge worker.
- Operational Impact: Visualizes Mobility and Connectivity. It demonstrates that the platform works "on the go," freeing the staff from being tethered to a desktop.
Strategic Implementation & Trade-offs
- Best Use Case: LinkedIn ads or "Day in the Life" case studies.
- Trade-off: Reliance on stock footage. The "lab" must look realistic (not a movie set) for the audience to relate.
Companies using similar video content -
Beamex – bMobile – Mobile calibration application.
KloudGin – Field Service and Asset Management – FSM & EAM with calibration.
SafetyCulture – Mobile-first inspection and calibration.
19. Aspirational Stock Montage
BOFU | Economic Buyer

(Aspirational Stock): Executive Team Envisioning Success
The Visual & Narrative Approach
Scenario: A bright, optimistic shot of a diverse group of executives standing in a modern office. They are looking at a large wall-mounted screen displaying an upward-trending growth chart, pointing and smiling. A subtle lens flare adds to the positive atmosphere.
Narration: "See the big picture. When your calibration is under control, your business is clear for takeoff."
Psychological Impact & KPI Focus
- Niche Psychology: This targets the Economic Buyer (VP of Ops, CEO) who cares about team alignment and success. It sells the feeling of a problem solved. It moves the conversation from "tools" to "outcomes."
- Operational Impact: Visualizes Strategic Alignment. It implies that the software provides the high-level insights needed for executive decision-making.
Strategic Implementation & Trade-offs
- Best Use Case: Closing emails or "Success Story" thumbnails.
- Trade-off: It is the most generic style. It must be paired with hard data (e.g., "Saved Client X $2M") to have credibility.
Companies using similar video content -
SIMCO – CERDAAC – Cloud quality management for regulated industries.
MasterControl – Asset Excellence – CMMS & calibration management.
Qualityze – Calibration Management – Cloud-based compliance & calibration.
20. Isometric 3D Workflow
BOFU | Functional Buyer

(Isometric 3D): Miniature Ecosystem Synchronizing Logistics
The Visual & Narrative Approach
Scenario: An isometric "tilt-shift" miniature scene on a white background. It shows the full ecosystem: a tiny truck (logistics) delivering a yellow box to a calibration bench (lab), which connects to a server rack (data). Assets are color-coded in primary red, blue, and yellow.
Narration: "From the dock to the bench to the cloud. One ecosystem, perfectly synchronized."
Psychological Impact & KPI Focus
- Niche Psychology: The Functional Buyer (Lab Manager) worries about Process Gaps—where things get lost between departments. This "God's Eye View" gives them a sense of total control and visibility over the entire chain.
- Operational Impact: Visualizes End-to-End Traceability. It simplifies the complex logistics of sending equipment out for calibration and receiving it back, showing it as a unified loop.
Strategic Implementation & Trade-offs
- Best Use Case: Whitepaper diagrams or complex process explainer videos.
- Trade-off: Can feel "toy-like." Ensure the narration emphasizes that this simple view represents a robust, enterprise-grade process.
Companies using similar video content -
Labsols – CALIBRATION LIMS – LIMS for calibration labs.
PEMAC – ASSETS – Modular CMMS for calibration.
MaintWiz – CMMS for instrument calibration.
21. Futuristic Neon/Dark Mode
BOFU | Technical Buyer

(Futuristic Dark Mode): Glowing Padlock Securing Sovereignty
The Visual & Narrative Approach
Scenario: A futuristic dark mode scene inside a server room. Rows of server racks are lit by dim ambient lighting. In the center, a glowing, holographic padlock icon constructed of neon cyan light beams hovers protectively over a server unit. The aesthetic emphasizes robust security and modern architecture.
Narration: "Compliance is fragile. Security is not. We wrap your proprietary calibration data in layers of bank-grade encryption."
Psychological Impact & KPI Focus
- Niche Psychology: The Technical Buyer (CTO/IT Director) operates with a "Zero Trust" mindset. "Dark Mode" combined with neon cyan signals Modern Cybersecurity, visually distinguishing the platform from vulnerable legacy on-premise software.
- Operational Impact: Visualizes Data Sovereignty. It addresses the critical KPI of "Security Compliance" (SOC 2, ISO 27001), reassuring the buyer that cloud migration does not equal risk.
Strategic Implementation & Trade-offs
- Best Use Case: The "Security" or "Trust Center" page of your website.
- Trade-off: The "Cyberpunk" aesthetic can feel too aggressive for conservative industries like Pharma. Ensure the accompanying copy remains grounded in professional standards.
Companies using similar video content -
Qualtrax – Compliance & ISO 17025 adherence software.
Ideagen – Quality Management – ISO 17025 compliance software.
Metrologic Group – Metrolog X4 – Universal 3D metrology software.
22. Low-Poly 3D Modeling
Onboarding | Reducing Friction

(Low-Poly 3D): Modular Blocks Assembling Effortlessly
The Visual & Narrative Approach
Scenario: A low-poly 3D scene where a digital factory is being self-assembled. Blocks of "Construction Yellow" and "Sky Blue" fly in to form a complete building against a white background. The style is geometric and faceted, suggesting that the implementation process is simple and modular.
Narration: "Don't rebuild your lab from scratch. Assemble it. Our modular onboarding fits your workflow, block by block."
Psychological Impact & KPI Focus
- Niche Psychology: Implementation is often viewed as a "Demolition Project" that disrupts operations. This visual reframes it as Construction and Growth. It lowers the anxiety of migration by showing it as a clean, additive process.
- Operational Impact: Visualizes Modularity. It demonstrates that the user can start with one module (e.g., Asset Management) and add others (e.g., Uncertainty Calculation) later, supporting a phased rollout.
Strategic Implementation & Trade-offs
- Best Use Case: Kick-off meeting decks and implementation roadmap guides.
- Trade-off: Low-poly is inherently playful. Avoid using it for critical compliance failure scenarios; keep it strictly for "Building/Setup" topics.
Companies using similar video content -
1LIMS – Cloud LIMS for lab operations.
Zendo Lims – Laboratory quality management system.
AmpleLogic – Asset Management Software (AMS) – Enterprise asset management.
23. 2D Animation & UI Composition
Onboarding | Self-Serve Onboarding

(2D UI Animation): Confetti Burst Celebrating Success
The Visual & Narrative Approach
Scenario: A stylized 2D animation scene. A character's hand touches a floating UI window that is popping out of a tablet. Confetti shapes in lavender and white explode gently around the interaction, signifying a "celebration" moment or successful feature activation.
Narration: "Success is a series of small wins. Activate, integrate, and celebrate your first compliant certificate."
Psychological Impact & KPI Focus
- Niche Psychology: Technicians often fear breaking new software. This visual reinforcement creates a Dopamine Loop. It confirms that the action taken was correct and safe, encouraging further exploration.
- Operational Impact: Visualizes User Success. It directly targets "Activation Rate," encouraging users to complete their first key tasks (e.g., uploading an asset) without needing a support call.
Strategic Implementation & Trade-offs
- Best Use Case: In-app empty states or "Success" modals after a task is completed.
- Trade-off: Overuse diminishes the effect. Reserve this "celebration" style for significant milestones, not every click.
Companies using similar video content -
GageList – Online calibration management system.
Ape Software – Calibration Control – Customizable calibration management.
EasyCal – Automated calibration management solution.
24. Bold Kinetic Typography (Visual)
Onboarding | Trial Activation

(Kinetic Typography): Industrial Text Syncing Instantly
The Visual & Narrative Approach
Scenario: Bold kinetic typography visuals. Massive, heavy block letters spelling "SYNC COMPLETE" are rendered with textures of brushed steel and safety orange. The letters slam together in the center of the frame against a white background. The movement is aggressive and energetic.
Narration: "Don't wait for the update. Force it. Sync your entire fleet of instruments in milliseconds."
Psychological Impact & KPI Focus
- Niche Psychology: Metrology is often slow. This style appeals to the Need for Speed. It uses the visual language of heavy machinery (impact, steel) to sell the speed of software.
- Operational Impact: Visualizes Latency Reduction. It creates a visceral sense that the system is powerful and instantaneous, overcoming the perception of "cloud lag."
Strategic Implementation & Trade-offs
- Best Use Case: 6-second bumper ads on social media to re-engage stalled trial users.
- Trade-off: It provides zero information about how it works. It is purely a hype tool to generate energy and clicks.
Companies using similar video content -
xTrak – Cloud-based calibration tracking.
Tradinco – AutoCal – Automated calibration scheduling & execution.
CompuCal – Calibration management software.
25. Macro UI Micro-Interactions
Retention | Accelerating TTV

(Macro UI): Tactile Toggle Triggering Action
The Visual & Narrative Approach
Scenario: An extreme macro close-up of a UI button on a screen. The button is pill-shaped, colored vivid emerald green, and reads "On". A realistic finger is hovering over it, about to toggle it. You can see the sub-pixels of the screen mesh. The background is a blurred white interface.
Narration: "One click. That's the distance between 'To-Do' and 'Done'. Experience the power of simplicity."
Psychological Impact & KPI Focus
- Niche Psychology: This focuses on Tactile Satisfaction. Even in software, the illusion of a physical "button press" creates a sense of control and finality. It promises a frictionless interface.
- Operational Impact: Visualizes Ease of Use. It highlights the "One-Click" philosophy of the platform, directly addressing KPIs related to workflow efficiency and technician adoption.
Strategic Implementation & Trade-offs
- Best Use Case: Feature highlight reels focusing on specific time-saving tools (e.g., "One-Click Calibration").
- Trade-off: Requires high-resolution rendering. If the "screen pixels" look fake, it breaks the immersion.
Companies using similar video content -
Beamex – CMX – Digital calibration management solution.
Fluke Calibration – MET/CAL – Automated calibration software.
PrimeTechnology – ProCalV5 – Enterprise calibration management.
26. Holographic UI over 3D Render
Retention | Reducing Support
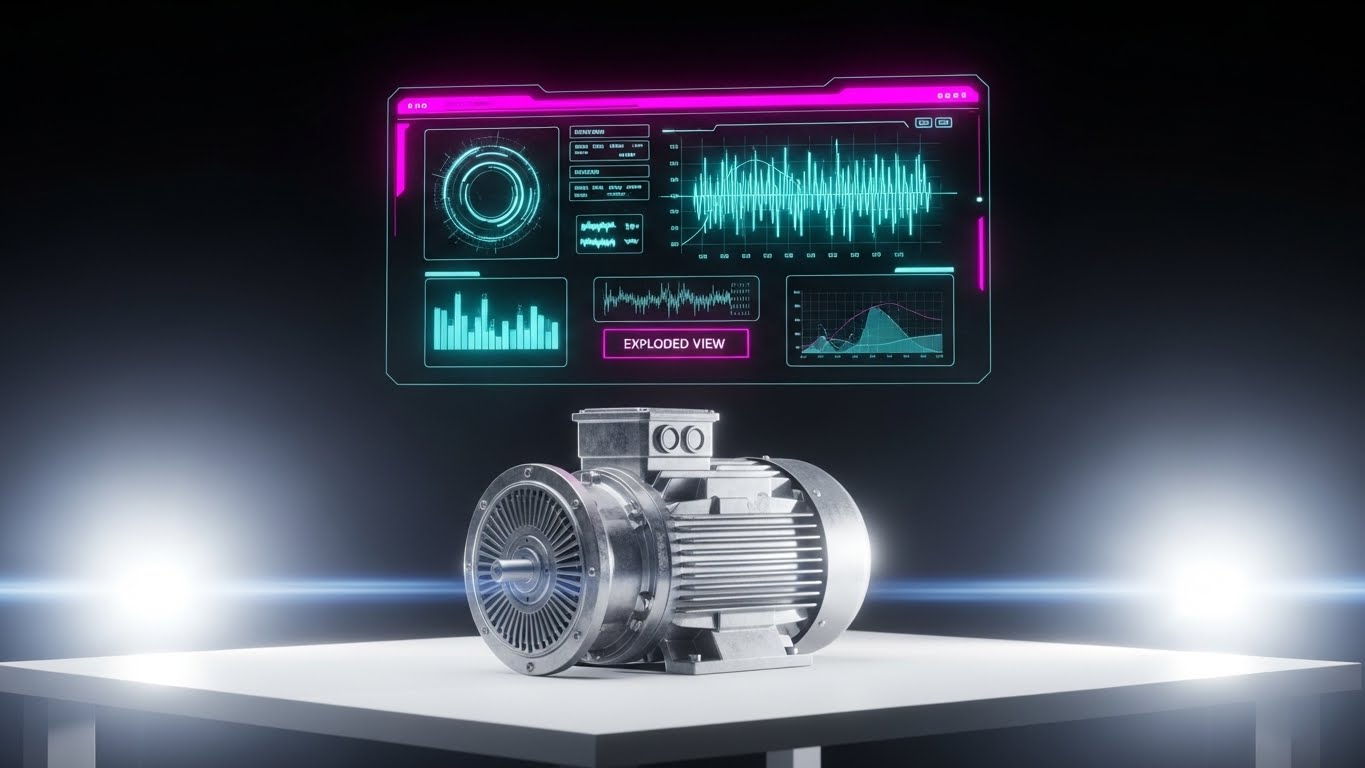
(Holographic UI): Exploded View Diagnosing Issues
The Visual & Narrative Approach
Scenario: A realistic 3D model of an industrial motor sits on a white workbench. Hovering above it is a futuristic, transparent holographic UI in cyan and glass textures. The UI displays an "Exploded View" button and signal waveforms. The lighting is bright and clean.
Narration: "See beyond the surface. Diagnostics that hover right where you need them, guiding every repair."
Psychological Impact & KPI Focus
- Niche Psychology: This taps into the fantasy of Augmented Intelligence. Technicians want to feel enhanced by their tools. This visual suggests the software gives them X-ray vision and expert guidance.
- Operational Impact: Visualizes Self-Service Support. It implies that the answers are embedded in the workflow, reducing the need to open support tickets or consult external manuals.
Strategic Implementation & Trade-offs
- Best Use Case: "Help Center" articles or tutorial videos explaining complex diagnostic features.
- Trade-off: High production cost. Use this only for your most complex, high-value features where users frequently get stuck.
Companies using similar video content -
Hexagon – PC-DMIS – 3D metrology & inspection software.
New River Kinematics – SpatialAnalyzer – Portable 3D metrology software.
InnovMetric – PolyWorks – Universal 3D metrology software.
27. Abstract 2D Motion Graphics
Retention | Reducing Churn

(Abstract Motion): Infinite Flow Ensuring Uptime
The Visual & Narrative Approach
Scenario: Abstract 2D motion graphics featuring an infinite loop of smooth, flowing lines in a spectrum of blue, indigo, and white. The lines never break or jitter, symbolizing continuous uptime and reliability. The background is a clean, bright white.
Narration: "Reliability isn't a feature. It's a flow. Keep your lab moving with 99.9% uptime and zero interruptions."
Psychological Impact & KPI Focus
- Niche Psychology: The greatest fear in a lab is "Stoppage." This visual creates a hypnotic sense of Continuity. It subconsciously reassures the client that the platform is stable, consistent, and always running.
- Operational Impact: Visualizes System Health. It reinforces the value of the subscription by highlighting reliability—a key factor in renewal decisions.
Strategic Implementation & Trade-offs
- Best Use Case: Background visuals for "Quarterly Business Review" presentations or renewal emails.
- Trade-off: It is very abstract. It reinforces a feeling of stability but communicates no specific data.
Companies using similar video content -
SIMCO – CERDAAC – Cloud quality management for regulated industries.
AmpleLogic – Asset Management Software (AMS) – Enterprise asset management.
Optimiso Group – Optimiso Suite – ISO 17025 QMS software.
28. 3D Parallax UI Presentation
Expansion | Feature Adoption

(3D Parallax): Layered Modules Deepening Value
The Visual & Narrative Approach
Scenario: A 3D parallax composition of floating UI cards. The cards represent different software modules, arranged in depth like layers of glass. Colors are purple and transparent white. The perspective is angled to show the thickness and separation of the layers against a blurred lab background.
Narration: "Your needs grow. So do we. Layer on advanced modules without disrupting your core workflow."
Psychological Impact & KPI Focus
- Niche Psychology: Lab Managers fear that adding new features will break existing processes. The "Layered" approach visually communicates Non-Destructive Expansion. It shows new value being added on top of the foundation, not replacing it.
- Operational Impact: Visualizes Scalability. It supports the "Upsell" conversation by showing that the platform is a multi-layered ecosystem, encouraging the adoption of add-on modules.
Strategic Implementation & Trade-offs
- Best Use Case: Product pages for premium add-ons (e.g., "Advanced Analytics Module").
- Trade-off: Ensure the UI content on the cards is legible. If the text is too small, the message of "specific modules" is lost.
Companies using similar video content -
MasterControl – Asset Excellence – CMMS & calibration management.
Labsols – CALIBRATION LIMS – LIMS for calibration labs.
Qualityze – Calibration Management – Cloud-based compliance & calibration.
29. Generative AI Realistic Character video
Expansion | Driving Upsell

(Gen AI Character): Professional Guide Inviting Partnership
The Visual & Narrative Approach
Scenario: Realistic Character video. A professional female presenter with a confident expression, wearing a navy blazer, stands in a blurred high-tech laboratory with glass walls. She gestures towards the empty space beside her. Studio lighting, bright and professional.
Narration: "You've mastered the basics. Now, let's unlock the enterprise potential of your lab. Here is what's next."
Psychological Impact & KPI Focus
- Niche Psychology: In the expansion phase, the relationship shifts from "Vendor" to "Partner." A human face (even a generated one) builds Personal Connection. It signals that there is expert guidance available for the next level of growth.
- Operational Impact: Visualizes Customer Success. It mimics the experience of a dedicated Account Manager, driving engagement with upsell offers or advanced training.
Strategic Implementation & Trade-offs
- Best Use Case: Personalized video messages sent to accounts that have reached high usage thresholds.
- Trade-off: The "Uncanny Valley." Ensure the lip-sync and movement are high-quality, or it will feel robotic and erode trust.
Companies using similar video content -
Beamex – Digital calibration management solution.
MasterControl – Asset Excellence – CMMS & calibration management.
Fluke Calibration – MET/CAL – Automated calibration software.
30. Hyper-lapse Stock Footage
Expansion | Driving Referrals

(Hyper-lapse): Networked Activity Anchoring Standards
The Visual & Narrative Approach
Scenario: Hyper-lapse style visual of a busy laboratory floor. The background is a motion-blurred stream of colors (white coats, silver machines), while a sharp, static white UI overlay remains focused in the center showing a "Network" icon. The lighting is bright and energetic.
Narration: "The center of the storm. While the industry rushes, your data remains the calm, connected core."
Psychological Impact & KPI Focus
- Niche Psychology: Successful labs take pride in their Throughput. This style validates their hard work while positioning the software as the stable anchor that makes the speed possible. It appeals to their sense of professional accomplishment.
- Operational Impact: Visualizes Network Effect. It serves as a powerful "Social Proof" asset, suggesting that high-performing, busy labs rely on this platform, which encourages referrals.
Strategic Implementation & Trade-offs
- Best Use Case: "Year in Review" videos or Case Study intros sharing high-volume success metrics.
- Trade-off: Motion blur can be dizzying. Keep the central UI element perfectly static to anchor the viewer's eye.
Strategic Knowledge Base: The Visual Operations Doctrine
To transform these 30 visual styles from "marketing assets" into a cohesive business driver, we must move beyond "content creation" and establish a "Visual Operating System" for the enterprise. This framework is divided into three strategic segments: Alignment, Adoption, and Impact.
Strategic Alignment & Visual Architecture
The "Pre-Production" Strategy – Why and Who
- The Cognitive Load Audit: Before designing a single frame, audit your current training materials. If a calibration procedure takes 40 pages of text, it creates high cognitive load and error risk. Replace it with Style 26 (Holographic UI) or Style 2 (Line Art) to compress complex instructions into digestible visual packets.
- Role-Based Visual Mapping: Differentiate your visual language. Bench Technicians need Style 10 (Lifestyle UI) on mobile—fast, high-contrast, and glanceable. Quality Directors need Style 15 (Dynamic Data) on desktop—dense, analytical, and trend-focused. One style does not fit all.
- The "Glanceability" Standard: In a high-throughput calibration lab, a technician has milliseconds to interpret a "Pass/Fail" result. Design your in-app visuals (Style 25) to be instantly readable without decoding text.
- Brand Voice Consistency: Your marketing visuals (Style 1) must match your product UI (Style 12). If marketing promises "Simple" but the UI looks "Complex," you create a "Trust Gap" that leads to churn.
- The Advids Strategic Audit: Leveraging an external partner like Advids during this phase ensures that your visual language is built on an objective analysis of market gaps, not just internal preferences. We help define the "Visual Operating System" before production begins.
- Standardization vs. Customization: Use Style 20 (Isometric 3D) for standard workflows (Logistics). Use bespoke Style 14 (3D X-Ray) only for your unique proprietary features (e.g., Drift Analysis) to maximize budget impact.
- The Cross-Departmental Bridge: Use visuals to align Sales and Ops. When Sales uses Style 11 (Wireframe to Reality) to promise "Order," Ops must be able to deliver that reality. Visuals become the shared contract.
- Legacy System Integration: Your customers likely have old hardware. Use Style 13 (Split Screen) to visually acknowledge their legacy reality while showing the bridge to your modern SaaS solution, respecting their past while selling the future.
- Accessibility in the Lab: Metrology is global. Relying on Style 7 (Abstract Organic) and Style 22 (Low-Poly) allows you to communicate concepts like "workflow flow" and "onboarding" across language barriers without expensive translation.
- The Mobile-First Mandate: Technicians are leaving the desk. Ensure all styles, especially Style 18 (2D over Live Action), are optimized for vertical consumption on tablets and mobile devices used at the calibration bench.
Operational Adoption & Implementation
The "Deployment" Phase – Embedding Visuals into Workflow
- Overcoming "Audit Anxiety": The fear of an auditor finding a gap is paralyzing. Use Style 1 (Minimalist Shield) and Style 17 (Dark Mode Security) to visually reinforce that the system is a "Compliance Fortress," lowering user anxiety.
- The Micro-Learning Shift: Stop sending PDF manuals. Deploy Style 25 (Macro UI) videos—15 seconds long—triggered by specific user actions. This "Just-in-Time" learning reduces the learning curve slope.
- Embedded Support: Integrate Style 26 (Holographic UI) directly into the help desk. When a user searches "Error 404," show them an exploded view of the solution, not a text article.
- Gamification of Accuracy: Use Style 23 (Confetti UI) to reward mundane tasks like "Daily Data Sync." Visual positive reinforcement builds habit loops that manual enforcement cannot match.
- Reducing Support Ticket Volume: There is a direct correlation between the quality of your Onboarding visuals (Style 22) and the volume of "How-to" support tickets. Invest in the former to reduce the cost of the latter.
- Remote Onboarding: For distributed lab teams, you cannot be there in person. Style 29 (Gen AI Character) acts as the scalable "Trainer," providing a consistent, friendly onboarding experience to thousands of users simultaneously.
- Visual SOPs: Transform "Standard Operating Procedures" into "Visual Operating Paths." Use Style 2 (Line Art) to show the flow of data, ensuring that every technician visualizes the process identically.
- Feedback Loops: Use interactive video elements. If a user watches a Style 28 (Parallax) feature video and drops off, it signals a UI clarity issue. Visual consumption data is product feedback.
- Scalable Localization: By separating text overlays from the core animation in Style 9 (Rapid UI), you can localize your assets for German, Japanese, or French markets with minimal re-rendering costs.
- Leadership Communication: When the Lab Manager needs to justify the renewal to the CFO, give them Style 15 (Dynamic Data). Equip your champion with the visual tools to sell your value internally.
Measuring Impact & Future-Proofing
The "ROI" Phase – Measuring Success and Looking Ahead
- Beyond "Views": Don't measure video views. Measure "Time-to-Competency." Did watching the Style 26 video reduce the time it took to calibrate the unit? That is the real metric.
- The "Idle Time" Metric: Poor software UX causes "Idle Time" where technicians are confused. High-clarity visuals like Style 12 (Clean UI) directly reduce this waste, increasing lab throughput.
- Compliance Velocity: When a new standard (e.g., ILAC P14) is released, how fast can you retrain the fleet? Video updates using Style 4 (Kinetic Typo) disseminate critical changes faster than memos.
- Retention and Churn: High-quality UI visualization (Style 25) increases perceived value. Customers who "see" the sophistication of the tool are less likely to churn to a cheaper, uglier competitor.
- The AI Visual Frontier: Prepare for real-time generative help. In the future, the Style 29 character won't just be a video; it will be an interactive AI agent answering questions live.
- Scalability of Assets: Build a library, not a folder. Organize assets by "Style Code" so that when you launch a new module, you can quickly grab Style 20 assets to maintain consistency.
- The Advids Partnership: Visual strategy is not a one-time project; it is an evolving infrastructure. Advids serves as the long-term partner for your visual consistency, ensuring that your asset library scales in quality and quantity as your platform grows.
- Benchmarking Success: Your visuals are a competitive moat. If your competitor uses generic stock photos and you use Style 14 (3D X-Ray), you win the "Perceived Quality" battle before the demo even starts.
- The ROI of Quality: Visual training reduces human error. One fewer "Out of Tolerance" event saved by clear instruction pays for the entire video production budget.
- Final Call to Innovation: Treat video as infrastructure. It is not "Marketing Content"; it is the user interface of your knowledge base. Invest in it with the same rigor you invest in your code.
Companies using similar video content -
SafetyCulture – Mobile-first inspection and calibration.
GageList – Online calibration management system.
KloudGin – Field Service and Asset Management – FSM & EAM with calibration.
Author & Editor Bio


