
Introduction: Visualizing the Digital Nervous System of Trade
The logistics industry is currently undergoing its most significant transformation since the invention of the shipping container. We are witnessing a shift where the physical movement of atoms is entirely dependent on the movement of digital bits. For Transportation Management Software (TMS) and SaaS platforms, this presents a unique communication challenge: How do you visualize the invisible velocity of data that powers global trade? The "Physical/Digital Divide" is real—stakeholders often struggle to connect complex algorithmic optimization with the tangible reality of trucks, ships, and warehouses.
The opportunity for clarity has never been greater. As the industry accelerates, the demand for sophisticated management solutions is skyrocketing. In fact, the global transportation management systems market is predicted to hit around USD 43.82 billion by 2034, driven by the need for automation and real-time intelligence. This growth isn't just about software adoption; it's about a fundamental restructuring of how supply chains operate.
However, capturing this market requires more than just listing features; it requires proving value through compelling visual narratives. The efficiency gains are tangible and proven—companies leveraging these systems can reduce transportation costs by 15 percent, a statistic that speaks directly to the bottom line of your target persona. To communicate this ROI effectively, your video content must reduce cognitive load, making complex integrations feel seamless and intuitive.
This guide acts as your strategic framework. We have curated 30 distinct visual styles, mapped to specific funnel stages and psychological triggers, to help you bridge the gap between "software features" and "operational excellence." By adopting these "Gold Standard" examples, you can shape perception, drive adoption, and position your platform as the central nervous system of modern logistics.
1. The "Network Fluidity" Approach
TOFU | Brand Awareness
The Visual & Narrative Approach
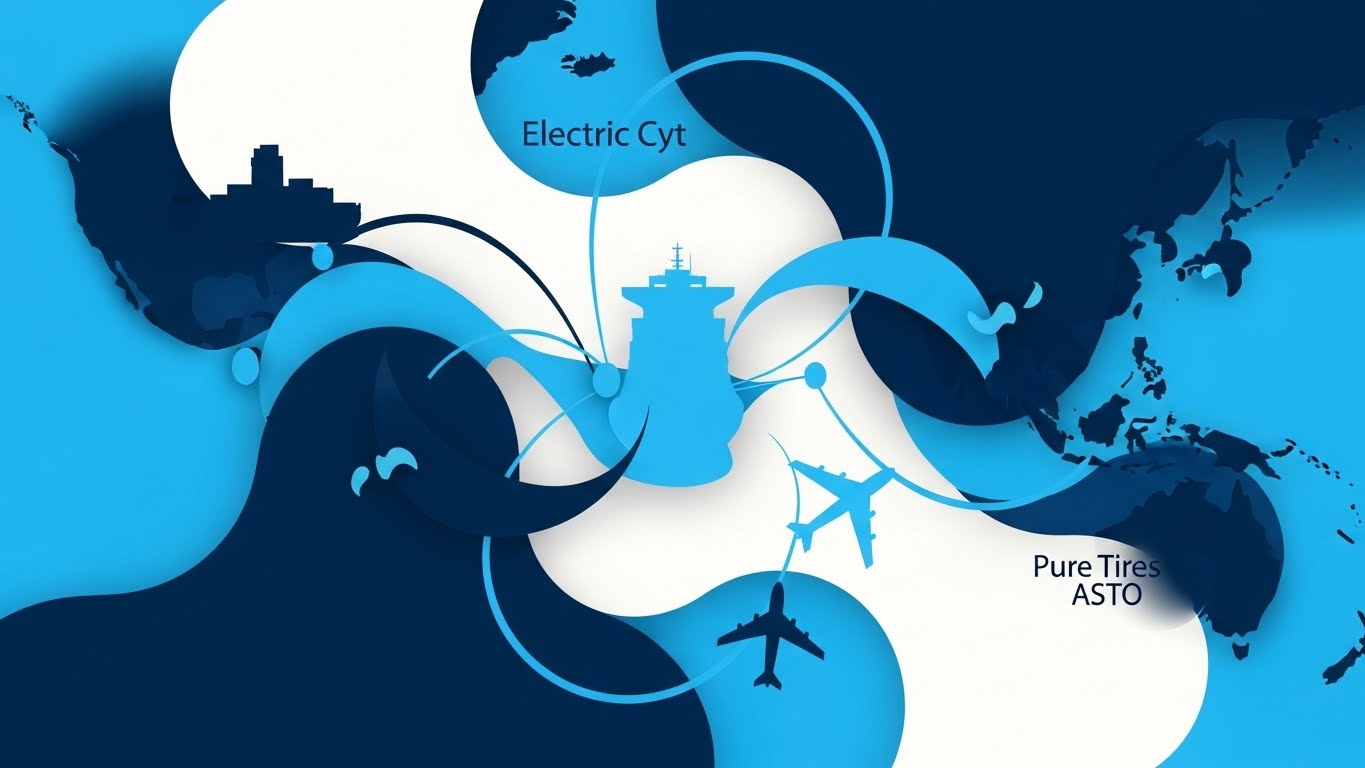
This style abandons rigid mechanical metaphors in favor of a biological, fluid aesthetic. The screen presents a top-down, satellite-style view of a stylized globe, where trade routes are not merely lines, but flowing streams of "Electric Cyan" and "Deep Navy Blue." The motion is continuous and organic; the forms of a cargo ship and an airplane do not just appear—they merge and morph from the liquid shapes of the network itself. The narration here should be smooth and sophisticated, emphasizing "orchestration," "flow," and "ecosystem" rather than "management" or "control."
Psychological Impact & KPI Focus
Psychologically, this style addresses the anxiety of fragmentation. By using interlocking organic shapes, it subtly reinforces the concept of seamless integration (Framework ID: 1.1 Brand Awareness). It soothes the viewer's cognitive load by presenting complex multi-modal logistics as a harmonious, unified system. The operational impact visualized here is "Network Synergy"—demonstrating that your platform doesn't just manage distinct nodes, but harmonizes the entire flow of goods, directly supporting KPIs related to Supply Chain Resilience and Network Uptime.
Strategic Implementation & Trade-offs
- Optimal Use Case: Top-of-Funnel (TOFU) brand anthems and high-level social ads (Meta) where the goal is to stop the scroll with gloss and motion.
- Trade-offs: While visually stunning, this style is less effective for explaining specific UI features or technical workflows. It is a mood-setter, not a manual.
- Duration: Keep this punchy at 15-30 seconds (4:5 aspect ratio) to maximize retention on mobile feeds.
Companies using similar video content -
project44 – Movement by project44 – Visualizes global supply chain data flows organically.
FourKites – Visibility Platform – Shows fluid, interconnected real-time tracking networks.
Shippeo – Real-Time Transportation Visibility – Depicts seamless, flowing global shipment data.
2. The "Blueprint of Clarity" Approach
TOFU | Market Education
The Visual & Narrative Approach
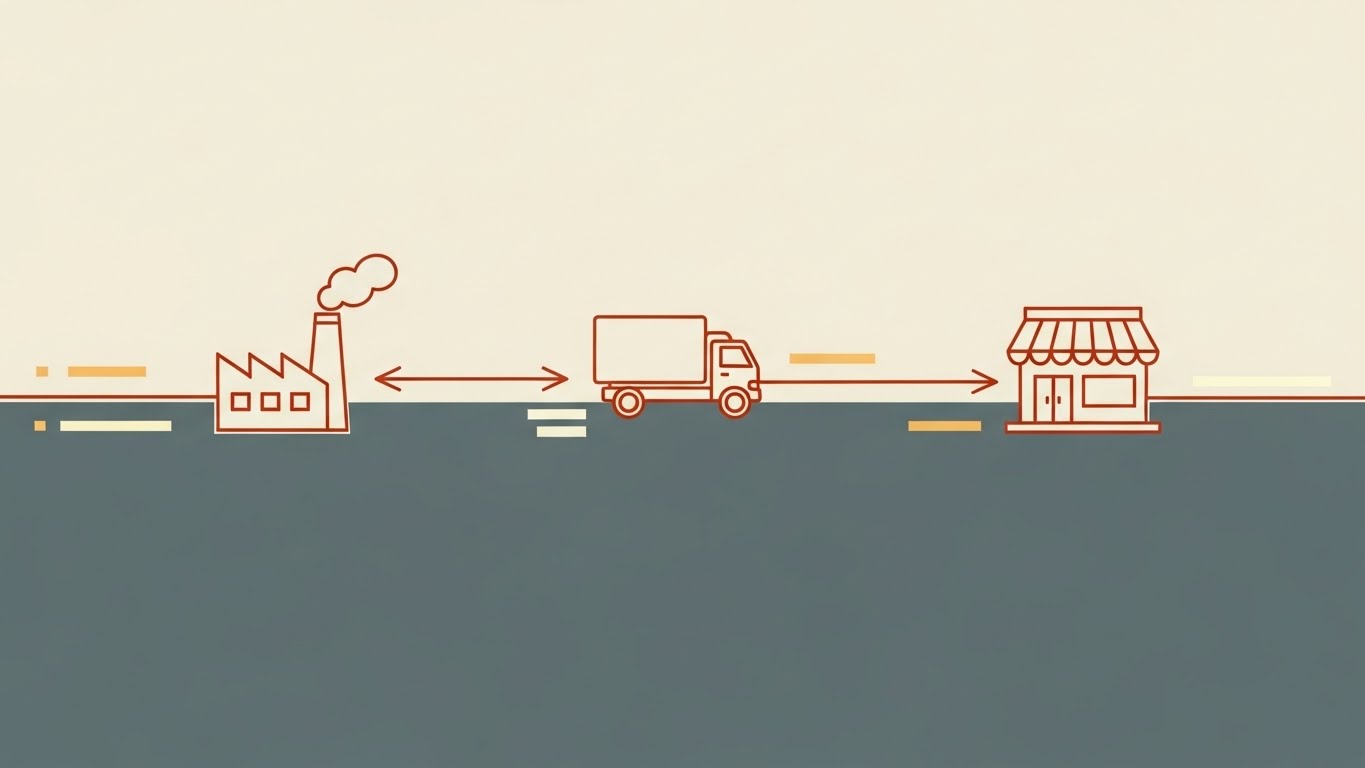
Elegance lies in simplicity. This style utilizes a single, unbroken "Burnt Orange" line that traverses a "Slate Grey" canvas, drawing the technical schematic of a supply chain in real-time. The line acts as a storyteller, physically connecting the icon of a factory to a truck, and finally to a retail store. The movement is precise and architectural, mimicking a blueprint coming to life. There are no distractions—no shadows, no gradients—just the purity of the vector path visualizing the flow of goods.
Psychological Impact & KPI Focus
This visual style appeals to the logical, process-driven side of the Logistics Manager (Framework ID: 1.3 Market Education). It conveys "Precision" and "Direct Control." By stripping away visual noise, it signals that your software is a tool for clarity, cutting through the chaos of modern logistics. It bridges the physical/digital divide by schematically representing the flow of goods as a predictable, linear process. This directly aligns with KPIs for Process Optimization and Error Reduction, assuring the viewer that nothing gets lost in the cracks.
Strategic Implementation & Trade-offs
- Optimal Use Case: Blog headers, "How It Works" overview pages, or explainer intros where clarity is paramount.
- Trade-offs: The minimalist nature can feel "cold" or "low-budget" if not executed with smooth, high-frame-rate animation. It lacks the emotional hook of cinematic styles.
- Duration: Ideal for 30-60 seconds (16:9 aspect ratio), allowing enough time for the line to "travel" the full journey without rushing the educational moment.
Companies using similar video content -
Descartes – Global Trade Services – Traces clear, linear paths for trade compliance.
E2open – Global Trade Management – Illustrates precise, step-by-step custody chains.
Tive – Solo 5G Tracker – Visualizes unbroken paths of in-transit monitoring.
3. The "Future of Freight" Approach
TOFU | Shaping Brand Perception
The Visual & Narrative Approach
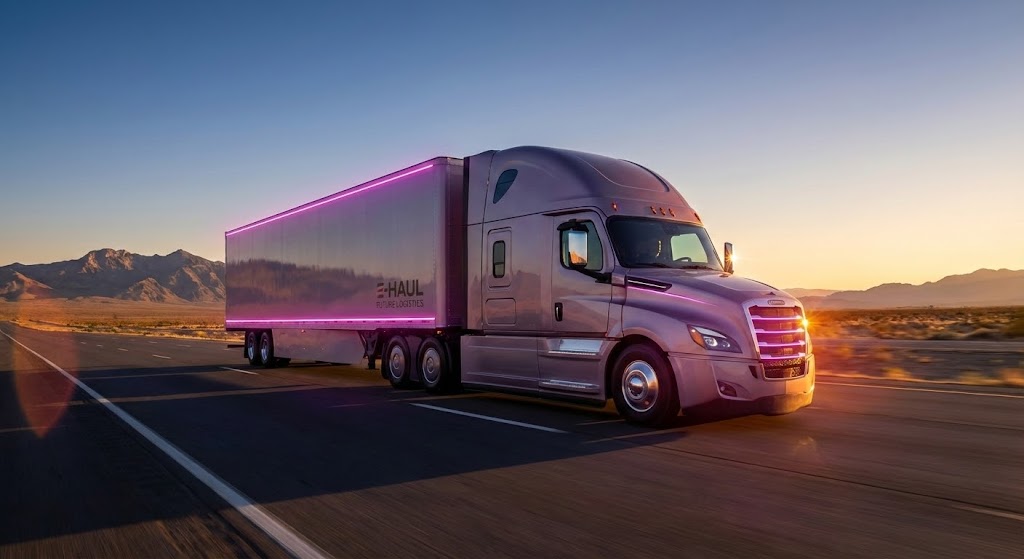
This style leverages high-end Generative AI to create an aspirational reality. We see a majestic tracking shot of a futuristic electric semi-truck, its aerodynamic chrome body reflecting the warm flares of a golden-hour sun. The subtle "Sunset Magenta" LED accents signal innovation and electrification. The environment is vast—a desert highway leading toward distant mountains—symbolizing the open road and limitless potential. The voiceover should be deep, cinematic, and inspiring, speaking to "horizons," "tomorrow," and "sustainable velocity."
Psychological Impact & KPI Focus
Here, we are shaping Brand Perception (Framework ID: 1.5). The target audience, often bogged down by legacy tech and aging fleets, aspires to be part of a modern, forward-thinking industry. This style taps into that aspiration, positioning your brand as a pioneer of the future. It addresses the pressure for Sustainability and Innovation, validating the viewer's desire to modernize their operations. The visual fidelity suggests a high-value, enterprise-grade solution that is ready for the next decade of logistics.
Strategic Implementation & Trade-offs
- Optimal Use Case: YouTube pre-rolls, homepage hero backgrounds, and keynote openers. This is your "blockbuster" trailer.
- Trade-offs: While impactful, this style can be resource-intensive to produce perfectly (even with Gen AI) and risks looking "fake" if the physics of the truck aren't grounded. It sets a high expectation for the actual product interface.
- Duration: Best as a 30-60 second mood piece (16:9 aspect ratio) to allow the cinematic shots to breathe.
Companies using similar video content -
Einride – Saga – Projects futuristic electric and autonomous freight operations.
TuSimple – Autonomous Freight Network – Showcases aspirational self-driving truck technology.
Plus.ai – PlusDrive – Visualizes advanced autonomous driving for long-haul trucking.
4. The "Category Creator" Approach
TOFU | Category Creation

The Visual & Narrative Approach
This style is Bauhaus-inspired: functional, geometric, and bold. The composition is symmetrical, featuring a "Mint Green" and "Charcoal" icon where a mechanical gear (representing industry) seamlessly meshes with a cloud shape (representing technology). The lines are thick and uniform, creating a symbol that is instantly readable even at small sizes. The background is a flat, solid color to ensure the focus remains on the central metaphor. There is no complex motion here—perhaps a subtle rotation of the gear—symbolizing the "New Category" of Cloud Logistics.
Psychological Impact & KPI Focus
The goal here is Category Creation (Framework ID: 1.2). In a crowded market, simple symbols stick. This visual reduces cognitive load to the absolute minimum, allowing the viewer to instantly grasp the core value proposition: "Industrial strength meets Cloud agility." It addresses the skepticism of complexity by presenting a solution that looks clean and integrated. This style reinforces Ease of Deployment and Modernization, signaling that the transition to the cloud is stable and structured.
Strategic Implementation & Trade-offs
- Optimal Use Case: LinkedIn organic posts, slide decks, and icon systems within the software itself.
- Trade-offs: It can be too abstract for explaining complex features. It works best as a "concept anchor" rather than a detailed instructional aid.
- Duration: Perfect for short loops or static images, effectively 5-10 seconds of subtle motion (1:1 aspect ratio) for social feeds.
Companies using similar video content -
Flexport – Platform – Defines modern freight forwarding with minimalist symbols.
Convoy – Digital Freight Network – Creates a new category for digital freight matching.
Loadsmart – Digital Freight Platform – Symbolizes automated freight booking and optimization.
5. The "Kinetic Velocity" Approach
TOFU | Vertical Social Organic
The Visual & Narrative Approach
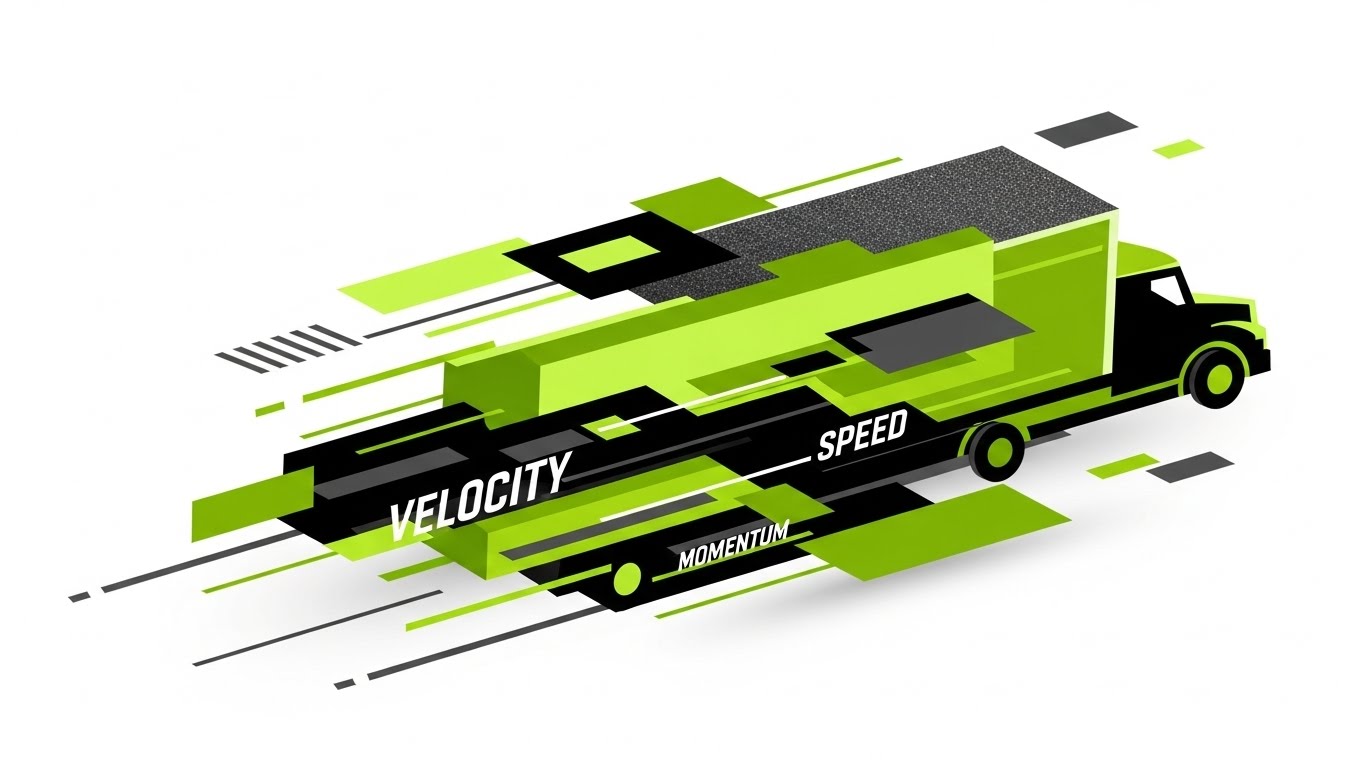
This is a visual representation of pure energy. Bold, blocky text and geometric shapes in "Vivid Lime Green" and "Black" rush diagonally across a white background. The text isn't just reading material; it's a physical object with weight and momentum, mimicking the motion blur of a fast-moving trucks. Graphic elements like speed lines and asphalt textures are integrated into the graphical elements. The visual metaphor conveys "Velocity" and "Momentum" in a high-energy, scroll-stopping style.
Psychological Impact & KPI Focus
Designed for the Vertical Social Organic feed (Framework ID: 3.5), this style targets the viewer's need for speed and efficiency. It creates a sense of urgency and excitement, countering the perception of logistics as "slow" or "boring." It visually stimulates the brain's motion processing centers, grabbing attention immediately. The operational KPI highlighted here is Velocity and Throughput—implying that your software accelerates decision-making and freight movement alike.
Strategic Implementation & Trade-offs
- Optimal Use Case: TikTok, Instagram Reels, and YouTube Shorts. It’s designed to stop the thumb-scroll.
- Trade-offs: It moves too fast for deep information retention. Use it to hype a launch or a specific benefit (e.g., "Faster Quotes"), not to train a user.
- Duration: Strictly 15 seconds (9:16 aspect ratio) to align with social media algorithm preferences.
Companies using similar video content -
FreightWaves – SONAR – Conveys rapid real-time freight market data.
Turvo – Collaboration Cloud – Emphasizes speed in unifying supply chain operations.
Rose Rocket – TMS – Highlights operational velocity for freight brokers and carriers.
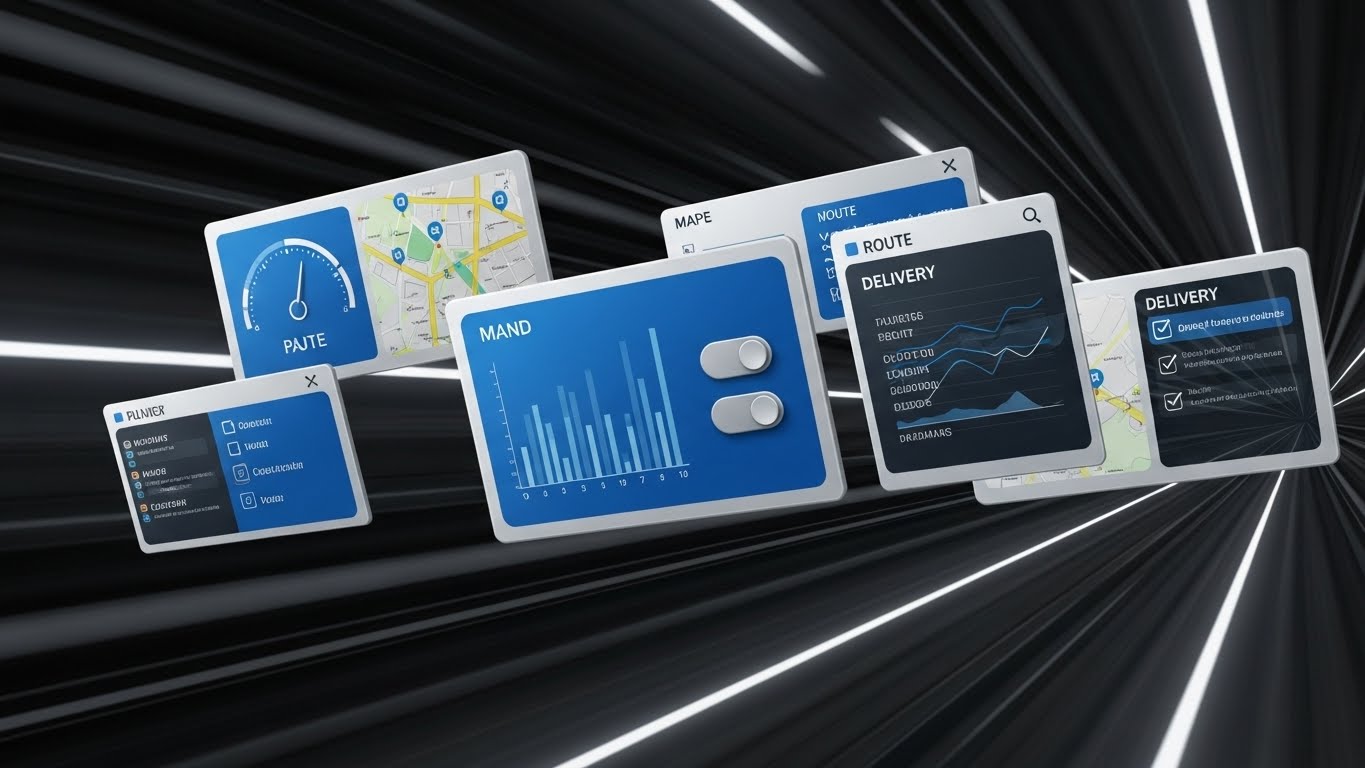
6. The "Data Flight Deck" Approach
TOFU | Skippable Pre-Roll Ad
The Visual & Narrative Approach
Simulating the speed of a digital nervous system, this style uses a "tunnel" effect where widgets and dashboards fly toward the viewer. We see "Royal Blue" and "Metallic Silver" interface elements—fuel gauges, route maps, delivery checklists—floating in 3D space. The camera pushes through them, mimicking a pilot flying through a HUD (Heads-Up Display). The focus is on the crisp details of the interface elements—toggle switches and rising graphs—conveying speed and immediate data visibility.
Psychological Impact & KPI Focus
This acts as a Skippable Pre-Roll Ad (Framework ID: 4.1). It addresses the "Vaporware" skepticism by showing the actual product interface, but in a heightened, exciting way. It proves that the software is real, robust, and data-rich. The "tunnel" effect visually represents Deep Visibility—the ability to see into every aspect of the supply chain. It promises Immediate Data Access and Control, satisfying the persona's need to be on top of their operations at all times.
Strategic Implementation & Trade-offs
- Optimal Use Case: Pre-roll ads where you have 5 seconds to hook the viewer before they skip.
- Trade-offs: It can be overwhelming if the motion is too chaotic. It requires careful pacing to ensure the UI elements are legible even in motion.
- Duration: 15-30 seconds (16:9 aspect ratio), with the most critical "hooks" loaded in the first 5 seconds.
Companies using similar video content -
Samsara – Connected Operations Cloud – Presents rapid UI montages of fleet dashboards.
Geotab – Telematics Platform – Shows instant data visibility from telematics UI.
Trimble – Transportation Solutions – Displays quick views of critical transportation data.
7. The "Orbital Control Tower" Approach
TOFU | Connected TV

The Visual & Narrative Approach
This style takes the viewer to orbit. We see a high-end, ray-traced render of the Earth, shrouded in shadow, with major cities glowing like embers. Luminous arcs of light in "Earth Blue" and "Gold" loft high above the atmosphere, connecting continents. These aren't just lines; they are active shipping lanes. Distinct points of light travel along these arcs, pulsing to represent real-time freight tracking. The atmosphere is hazy and realistic. The tone is grand, authoritative, and global.
Psychological Impact & KPI Focus
Targeting Connected TV (CTV) audiences (Framework ID: 4.6), this style instills a sense of "Global Command." It appeals to the ego and responsibility of the Logistics Director, visualizing the massive scope of their influence. It bridges the physical reality of geography with the digital reality of tracking. The key operational message is Global Connectivity and Real-Time Visibility, reassuring the viewer that no matter where their cargo is, it is visible and under control.
Strategic Implementation & Trade-offs
- Optimal Use Case: Trade show booth backdrops, lobby screens, and CTV commercials.
- Trade-offs: High production cost. It is a "macro" view that doesn't explain "micro" problems like last-mile delivery or warehouse sorting.
- Duration: 30-60 seconds (16:9 aspect ratio), slow and majestic.
Companies using similar video content -
Maersk – Maersk Flow – Visualizes global trade tracking from an orbital perspective.
Kuehne+Nagel – eShipAsia – Depicts worldwide freight movements and connectivity.
One Network Enterprises – Real Time Value Network – Shows global logistics network command.
8. The "Human Element" Approach
TOFU | Aspiration & Identity Hook

The Visual & Narrative Approach
Technology serves people, not the other way around. This style uses high-quality, cinematic stock footage. We focus on a Logistics Manager in a clean, modern warehouse. He wears a blue blazer, not a safety vest, signaling a shift from manual labor to management. He holds a tablet, looking off-camera with a satisfied smile, backlit by the bright, airy warehouse lights. The background is blurred (shallow depth of field), hinting at organized high-bay racking. The color grading emphasizes "Sky Blue" and "Steel" tones—clean, cool, and professional.
Psychological Impact & KPI Focus
This serves as an Aspiration & Identity Hook (Framework ID: 8.4). It holds a mirror up to the target persona, showing them the version of themselves they want to be: calm, in control, and successful. It validates their role as a decision-maker. The tablet acts as the bridge between the physical warehouse and digital control. The implied KPI is Employee Satisfaction and Operational Efficiency, suggesting that the right software leads to a better work life and a smoother operation.
Strategic Implementation & Trade-offs
- Optimal Use Case: Instagram ads, "About Us" pages, and recruitment videos.
- Trade-offs: Generic stock footage can kill credibility. It is crucial to use specific, high-production-value clips that don't look "staged" or cliché.
- Duration: 15-30 seconds (4:5 aspect ratio).
Companies using similar video content -
J.B. Hunt – 360box – Humanizes digital control with confident logistics managers.
Ryder – RyderShare – Focuses on empowered individuals managing fleet operations.
C.H. Robinson – Navisphere – Highlights human decision-making supported by technology.
9. The "Tangible ROI" Approach
MOFU | Demand Gen & Lead Capture

The Visual & Narrative Approach
Data becomes physical in this style. Set in a clean, isometric studio environment, we see a bar chart growing—but the bars are built from stacks of realistic miniature shipping pallets. Some pallets are wood, some are gold, symbolizing value. They stack rapidly upwards to the right. The finish is a matte plastic, looking tactile and premium. "Emerald Green" highlights indicate growth and sustainability. This isn't just a chart; it's a visualization of inventory turning into profit.
Psychological Impact & KPI Focus
Used for Demand Gen & Lead Capture (Framework ID: 1.6), this style makes abstract financial metrics concrete. It directly addresses the "Show me the ROI" objection. By translating "data" into "pallets," it speaks the language of the logistics professional. It reinforces the connection between Inventory Optimization and Financial Growth, proving that better management equals more product moving and more revenue generated.
Strategic Implementation & Trade-offs
- Optimal Use Case: Embedded in E-books, Whitepapers, or as a visual aid in a sales presentation.
- Trade-offs: It creates a very specific visual metaphor that might not apply to bulk liquid or service-based logistics.
- Duration: Short loops of 5-10 seconds (4:5 aspect ratio) are effective for emphasizing key stats.
Companies using similar video content -
Manhattan Associates – Active Omni – Tangibilizes inventory optimization into financial gains.
Blue Yonder – Luminate Platform – Visualizes inventory ROI through data-driven charts.
Infor – WMS – Shows physical inventory translating into measurable profit.
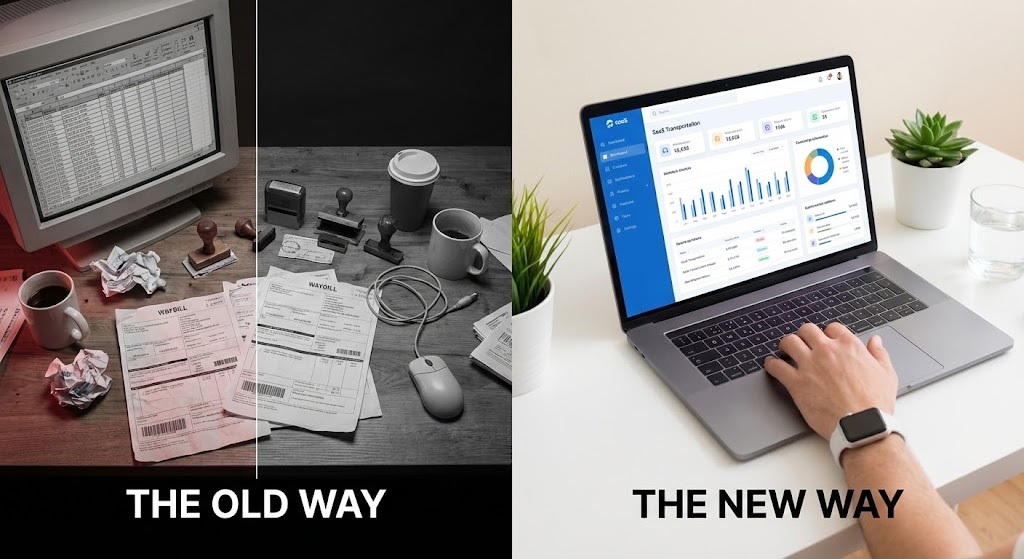
10. The "Transformation Contrast" Approach
MOFU | Product/Solution Differentiation
The Visual & Narrative Approach
A classic but powerful comparative technique. The screen is split down the middle. The left side (Red/Grey) shows a chaotic, messy desk piled with paper waybills—the "Old Way." The right side (Blue/White) shows a pristine environment with a sleek laptop dashboard—the "New Way." The contrast is sharp and immediate.
Psychological Impact & KPI Focus
This is a Product/Solution Differentiation tool (Framework ID: 1.7). It triggers the "Away/Toward" motivation—moving away from pain (chaos) and toward pleasure (order). It validates the viewer's current pain points while offering an immediate visual solution. It visually demonstrates the Cost of Status Quo and the benefit of Digital Transformation, making the software appear as the relief mechanism for their daily stress.
Strategic Implementation & Trade-offs
- Optimal Use Case: Landing pages, conversion-focused ads, and email headers.
- Trade-offs: It can feel manipulative if the "bad" side is too exaggerated. It needs to feel like a realistic "before and after" to be credible.
- Duration: 15-30 seconds (16:9 aspect ratio), allowing the viewer to compare the details of both sides.
Companies using similar video content -
OMP Plus – Supply Chain Planning – Contrasts legacy chaos with modern, optimized planning.
Solvoyo – Supply Chain Analytics – Highlights transformation from manual to AI-driven analytics.
Kinaxis – RapidResponse – Shows the shift from traditional to concurrent planning.
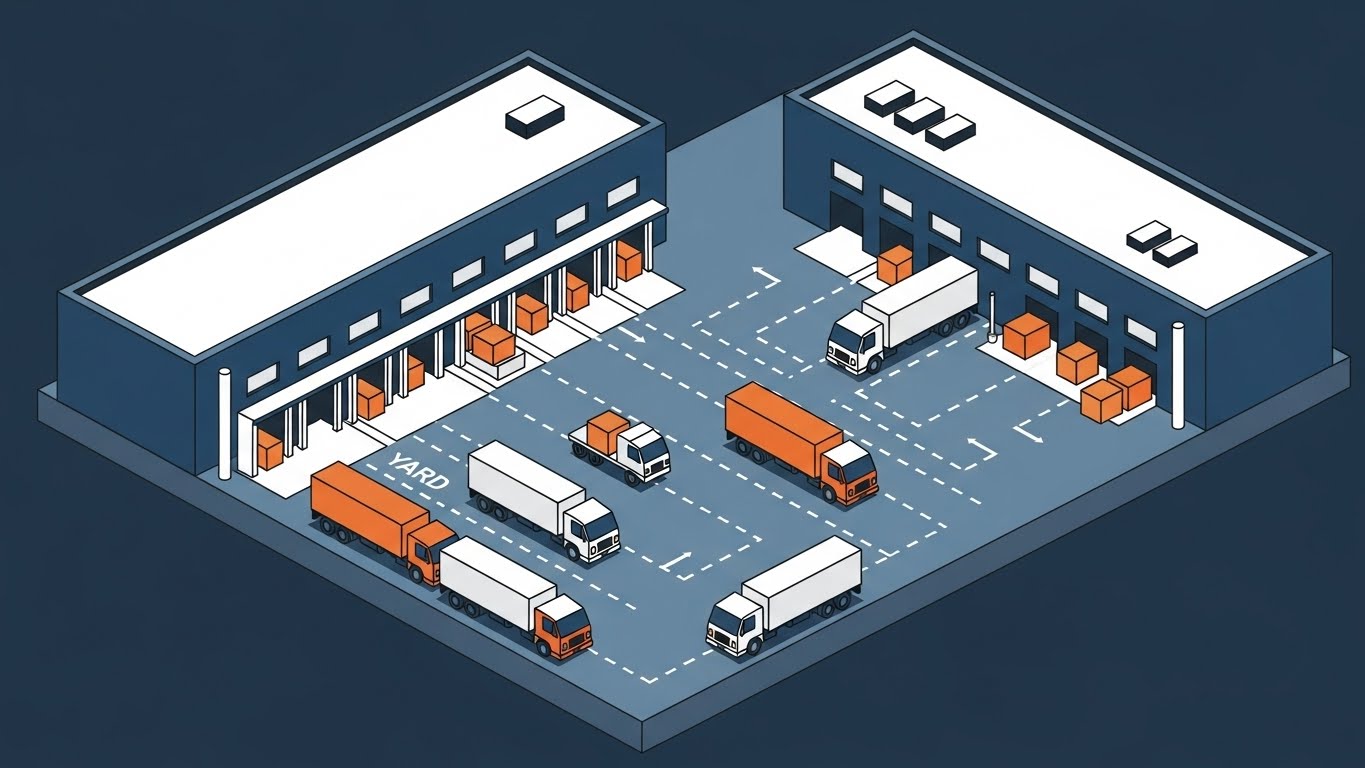
11. The "Logic of Motion" Approach**
MOFU | Feature Education & Demonstration
The Visual & Narrative Approach
This style brings order to the chaos of the shipping yard. We utilize a clean, architectural isometric perspective to present a stylized distribution center. The design language is strictly functional—flat "Navy Blue" and "Industrial Orange" color blocks with no distracting textures or gradients. We see miniature trucks adhering to dotted vector guide lines, docking smoothly, and departing in a synchronized rhythm. The animation doesn't just show movement; it demonstrates logic, visually explaining the algorithm’s ability to slot assets perfectly into place without collision or delay.
Psychological Impact & KPI Focus
For the Operations Manager, a chaotic yard is a daily nightmare. This visual style (Framework ID: 1.8 Feature Education) functions as a "visual sedative," replacing the anxiety of bottlenecks with the satisfaction of perfect order. It serves as a proof-of-concept for Automated Scheduling, reducing cognitive load by showing complex spatial problems solved through simple geometry. The operational KPI here is Dwell Time Reduction, visually proving that your software eliminates the "waiting game" at the dock door.
Strategic Implementation & Trade-offs
- Optimal Use Case: Email marketing campaigns targeting operational leads, specifically for Yard Management System (YMS) features.
- Trade-offs: The stylized, schematic aesthetic may feel too simplistic for audiences seeking photorealistic "Digital Twin" accuracy. It explains the concept of order, not the grit of reality.
- Duration: 30-45 seconds (16:9 aspect ratio) to allow the viewer to track the full cycle of arrival, docking, and departure.
Companies using similar video content -
Körber – HighJump WMS – Visualizes organized warehouse processes and logic.
Tecsys – Elite WMS – Demonstrates efficient movement within distribution centers.
PTV Group – PTV xServer – Explains logistics optimization through precise motion.
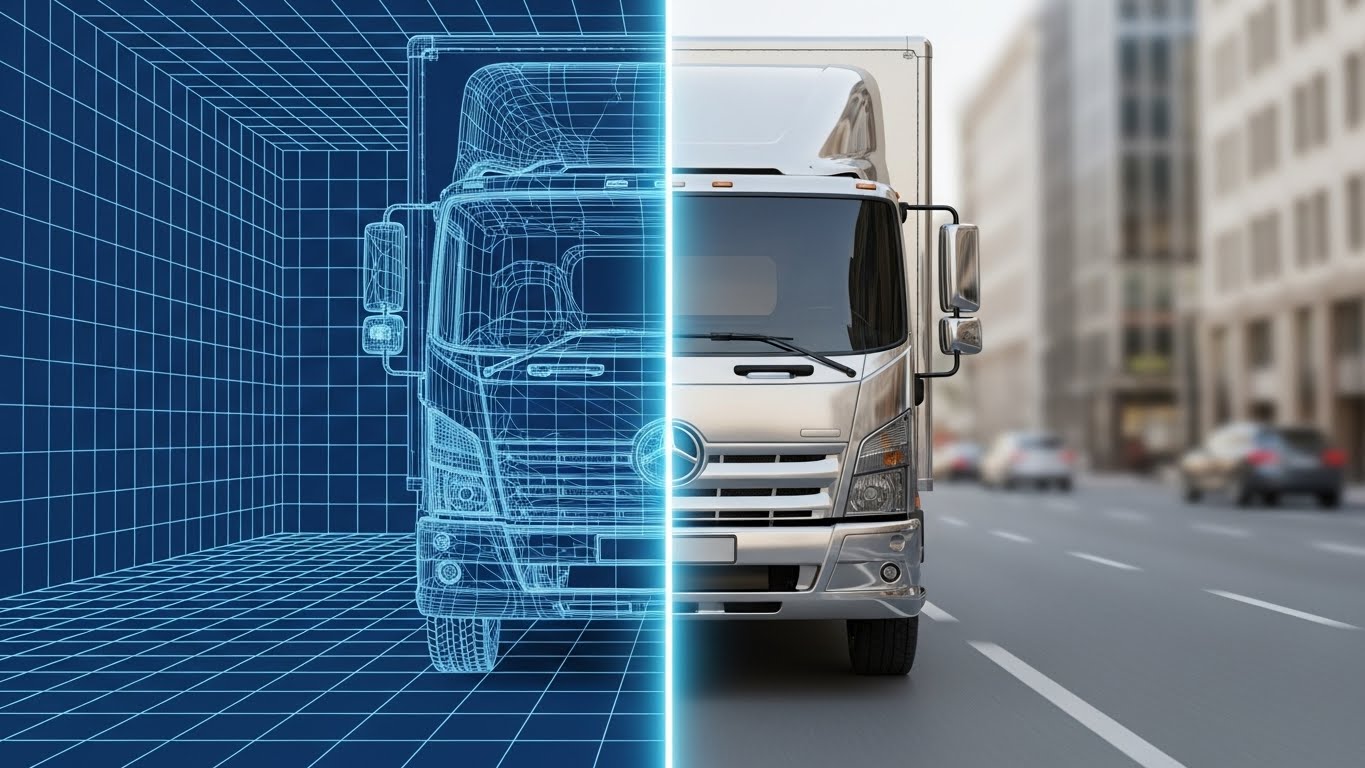
12. The "Evolutionary Leap" Approach
MOFU | Competitive Displacement
The Visual & Narrative Approach
This style visualizes the act of becoming. The screen is split or transitions dynamically. On the left, we see the "Blueprint Blue" wireframe of a truck on a grid—a digital plan representing strategy and data. As the truck crosses a glowing laser threshold to the right, it instantly renders into a solid, photorealistic "Chrome and White" vehicle driving through a blurred city street. The sound design should feature a "digital-to-analog" synthesis sound, emphasizing the materialization of strategy into real-world momentum.
Psychological Impact & KPI Focus
This is a visual metaphor for Competitive Displacement (Framework ID: 1.13). It targets the buyer stuck in "planning mode" or using legacy systems (the wireframe), urging them to cross the threshold into modern execution (the reality). It bridges the Physical/Digital divide by literally showing data becoming matter. The operational message connects Strategic Planning with Fleet Execution, suggesting that your software turns abstract optimization into tangible miles driven and loads delivered.
Strategic Implementation & Trade-offs
- Optimal Use Case: LinkedIn Video Ads and retargeting campaigns aimed at companies undergoing digital transformation.
- Trade-offs: It is a high-concept metaphor. If the "before" state (wireframe) looks too cool, it might fail to position the "after" state as significantly better. The contrast must be sharp.
- Duration: 15-20 seconds (16:9 aspect ratio), designed to loop seamlessly.
Companies using similar video content -
3Gtms – 3G-TM – Visualizes modernization from blueprint to real-world execution.
MercuryGate – TMS – Shows the evolutionary leap from planning to tangible freight.
Alpega TMS – TMS – Depicts the transformation from strategy to operational reality.
13. The "Legacy Bridge" Approach
MOFU | Building Trust & Credibility
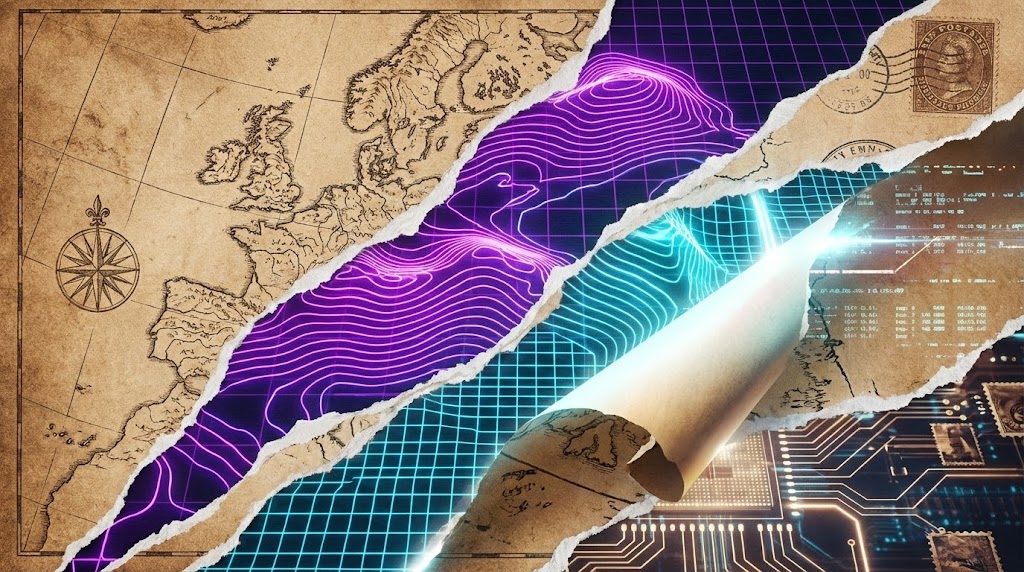
The Visual & Narrative Approach
Logistics is an industry with deep roots. This style honors that history while selling the future. We start with the texture of a vintage, sepia-toned paper map—the tool of the past. Suddenly, the camera pushes through the paper, tearing it open to reveal a vibrant, high-tech "Neon Purple" and "Cyan" digital topographical grid underneath. The motion is aggressive and revelatory. It blends the grit of old-world trucking with the sleekness of modern data, suggesting that your software is the natural evolution of the trade, not a rejection of it.
Psychological Impact & KPI Focus
This style builds Trust & Credibility (Framework ID: 1.9). Many veteran logistics leaders feel alienated by "silicon valley" tech that ignores their experience. By visually blending the old (paper) with the new (neon), you validate their history while positioning your platform as the necessary upgrade. It reinforces Adaptability and Market Evolution, signaling that your solution is robust enough to handle the complex, gritty reality of the industry.
Strategic Implementation & Trade-offs
- Optimal Use Case: Meta (Facebook/Instagram) ads and general social feeds where you need to disrupt the feed with high aesthetic contrast.
- Trade-offs: The artistic, collage style can interpret as "artsy" rather than "enterprise." It works best for brand positioning, not technical training.
- Duration: 15 seconds (9:16 aspect ratio) for vertical mobile consumption.
Companies using similar video content -
McLeod Software – LoadMaster – Blends vintage trucking heritage with modern digital grids.
TMW Systems – Suite – Connects traditional transportation with advanced software solutions.
FreightPOP – TMS – Bridges old-world freight with sleek, modern management.
14. The "Frictionless Planning" Approach
MOFU | Overcoming Objections
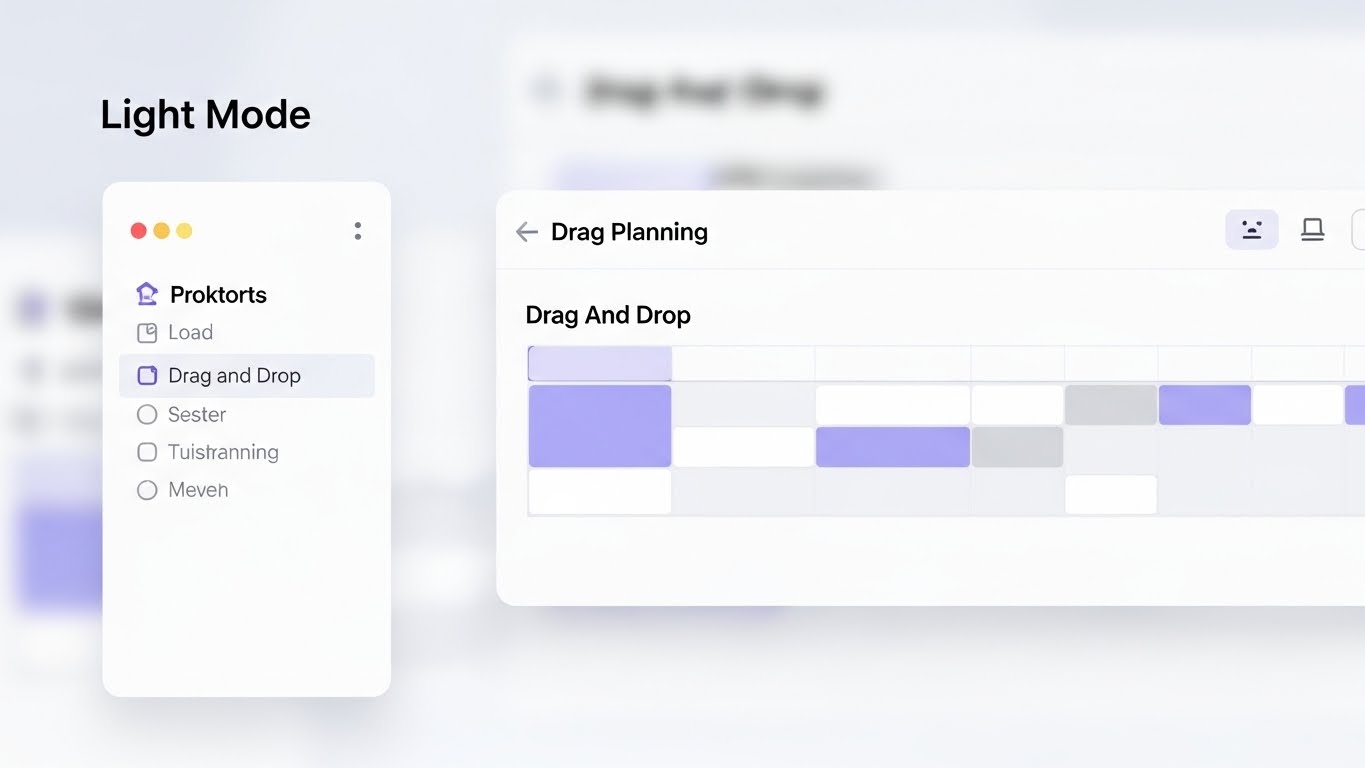
The Visual & Narrative Approach
The enemy of software adoption is perceived complexity. This style strips everything back to a pristine "Light Mode" aesthetic. We focus on a macro shot of a cursor interacting with "Soft Lavender" and "White" blocks on a load planning timeline. The movement is effortless—a simple click, drag, and snap. There is no clutter, no intimidating data tables, just the satisfying physics of the interface. The background is a soft, high-key office blur, suggesting a calm, stress-free work environment.
Psychological Impact & KPI Focus
This addresses the objection: "My team won't use this, it's too hard" (Framework ID: 1.11). By isolating the specific interaction of Drag-and-Drop, we lower the barrier to entry. It visually communicates Ease of Use and Staff Efficiency. The psychological reward is "competence"—assuring the buyer that their dispatchers will master this tool in minutes, not months, directly impacting Time-to-Value metrics.
Strategic Implementation & Trade-offs
- Optimal Use Case: Website product pages, landing pages, and "Features" sections.
- Trade-offs: It risks looking generic if the UI design itself isn't top-tier. It doesn't show the "power" of the backend, only the "ease" of the frontend.
- Duration: 30-60 seconds (16:9 aspect ratio), moving at a pace that allows the viewer to read the labels.
Companies using similar video content -
Routific – Route Optimization – Demonstrates effortless drag-and-drop route planning.
OptimoRoute – Route Planner – Shows intuitive workflow for overcoming planning complexity.
Onfleet – Delivery Management – Highlights frictionless dispatch and delivery management.
15. The "Neural Enterprise" Approach
MOFU | ABM Awareness

The Visual & Narrative Approach
How do you visualize an algorithm? This style treats data as a biological entity. In a stark white laboratory void, a complex cluster of "Neon Pink" and "Deep Purple" nodes pulsates with energy. Filaments extend outward, connecting to smaller nodes in a vast network. The camera utilizes a macro lens with a shallow depth of field, making the data feel microscopic and precious. The motion is rhythmic and calculating, representing the "brain" of your logistics network thinking in real-time.
Psychological Impact & KPI Focus
This is pure Account-Based Marketing (ABM) fuel (Framework ID: 2.2). It targets the Enterprise buyer who is looking for "Intelligence" and "Network Density." It elevates the conversation from "moving trucks" to "optimizing ecosystems." The visual metaphor emphasizes Connectivity and Algorithmic Optimization, appealing to the desire for a centralized, intelligent control tower that creates value through network effects.
Strategic Implementation & Trade-offs
- Optimal Use Case: Programmatic display ads and headers for whitepapers targeting high-value enterprise accounts.
- Trade-offs: It is completely abstract. It tells you nothing about what the software does, only what it is (smart). It must be paired with clear copy.
- Duration: 10-15 seconds (16:9 aspect ratio) as a background loop.
Companies using similar video content -
Noodle.ai – Enterprise AI – Visualizes intelligent, pulsing networks for supply chain.
C3.ai – Supply Chain Suite – Depicts complex algorithmic optimization and connectivity.
Optym – Logistics Optimization – Shows abstract neural networks driving logistics intelligence.
16. The "Adaptive Flow" Approach
MOFU | Website Visitor Re-engagement

The Visual & Narrative Approach
Sometimes, the goal is simply to remain top-of-mind. This style utilizes mesmerizing, fluid motion. Shapes in "Sunrise Orange" and "Magenta" morph and loop continuously against a "Deep Blue" void. They twist like a Möbius strip, never breaking, never stopping. The aesthetic is modern, glossy, and hypnotic. There is no text, no trucks, just the feeling of smooth, uninterrupted movement.
Psychological Impact & KPI Focus
Designed for Website Visitor Re-engagement (Framework ID: 5.1), this style is a "visual earworm." It subtly reinforces the concept of Business Continuity and Agility. The fluid nature of the graphics suggests that your service adapts to changes without breaking—a subliminal promise of resilience in a volatile supply chain. It creates a feeling of "premium reliability" for prospects who have already visited your site.
Strategic Implementation & Trade-offs
- Optimal Use Case: Google Display Network (GDN) banner ads and social retargeting.
- Trade-offs: Zero informational value. It is purely a branding play to maintain mental availability during long sales cycles.
- Duration: 5-10 second perfect loops (1:1 aspect ratio).
Companies using similar video content -
project44 – Movement by project44 – Visualizes continuous, adaptive data flow.
FourKites – Visibility Platform – Depicts liquid loops of uninterrupted real-time tracking.
Shippeo – Real-Time Transportation Visibility – Shows mesmerizing, fluid motion for continuous service.
17. The "Executive Clarity" Approach
BOFU | The Economic Buyer
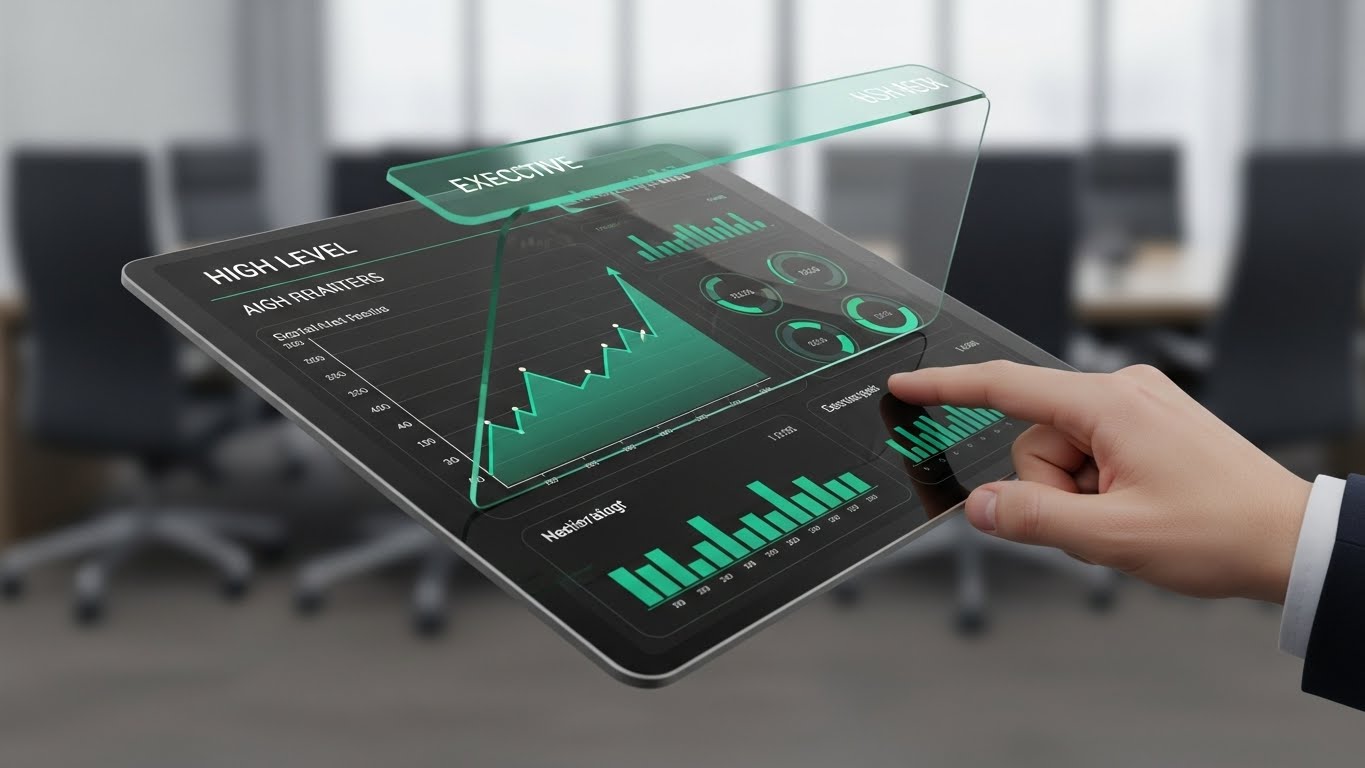
The Visual & Narrative Approach
We step into the boardroom. The view is over the shoulder of a decision-maker looking at a floating, holographic glass tablet. The UI is rendered with "Glassmorphism"—translucent, layered, and premium. The sharp focus is on an "Emerald Green" trend line shooting upward and crisp "Black" data widgets. The background is a blurred, high-end corporate environment. The parallax effect as the camera moves adds depth, making the data feel tangible and weighty.
Psychological Impact & KPI Focus
This targets The Economic Buyer (CFO/CEO) (Framework ID: 7.1). It strips away the operational details (trucks, routes) and focuses on the result: Financial Visibility and Profitability. The premium aesthetic signals that this is an enterprise-grade tool for serious governance. It validates the investment by visualizing the "Control" the executive will gain over their bottom line, directly addressing KPIs like Margin Analysis and ROI.
Strategic Implementation & Trade-offs
- Optimal Use Case: Pitch decks, investor presentations, and BOFU sales meetings.
- Trade-offs: It can look "too futuristic" for conservative companies. The data shown must be realistic dummy data, or credibility is lost.
- Duration: 30-45 seconds (16:9 aspect ratio).
Companies using similar video content -
SAP – Logistics Business Network – Validates financial control with glass dashboards.
Oracle – Transportation Management – Provides executive clarity on financial performance.
E2open – SCM – Focuses on high-level financial visibility and profitability.
18. The "Augmented Operator" Approach
BOFU | The Functional Buyer

The Visual & Narrative Approach
This style defends the human element. We use high-quality live-action footage of a focused dispatcher in a dim control room. But we augment reality: glowing 2D icons of trucks, route maps, and "Warm Amber" checkmarks float around them, interacting with their workspace. The graphics don't obscure the person; they surround them like a suit of armor. The visual narrative says: "The software doesn't replace you; it gives you superpowers."
Psychological Impact & KPI Focus
This speaks to The Functional Buyer (VP/Director of Ops) (Framework ID: 7.2) who is worried about change management and staff pushback. It visually reframes the software as an Enabler, not a replacement. By showing the harmonious existence of human judgment and digital data, it supports KPIs related to Employee Retention and Productivity per Head, assuring the buyer that their team will be faster and happier.
Strategic Implementation & Trade-offs
- Optimal Use Case: Case study videos and "Day in the Life" features.
- Trade-offs: Requires a video shoot or very specific stock footage. If the icons track poorly to the footage, it looks cheap.
- Duration: 60-90 seconds (16:9 aspect ratio) to tell a mini-story.
Companies using similar video content -
DispatchTrack – Delivery Management – Empowers dispatchers with glowing, overlaid icons.
Bringg – Delivery Orchestration – Shows live action augmented with digital control elements.
Tookan – Delivery Management – Visualizes operators gaining superpowers from software.
19. The "Infrastructure Insight" Approach
BOFU | The Technical Buyer

The Visual & Narrative Approach
To the naked eye, it's just a shipping container. But this style uses an "X-Ray Blue" shader to make the steel walls semi-transparent. Inside, instead of pallets of goods, we see a glowing infrastructure of "Bone White" server racks and fiber optic cables. The message is stark: Modern freight is data. The camera orbits the container, showing the complexity of the digital network that resides within the physical shell.
Psychological Impact & KPI Focus
Targeting The Technical Buyer (CIO/IT) (Framework ID: 7.3), this style visualizes the Data Architecture and Integration Capabilities of the platform. It assures the IT director that the "plumbing" is robust. It bridges the physical/digital divide in the most literal sense, suggesting that the value of the cargo is inseparable from the data that manages it. It speaks to Security, Uptime, and Architecture Stability.
Strategic Implementation & Trade-offs
- Optimal Use Case: Technical landing pages, API documentation headers, and IT-focused sales collateral.
- Trade-offs: It is a strong metaphor that might confuse non-technical buyers ("Do you ship servers?"). Use carefully with context.
- Duration: 15-20 seconds (16:9 aspect ratio).
Companies using similar video content -
ORBCOMM – IoT Solutions – Reveals data infrastructure within physical assets.
Sensata Technologies – IoT Solutions – Shows X-ray views of embedded vehicle technology.
Tive – Solo 5G Tracker – Highlights the digital network residing within physical shipments.
20. The "Revenue Engine" Approach
BOFU | ROI Justification
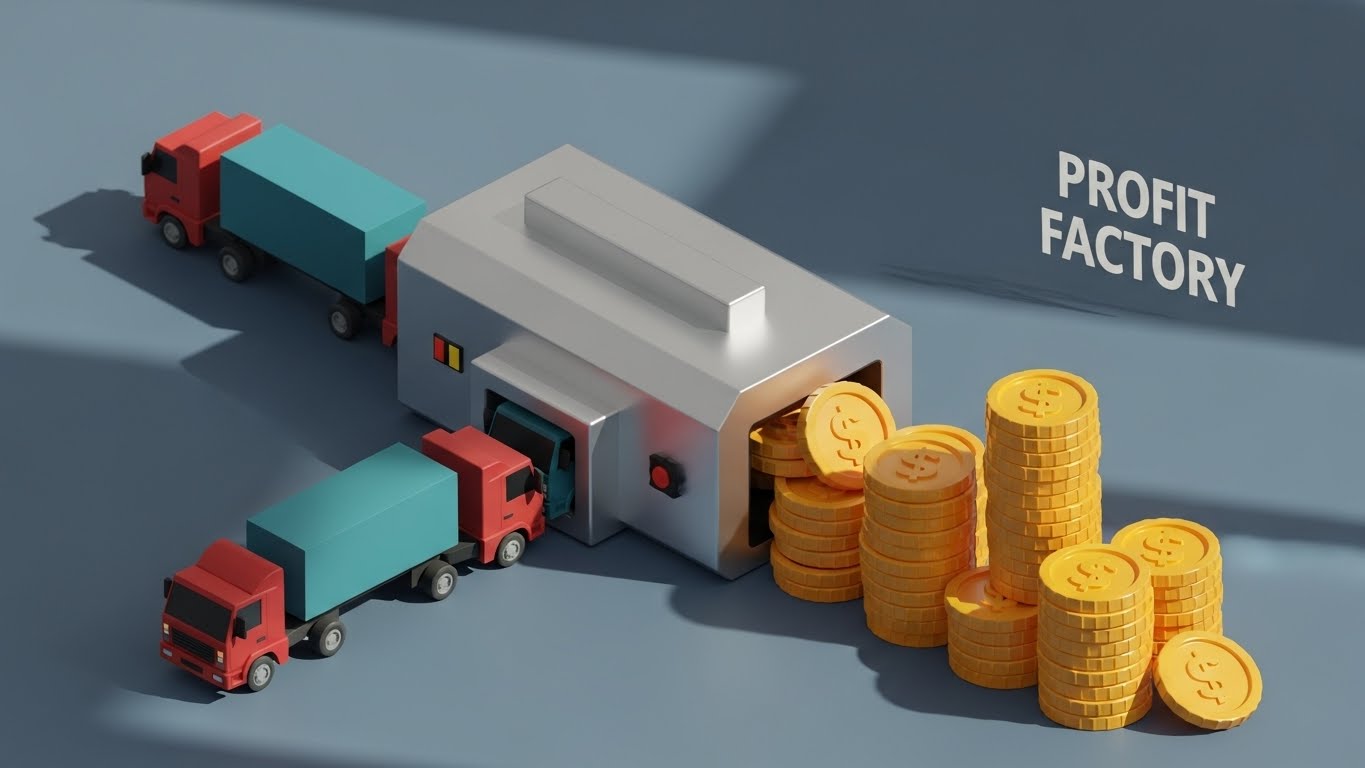
The Visual & Narrative Approach
The ultimate closing argument is profit. We return to the clean isometric studio. A line of miniature red and blue trucks enters a sleek, "Silver" processing machine (representing your software). As they pass through, they don't just exit as trucks—they pour out of the other side as stacks of realistic "Gold" coins. The lighting is premium, highlighting the ridges on the coins. It is a literal "Profit Factory."
Psychological Impact & KPI Focus
This is the ROI Justification (Framework ID: 1.10). At the end of the funnel, the decision is financial. This style removes all ambiguity about value. It visually connects Operational Throughput directly to Revenue Generation. It serves as a visual anchor for the "Closing" phase, reminding the stakeholder that purchasing this software is not a cost, but a machine that mints money through efficiency.
Strategic Implementation & Trade-offs
- Optimal Use Case: The final slide of a sales deck, the cover of an ROI whitepaper, or a retargeting ad for stalled deals.
- Trade-offs: It is transactional and blunt. It lacks emotional nuance, but at the deal-closing stage, nuance is often less important than clarity.
- Duration: 10-15 seconds (16:9 aspect ratio).
Companies using similar video content -
Blue Yonder – Luminate Platform – Tangibilizes operational throughput into financial ROI.
Manhattan Associates – Active Omni – Visualizes efficiency transforming into revenue generation.
SAP – Digital Supply Chain – Depicts logistics processes as a profit factory.
21. The "Cyber-Guardian" Approach
BOFU | Risk Mitigation

The Visual & Narrative Approach
Security is the invisible foundation of the digital supply chain. This style adopts a "Cyber-Noir" aesthetic, popular in high-security command centers. In the center of a deep, void-like background, a 3D translucent shield glows in "Neon Cyan." Behind it, a chaotic storm of data particles (representing threats) attempts to penetrate but is deflected effortlessly. A padlock icon integrates seamlessly into the shield's geometry. Subtle "Matrix-style" rain textures fall in the background, creating depth. The vibe is one of impenetrable safety and vigilance.
Psychological Impact & KPI Focus
This appeals to the Risk-Averse Decision Maker (Framework ID: 1.12 Risk Mitigation) at the Bottom of the Funnel (BOFU). As logistics digitizes, the fear of ransomware and data breaches grows. This visual metaphor calms that anxiety by making security visible and tangible. It signals Cybersecurity Posture and Data Integrity, assuring the buyer that their proprietary route data and customer lists are behind a fortress. It shifts the conversation from "software features" to "corporate governance."
Strategic Implementation & Trade-offs
- Optimal Use Case: Security compliance pages, trust centers, and final-stage sales decks where IT vetting is the hurdle.
- Trade-offs: The dark, moody aesthetic can feel "ominous" if not balanced with bright, reassuring accent colors. It is specific to security and shouldn't be used for general operational flows.
- Duration: 10-15 seconds (16:9 aspect ratio), slow and pulsing to convey stability.
Companies using similar video content -
CyberLogitec – Terminal Operating System – Mitigates data risk with futuristic glowing shields.
Navis – N4 – Visualizes impenetrable security for critical port infrastructure.
Tideworks Technology – Mainsail – Depicts robust data protection for terminal operations.
22. The "Partnership Prime" Approach
BOFU | Sales Cycle Acceleration

The Visual & Narrative Approach
At the final decision stage, people buy from people. This style utilizes advanced Generative AI to create a hyper-realistic "Partner Persona." We see a medium shot of a Logistics Director in a sharp "Navy" suit, standing in a modern, sunlit glass office. He looks directly into the lens with a warm, confident smile and extends his hand for a handshake. The lighting is soft and natural, emphasizing texture and humanity. This isn't a model; it's an avatar of your brand's reliability, offering a partnership, not just a product.
Psychological Impact & KPI Focus
This targets Sales Cycle Acceleration (Framework ID: 1.14). In a digital-first sales process, the human connection is often lost. This visual reintroduces it, building Brand Trust and Credibility. It triggers the psychological principle of "Reciprocity" and "Liking." By visualizing a successful, professional counterpart, it subconsciously reassures the buyer that they are entering a relationship with a peer who understands their business. The implied KPI is Conversion Rate from SQL to Closed Won.
Strategic Implementation & Trade-offs
- Optimal Use Case: Personalized video emails from sales reps, "Thank You" pages after a demo, and retargeting ads for stalled leads.
- Trade-offs: The "Uncanny Valley" effect is a risk. The AI generation must be top-tier, ensuring the movement and expression feel genuinely human, or it will damage trust.
- Duration: 10-20 seconds (16:9 aspect ratio).
Companies using similar video content -
Flexport – Platform – Accelerates sales trust with realistic professional handshakes.
Convoy – Digital Freight Network – Builds credibility through human connection and partnership.
Loadsmart – Digital Freight Platform – Emphasizes trust and collaboration in logistics.
23. The "Gamified Blueprint" Approach
Onboarding | Reducing Implementation Friction

The Visual & Narrative Approach
Implementation is often feared as a heavy lift. This style counters that by treating the logistics network like a playful video game. We use a "Low-Poly" 3D aesthetic—blocky, colorful, and charming. Miniature trucks in "Pastel Blue" and "Yellow" zip around a toy-like city grid. Cranes assemble buildings (representing account setup) with satisfying "pops" and "bounces." The lighting is bright and sunny, simulating a miniature set. It visualizes the complexity of logistics as something manageable, modular, and even fun to build.
Psychological Impact & KPI Focus
Designed for Onboarding (Framework ID: 1.16), this style lowers the Barrier to Entry. It addresses the "Implementation Anxiety" that new customers feel. By simplifying the visual fidelity, we simplify the perceived difficulty of the task. It reinforces Ease of Configuration and Modularity, encouraging the user to "play" with the settings rather than fear breaking them. It directly supports Time-to-First-Value by making the setup process inviting.
Strategic Implementation & Trade-offs
- Optimal Use Case: Welcome emails, setup wizards, and "Getting Started" guide covers.
- Trade-offs: It can feel "childish" if used for serious financial reporting. Reserve this style for configuration and setup phases where simplicity is the goal.
- Duration: 20-30 seconds (16:9 aspect ratio) of upbeat animation.
Companies using similar video content -
Odoo – Inventory – Reduces implementation friction with a playful, low-poly aesthetic.
ERPNext – Stock Management – Visualizes setup as building a modular toy city.
Traccar – GPS Tracking – Simplifies complex configuration with gamified elements.
24. The "Velocity Stream" Approach
Onboarding | Accelerating Time-to-Value

The Visual & Narrative Approach
Speed is the currency of logistics. This style uses the visual language of a long-exposure hyper-lapse. We see a highway at night, where traffic has blurred into continuous streams of "Red" (taillights) and "White" (headlights). Overlaid on this organic chaos is a rigid, precise grid of "Cyan" digital data lines and nodes. The camera rushes forward. The contrast between the blurred physical world and the sharp digital overlay conveys that while the world moves fast, your software captures it with precision.
Psychological Impact & KPI Focus
This is an Onboarding Momentum tool (Framework ID: 1.15). It validates the user's decision to buy, showing them the immediate "rush" of data they now possess. It visualizes Real-Time Visibility and High-Frequency Updates. The psychological hook is "Instant Gratification"—showing that as soon as the system is live, data starts flowing. This supports User Activation metrics, encouraging the new client to log in and watch the "lights" move.
Strategic Implementation & Trade-offs
- Optimal Use Case: "Your Account is Live" emails, loading screens, and hype reels for new feature releases.
- Trade-offs: It is a mood piece. It doesn't teach the user how to use the software, but why they should be excited about it.
- Duration: 10-15 seconds (16:9 aspect ratio), fast and energetic.
Companies using similar video content -
project44 – Movement by project44 – Accelerates time-to-value with hyper-lapse light trails.
FourKites – Dynamic ETA – Visualizes immediate data flow and high-frequency updates.
Tive – Real-Time Tracking – Shows the instant gratification of live data streams.
25. The "Friendly Navigator" Approach
Onboarding | Self-Serve Onboarding

The Visual & Narrative Approach
For training, clarity is king. This style employs a "Corporate Memphis" inspired flat vector aesthetic. A friendly, stylized character—dressed in "Turquoise" workwear—stands next to a large, floating map interface. The character points confidently to a route line that turns green upon interaction. The background is abstract and clean ("Peach" and "White"). The character acts as a surrogate for the user, demonstrating actions with exaggerated clarity. It is non-threatening, diverse, and universally understandable.
Psychological Impact & KPI Focus
This drives Self-Serve Onboarding (Framework ID: 2.4). It targets the user who prefers to learn by watching rather than reading manuals. The friendly character reduces the intimidation of complex UI, making the software feel approachable. It supports Product Adoption and Feature Mastery, reducing the need for live training sessions. The visual subtext is: "If this character can do it, so can you."
Strategic Implementation & Trade-offs
- Optimal Use Case: In-app tooltips, knowledge base articles, and "Walkthrough" videos.
- Trade-offs: If the character style is too generic, it can blend in with thousands of other SaaS tools. Customizing the character’s uniform to match the logistics domain is key.
- Duration: 30-60 seconds (16:9 aspect ratio), paced for comprehension.
Companies using similar video content -
Routific – Route Optimization – Facilitates self-serve adoption with a guided map character.
OptimoRoute – Route Planner – Uses friendly vector characters for onboarding guidance.
Onfleet – Delivery Management – Makes learning approachable with a clear, guided approach.
26. The "Precision Click" Approach
Retention | Reducing Support Overhead

The Visual & Narrative Approach
Sometimes, you need to focus on a single click. This style uses an extreme macro 3D render of the user interface. We are inches away from a "Macro Green" button labeled "Optimize." The texture is matte plastic; the lighting is soft studio quality. The background is a blur of dark grey UI elements. A cursor hovers, presses, and the button glows—triggering a ripple of light. It elevates a mundane UI interaction into a significant event.
Psychological Impact & KPI Focus
Used for Retention & Support (Framework ID: 1.18), this style clarifies specific, high-value actions. It reduces Support Ticket Volume by showing users exactly what to click and what happens when they do. It validates the Power of Automation, visually suggesting that a single click unleashes massive computational power. It creates a "Pavlovian" response: Click Green, Get Results.
Strategic Implementation & Trade-offs
- Optimal Use Case: Feature release notes, "Pro Tip" social snippets, and help center headers.
- Trade-offs: It provides zero context about the wider workflow. It is a micro-view that must be part of a larger educational strategy.
- Duration: 5-8 seconds (16:9 aspect ratio), looped.
Companies using similar video content -
MercuryGate – TMS – Highlights the 'Optimize' click, reducing support overhead.
3Gtms – 3G-TM – Elevates a single UI interaction into a significant event.
Alpega TMS – TMS – Focuses on specific, high-value actions within the interface.
27. The "Team Victory" Approach
Retention | Reducing Churn

The Visual & Narrative Approach
Software buys are rational; renewals are emotional. This style focuses on the human outcome of efficiency. We use high-quality stock photography of a diverse logistics team celebrating in a glass-walled conference room—a high-five moment. Overlaid on this human connection is a delicate, glowing "Corporate Blue" network mesh that connects the people. The message is clear: The software connects the data so the team can connect with each other.
Psychological Impact & KPI Focus
This targets Churn Reduction (Framework ID: 1.19). It reminds the stakeholder that the software isn't just a tool; it's a team member that facilitates success. It visualizes Organizational Alignment and Morale. By associating the software with happy, successful people, you build an emotional moat against competitors. It reinforces the idea that your platform enables a "Winning Culture."
Strategic Implementation & Trade-offs
- Optimal Use Case: Quarterly Business Review (QBR) decks, renewal email campaigns, and case study headers.
- Trade-offs: Requires authentic-looking stock. "Cheesy" corporate stock will have the opposite effect, creating cynicism.
- Duration: Static images or 10-second subtle motion cinemagraphs (16:9 aspect ratio).
Companies using similar video content -
J.B. Hunt – 360box – Visualizes shared success with team high-fives.
Ryder – RyderShare – Depicts organizational alignment and morale through collaboration.
C.H. Robinson – Navisphere – Shows teams celebrating efficiency and operational wins.
28. The "Code Command" Approach
Retention | Driving Deep Feature Adoption
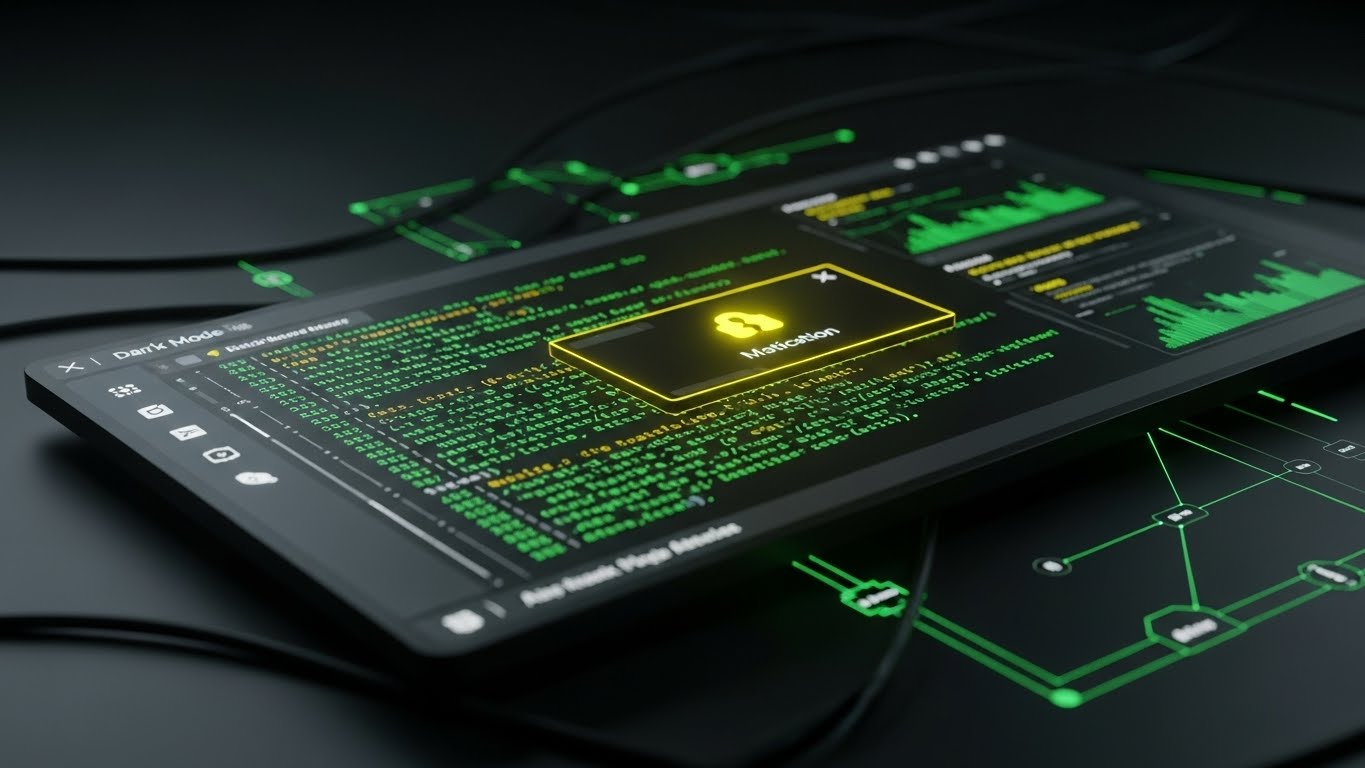
The Visual & Narrative Approach
For the power user, complexity is a feature, not a bug. This style leans into the "Hacker" aesthetic. We see a specialized Dark Mode interface with scrolling lines of command-line code in "Matrix Green" against "Dark Grey." A central notification box glows with a system alert. The camera angle is sharp and angled, suggesting a developer's workstation. It looks technical, robust, and "under the hood."
Psychological Impact & KPI Focus
This is for Deep Feature Adoption (Framework ID: 1.17). It targets the "Super User" or IT Administrator who wants to feel powerful and in control of the raw data. It validates the system's Extensibility and API Robustness. It says: "This isn't just a pretty interface; it's a powerful engine." This drives stickiness by engaging the technical gatekeepers who often influence renewal decisions.
Strategic Implementation & Trade-offs
- Optimal Use Case: Developer documentation, API feature announcements, and advanced training modules.
- Trade-offs: It will alienate the non-technical user (e.g., the billing clerk) who finds code intimidating. Use strictly for technical audiences.
- Duration: 15-20 seconds (16:9 aspect ratio).
Companies using similar video content -
Apache OFBiz – Supply Chain Management – Engages power users with matrix code UI.
Coupa – Supply Chain Design – Appeals to technical users with dark mode and code.
Kinaxis – RapidResponse – Highlights system extensibility and API robustness.
29. The "Global Hologram" Approach
Expansion | Driving Upsell/Cross-sell

The Visual & Narrative Approach
Expansion requires seeing the bigger picture. This style uses a Sci-Fi inspired visual of a holographic globe projecting upward from a tabletop surface in "Holographic Blue." Complex data widgets and trade routes float in 3D space around the globe. The background is a clean, bright white studio, keeping the tone optimistic. The hologram rotates, showing the interconnectivity of a global supply chain. It looks expensive, advanced, and exclusive.
Psychological Impact & KPI Focus
This is an Upsell/Cross-sell tool (Framework ID: 1.20). It visualizes the "Next Tier" of service—Global Visibility. It appeals to the customer's ambition to grow from a regional player to a global powerhouse. It visualizes Scale and Strategic Dominance. The premium aesthetic justifies a higher price point, suggesting that upgrading unlocks a "God Mode" view of their operations.
Strategic Implementation & Trade-offs
- Optimal Use Case: "Enterprise Tier" landing pages, upsell email campaigns, and executive summit presentations.
- Trade-offs: It promises a level of sophistication that the actual product must deliver. Don't use this if your reporting tools are basic 2D tables.
- Duration: 20-30 seconds (16:9 aspect ratio).
Companies using similar video content -
One Network Enterprises – Real Time Value Network – Drives upsell value with projected global views.
E2open – Global Trade Management – Visualizes strategic dominance through holographic data.
Descartes – Global Logistics Network – Depicts expanded global capabilities with advanced holograms.
30. The "Ecosystem Multiplier" Approach
Expansion | Driving Referrals & Advocacy

The Visual & Narrative Approach
Growth comes from sharing. This style is whimsical and light. A small, stylized vector truck drives along a white path. As it moves, the path branches out into a network of connected nodes/dots in "Orange" and "Blue." Each node represents a partner or a referral. The network grows organically, filling the screen with a web of connections. The style is flat, clean, and cheerful. It visualizes the ecosystem growing stronger with every new connection.
Psychological Impact & KPI Focus
This targets Referrals & Advocacy (Framework ID: 1.21). It visualizes the concept of the Network Effect—that the platform becomes more valuable as more shippers and carriers join. It encourages the user to invite others, visually demonstrating that "we are better together." It supports Viral Growth and Ecosystem Expansion, turning users into advocates.
Strategic Implementation & Trade-offs
- Optimal Use Case: "Invite a Partner" screens, referral program emails, and social media community posts.
- Trade-offs: The abstract nature means it doesn't sell specific features. It sells the community.
- Duration: 10-15 seconds (1:1 aspect ratio) for social sharing.
The Visual Operations Doctrine: 3-Segment Strategic Knowledge Base
We have analyzed 30 distinct visual styles, ranging from the abstract representation of network fluidity to the hyper-specific macro-view of a UI button. However, a library of styles is not a strategy. To truly leverage these assets, you must orchestrate them into a cohesive "Visual Operating System" that aligns with your business goals.
This final section synthesizes the insights from all 30 styles into three actionable strategic frameworks. These are your implementation blueprints.
STRATEGIC ALIGNMENT & VISUAL ARCHITECTURE
The "Pre-Production" Strategy. Why and Who.
Before a single pixel is rendered, the visual architecture must be defined. In the logistics SaaS sector, the primary failure mode is not a lack of content, but a lack of coherence.
- The Cognitive Load Audit: Logistics professionals operate under high stress. Before designing, conduct an audit of your current user journey. Identify "High-Friction Zones" (e.g., complex load planning screens). These zones require High-Clarity Styles (Style 2, Style 14) to reduce cognitive load. Do not use abstract motion graphics here; use simplified UI schemas.
- Role-Based Visual Mapping: A "One-Style-Fits-All" approach fails in logistics.
- For Drivers: Use Mobile-First, High-Contrast Styles (Style 5, Style 18). They consume content on phones in cabs. Visuals must be "glanceable" and large-format.
- For Executives: Use Abstract, Data-Rich Styles (Style 7, Style 17). They consume content on desktop monitors and boardrooms. Visuals must convey scale and financial control.
- The "Glanceability" Standard: In a dispatch room, a user has milliseconds to process an image. Your visuals must pass the "Squint Test." If you squint at the image (Style 4, Style 25), is the primary message (e.g., "Route Blocked" or "Profit Up") still decipherable? If not, the visual is too complex for operational use.
- Brand Voice Consistency: Your marketing visuals (Style 1) and your in-app support visuals (Style 26) must speak the same language. If marketing is "Cyberpunk Neon" and the product is "Beige Spreadsheet," you create a Trust Gap. Establish a unified color palette and icon set that traverses the entire funnel.
- The Advids Strategic Audit: This is where a partner like Advids adds value beyond production. By auditing your entire visual funnel, we identify where style inconsistencies are leaking trust. We help define a "Visual Operating System" that ensures your sales deck talks to your product interface.
- Standardization vs. Customization: For generic concepts (e.g., "Global Trade"), use high-end Stock/GenAI (Style 7) to save budget. For proprietary differentiators (e.g., "Your Algorithm"), you must use Bespoke Motion Graphics (Style 11). Never use stock footage to explain your core IP.
- The Cross-Departmental Bridge: Sales sells "The Future" (Style 3); Ops delivers "The Now" (Style 14). Use visuals to bridge this gap. Create assets that show the transition from the sales promise to the operational reality (Style 12), aligning expectations between departments.
- Legacy System Integration: Most clients are migrating from legacy systems. Visually acknowledge this. Use "Transformation" styles (Style 10, Style 13) that show the old world evolving into the new, rather than simply erasing the past. This respects the user's history while selling their future.
- Accessibility in Trucking: The logistics workforce is diverse and often multi-lingual. Visuals must transcend language. Use Pantomime Styles (Style 25) and icon-driven narratives where the visual action explains the concept without reliance on voiceover or text.
- The Mobile-First Mandate: 60% of logistics coordination happens on mobile. All 30 styles must be legible on a vertical 9:16 screen. If a chart (Style 9) is unreadable on an iPhone, it is useless for the field.
OPERATIONAL ADOPTION & IMPLEMENTATION
The "Deployment" Phase. How to embed visuals into the workflow.
The best software in the world is worthless if no one uses it. Visuals are the lubricant for adoption.
- Overcoming "Big Brother" Anxiety: Driver monitoring and AI cameras create fear. Use Empathy-Driven Visuals (Style 18) that show technology protecting the driver (e.g., preventing accidents) rather than policing them. Visual framing matters: show the AI as a co-pilot, not a warden.
- The Micro-Learning Shift: Nobody reads the PDF manual. Replace 50-page docs with a library of 30-second Micro-Clips (Style 26). Embed these directly into the software's "Help" tooltips. "How to Optimize a Load" should be a 15-second loop, not a webinar.
- Just-in-Time Support: Context is everything. Trigger specific visual guides based on user behavior. If a user hovers over a "Customs Declaration" field for too long, auto-play a Line Art Animation (Style 2) explaining the custody chain.
- Gamification of Training: Trucking has a competitive culture. Use Low-Poly/Game Styles (Style 23) to visualize driver scorecards and safety bonuses. Turn "compliance" into a "high score" visualization to boost engagement.
- Reducing Support Ticket Volume: There is a direct correlation between the quality of your visual documentation and your support costs. Proactive, high-clarity UI Montages (Style 6) that answer common questions before they are asked can reduce ticket volume by 30%.
- Remote Onboarding: With distributed fleets, you can't fly trainers to every terminal. Leverage Screencasts and Character Stories (Style 25) to standardize training across locations. This ensures every dispatcher, from Texas to Tokyo, receives the exact same visual instruction.
- Standard Operating Procedures (SOPs): Text-based SOPs are ambiguous. Transform them into Process Flow Visuals (Style 11). A visual animation of "The Correct Docking Procedure" eliminates interpretation errors and becomes the irrefutable standard.
- Feedback Loops: Use interactive video elements. At the end of an onboarding video (Style 24), include a clickable "Thumbs Up/Down." This data helps you refine the training assets continuously.
- Scalable Localization: Global fleets need global assets. By relying on Abstract Motion (Style 1) and Iconography (Style 4) rather than on-screen text, you reduce the cost of translating assets for different regions.
- Leadership Communication: When the CEO announces a strategic shift, do not send an email. Use a "Future of Freight" cinematic video (Style 3) to create an emotional anchor for the change strategy.
MEASURING IMPACT & FUTURE-PROOFING
The "ROI" Phase. Measuring success and looking ahead.
Visuals are an investment. You must measure their return and prepare for the next wave of technology.
- Beyond "Views" - Actionable KPIs: Measure Time-to-Competency. How much faster does a dispatcher master the board after watching the "Logic of Motion" video (Style 11) compared to the old training method? This delta is your ROI.
- The "Idle Time" Metric: In software, "idle time" (time spent staring at the screen confused) is waste. Correlate the deployment of Clarity Styles (Style 2) with a reduction in the average time spent on configuration screens. Speed is efficiency.
- Compliance Velocity: When a new regulation (like ELD mandates) hits, how fast can you get the fleet compliant? Measure the speed of adoption for cohorts trained with Video Explainers (Style 12) vs. text manuals.
- Retention and Churn: High-quality UX visualization acts as a retention anchor. Clients who perceive the product as "Modern" and "High-Tech" (driven by Dark Mode/Holographic Styles 28 & 29) are less likely to churn to a competitor.
- The AI Visual Frontier: Prepare for Generative UI. Soon, interfaces will build themselves. Your visual style guide must be robust enough to feed these AI models. A strong Design System (Style 4) today prepares you for the AI of tomorrow.
- Scalability of Assets: Build a library, not a landfill. Organize your visual assets (Style 1-30) by "Component" (e.g., Truck, Map, Cloud). This allows you to remix and update videos without reshooting, drastically lowering the cost of maintaining your content.
- The Advids Partnership: Scale is the enemy of quality. As your feature set grows, maintaining visual consistency becomes impossible for internal teams. Advids acts as the external "Visual Guardian," ensuring that your 100th explainer video looks just as premium as your first brand anthem.
- Benchmarking Success: "Good enough" is a competitive risk. If your competitor uses 3D Cinematic Renders (Style 3) and you use static screenshots, you lose the perception war. Regularly audit your visual standard against the top 10% of the market.
- The ROI of Safety: For fleet management, safety is the ultimate ROI. Quantify the reduction in accident rates for drivers trained with Simulation-Style Visuals (Style 11). Lower accident rates mean lower insurance premiums—a direct hard-dollar return.
- Final Call to Innovation: Treat video not as "marketing content," but as Digital Infrastructure. Just as you invest in servers and code, invest in the visual layer that translates that code for the human brain. In the Digital Nervous System of trade, clarity is the ultimate competitive advantage.
Companies using similar video content -
Flexport – Platform – Drives referrals by visualizing branching network paths.
Convoy – Digital Freight Network – Shows ecosystem growth with connected nodes.
Loadsmart – Digital Freight Platform – Encourages advocacy by depicting a growing network.
Author & Editor Bio


