
Sisense · Embedded analytics SDK · 2D motion graphics video
App Preview Video for Sisense Compose SDK: Analytics Inside Your App
Sisense needed developers to see that analytics built with the Compose SDK look like part of their own app, not a bolted-on dashboard. This app preview video never shows a Sisense screen: it puts the charts inside 2 example apps, a shoe store and a finance tool, then shows the code and the frameworks behind them in 50 seconds.
Last updated
Sisense · Compose SDK
- Client
- Sisense
- Product
- Sisense Compose SDK for embedding analytics in apps
- Made for
- Developers and product teams adding analytics to their own apps
- Format
- 2D motion graphics video with animated UI
- Style
- Isometric app screens in teal, lime and navy
- Length
- 0:50
- Production timeline
- 3 to 4 weeks
- Budget
- $1,200 to $2,000
The problem: embedded analytics that look bolted on
Sisense opens its own YouTube description with the buyer's doubt: "Struggling to embed analytics that feel like part of your app?" A developer choosing an SDK has seen plenty of embedded charts that sit in an iframe with someone else's fonts and colors.
A tour of Sisense's own interface would not answer that doubt, because the buyer never ships Sisense's interface. The video had to show the charts living inside apps that belong to someone else, then show the code a developer would write to get there.
How the video shows the SDK inside other apps, scene by scene
There are no headline titles: the UI labels and the code carry the message. Select a time to play that scene above.
| Time | On screen | What it does |
|---|---|---|
| Scattered dots gather into the Sisense mark on a white screen. | Names the brand once, then gets out of the way. | |
| An example store, "Pulse Athletics", shows the "Blueblast 200 Women's athletic shoe". A "Weekly sales" chart opens on the product page with an "Increase ad spend" button, then a tooltip reads "Tuesday" and "Revenue: $29,872.46" and the button becomes "Increase by 20%". | Shows analytics inside a customer's app, ending on an action. | |
| A second app, "Finvest", tilts in with a world map, a donut chart, a scatter plot and a line chart. | Proves the same SDK fits a different industry and layout. | |
| TypeScript, Angular, Vue and React logos rise on discs, with chart pieces floating above them. | Answers which frameworks the SDK works with, without a word. | |
| A code editor types out a React component that imports from "@sisense/sdk-ui" and "@sisense/sdk-data" and labels a chart "Top 10 Categories by Revenue". A flow chart then draws above the code. | Shows a developer the real syntax behind each chart. | |
| Isometric dashboards build chart by chart, then the Finvest "Portfolio analysis" screen fills with 8 chart cards and one lifts out. | Shows how far each view can be customized. | |
| A board with "Backlog", "To do", "In progress" and "Done" columns, with cards moving across. | Places analytics inside the buyer's own workflow tools. | |
| A dashboard with a gauge, then one card darkens under a padlock at 0:42. The video closes on the Sisense logo. | Covers the security question before the logo. |
Storyboard: the frames that carry the Sisense app preview video
Key frames from the finished video, in order. Select a time to play that moment above.
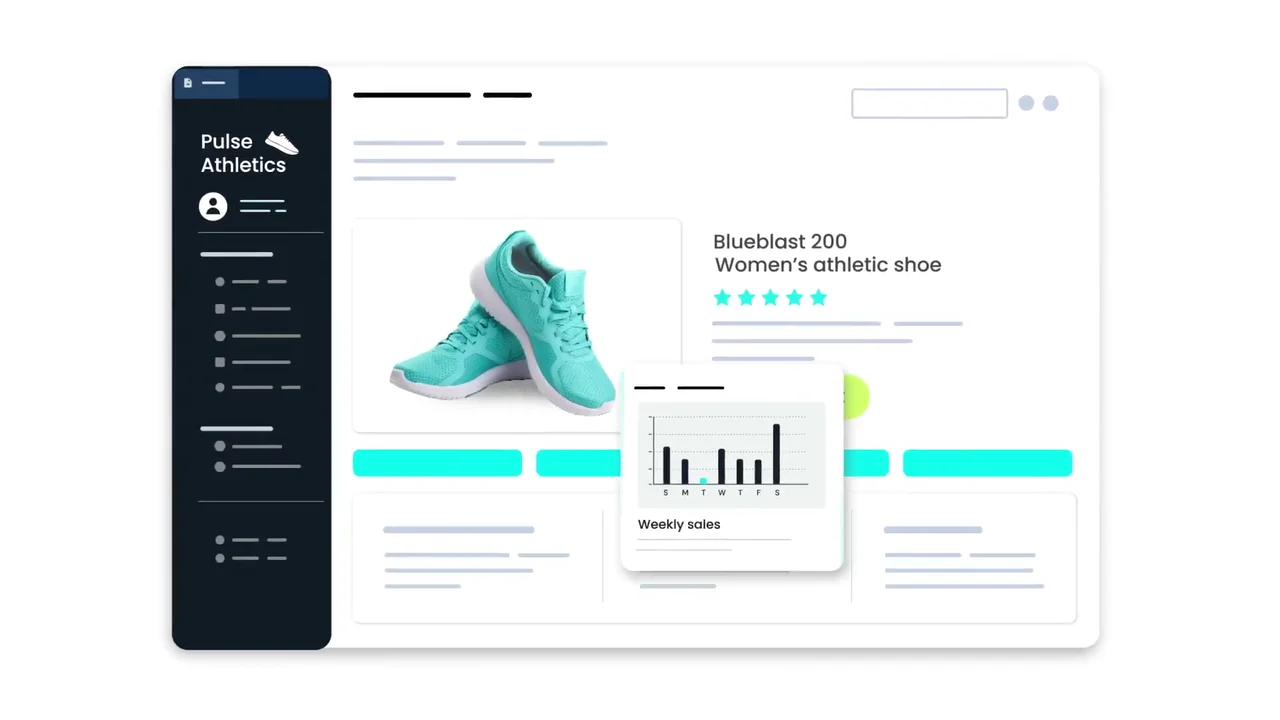
The SDK's first appearance is inside someone else's store, not a Sisense screen. 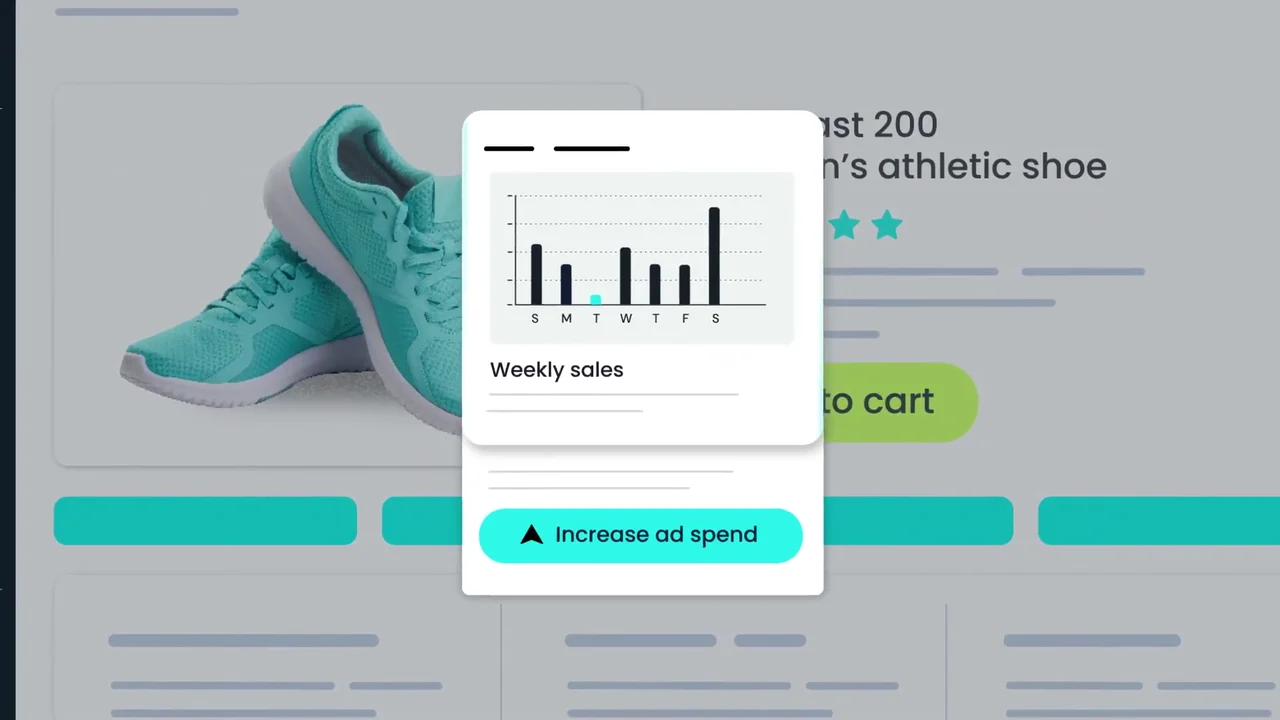
The chart comes with a next step: "Increase ad spend". 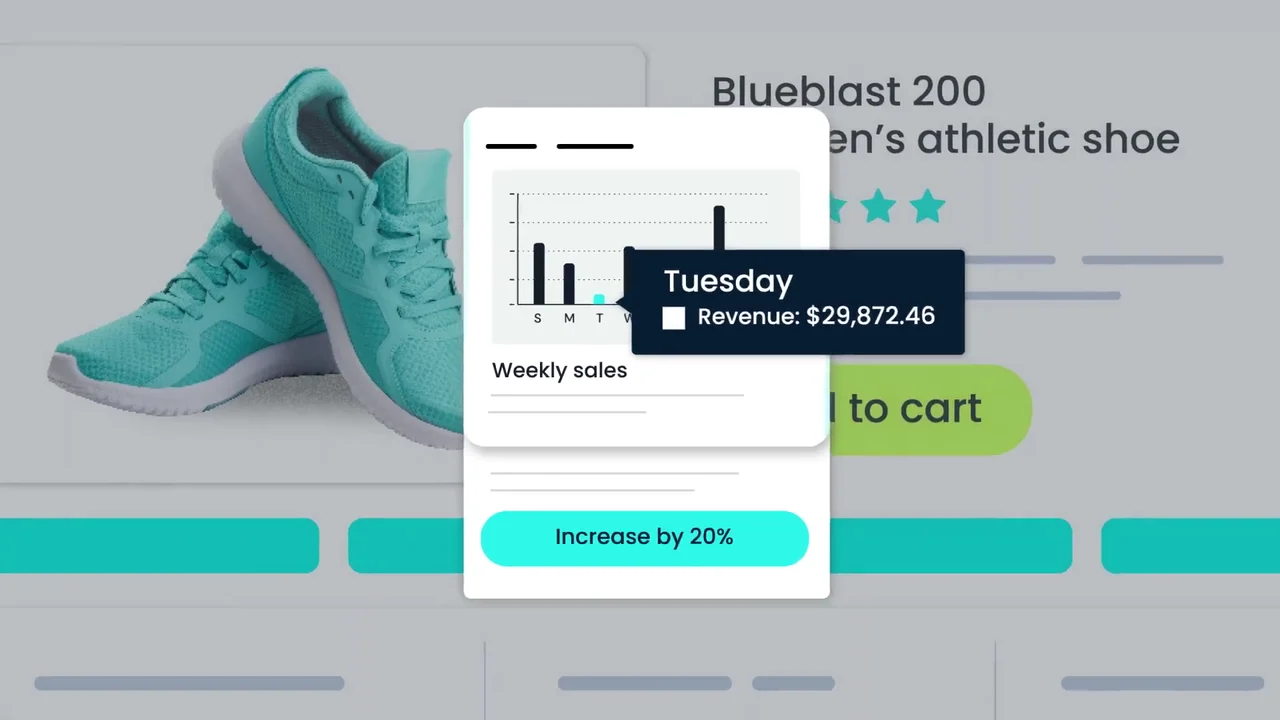
Hover data and a concrete action: "Increase by 20%". 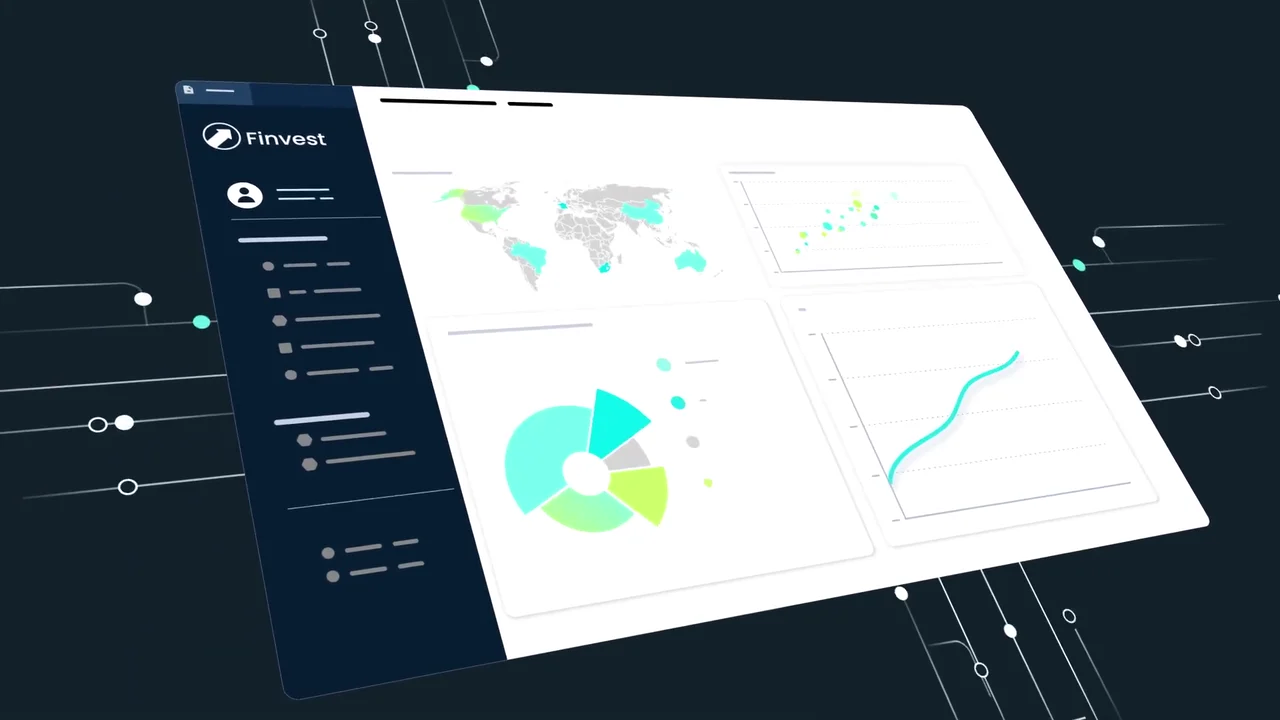
A second industry: the same charts inside a finance app. 
Framework fit, answered with 4 logos. 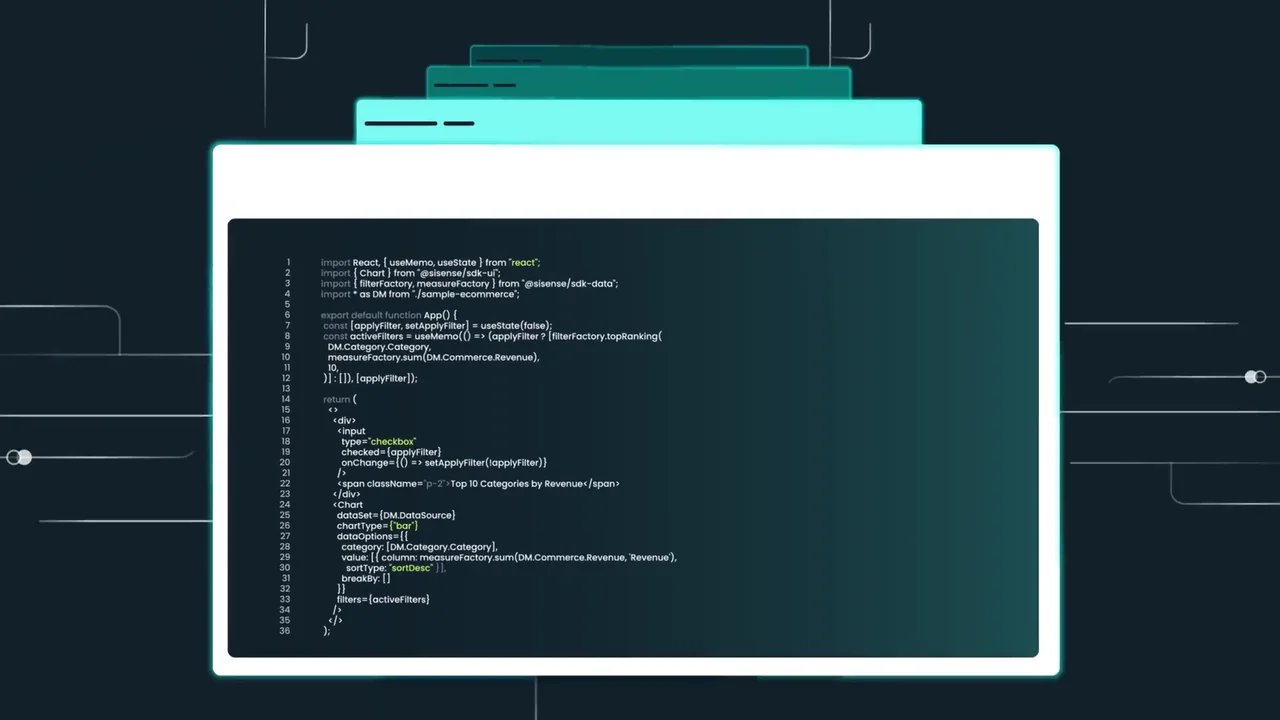
Real code for a developer buyer: imports from "@sisense/sdk-ui". 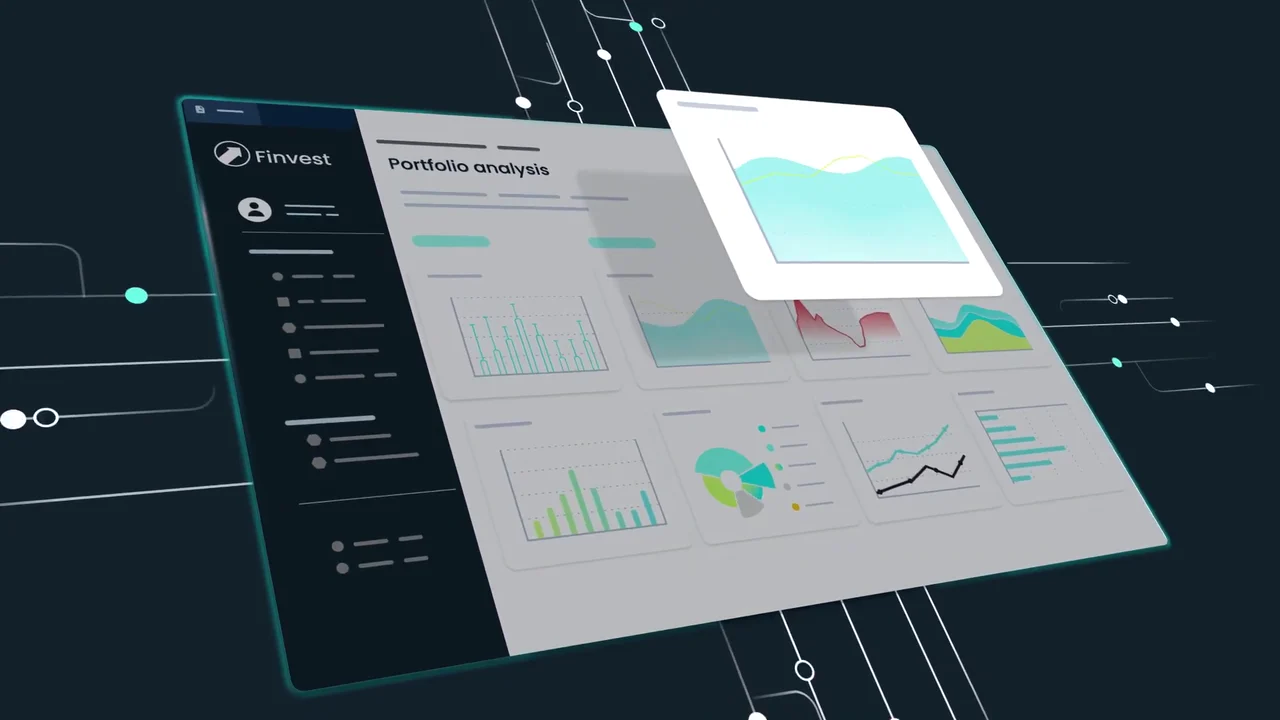
A full "Portfolio analysis" view built from 8 chart cards. 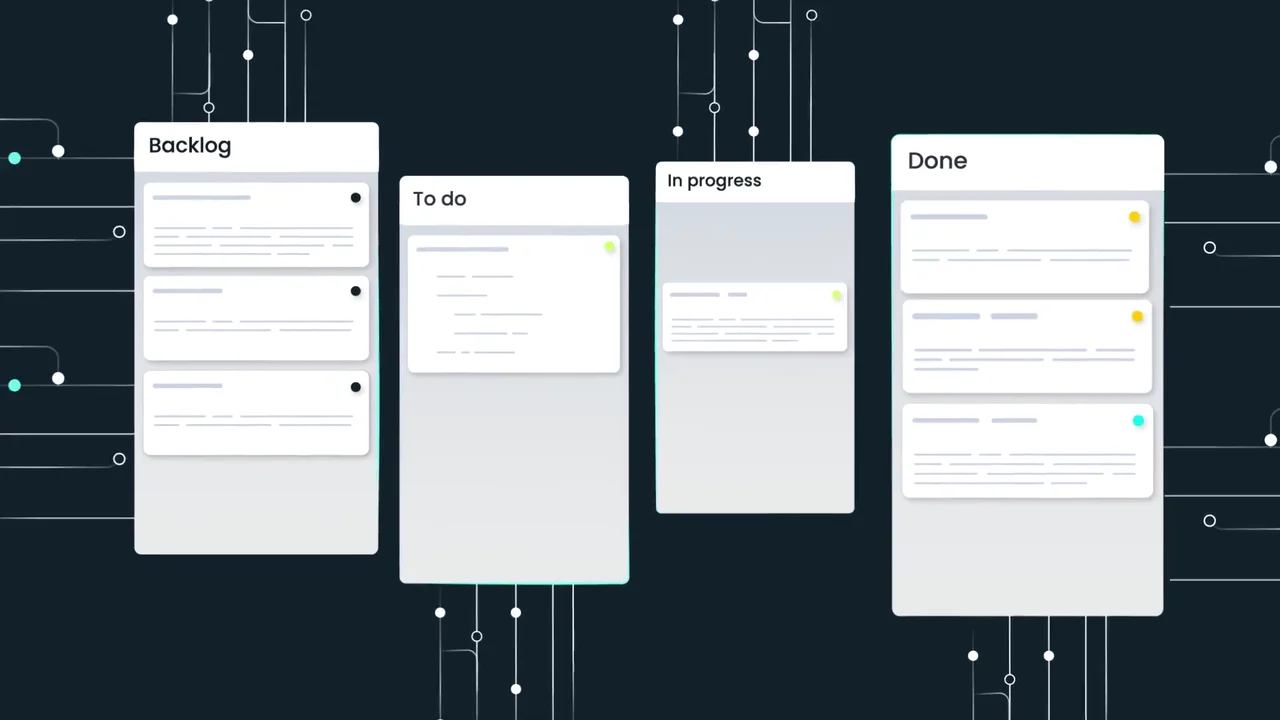
Analytics placed inside a task board the buyer already uses. 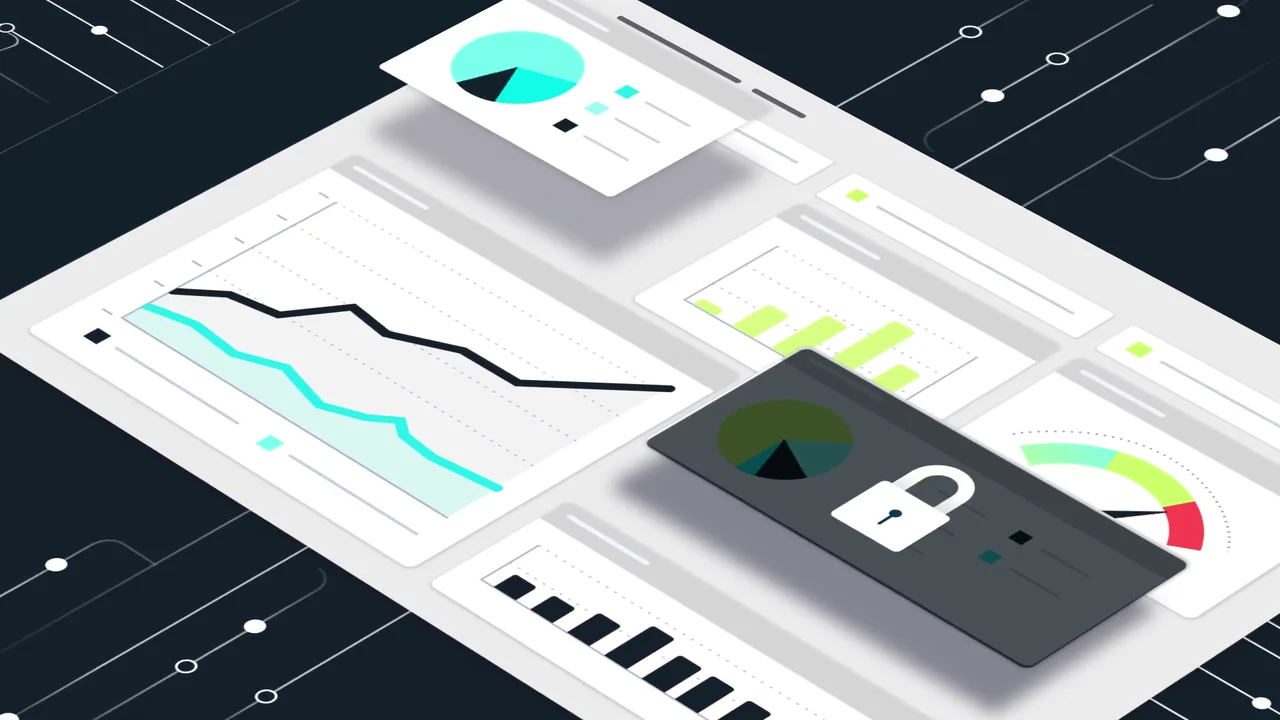
The security point: one chart card locks under a padlock.
4 decisions behind the Sisense Compose SDK video
Decision 1
Show the customer's app, never your own
From 0:06 the charts sit inside "Pulse Athletics" and then "Finvest" at 0:14. The Sisense logo appears only at the start and the end.
Copy it: If your product lives inside other products, set every screen in an example customer app and keep your own UI out.
Decision 2
End the chart on an action
At 0:10 the "Weekly sales" chart shows a weak Tuesday next to an "Increase ad spend" button, which becomes "Increase by 20%" at 0:12.
Copy it: Pair each chart in your script with the button a user would press after reading it.
Decision 3
Put readable code on screen
At 0:23 the editor holds legible React code importing from "@sisense/sdk-ui", not blurred placeholder lines.
Copy it: When your buyer writes code, show 1 real snippet they could paste, and keep it on screen long enough to read.
Decision 4
Answer framework fit with logos
From 0:18 to 0:21 TypeScript, Angular, Vue and React logos rise on discs, matching the description's "support for popular frameworks".
Copy it: List the stacks your buyer will ask about and show their logos in 1 shot instead of a slide of text.
From 2 example apps to a 50-second SDK video
- Example app design. 2D assets were designed for 2 example apps, the Pulse Athletics store and the Finvest finance tool, so the analytics could appear inside products that are not Sisense's.
- Bespoke illustration. The charts, world map, gauge, framework discs, task board and padlock were illustrated in one teal, lime and navy palette.
- UI element treatment. Labels, tooltips, buttons and the code editor were set so lines like "Weekly sales" and "Top 10 Categories by Revenue" read at video size.
- Motion graphics animation. Screens tilt into isometric space, charts build bar by bar, code types out and task cards move between columns.
- Visual effects integration. Circuit lines and glowing edges were added to link each scene to the next.
- Sound, color and final edit. Sound design, color grading and the final edit brought the cut to 50 seconds.
Scope of work:
Production took 3 to 4 weeks on a budget of $1,200 to $2,000. See the SaaS video production service for how a project like this is scoped.
Questions about the Sisense app preview video
Why does the Sisense video show a shoe store instead of the Sisense dashboard?
The Compose SDK puts analytics inside other companies' apps, so the video shows that end result. From 0:06 the charts appear on a "Pulse Athletics" product page, and Sisense's own interface never appears.
What does the "Increase by 20%" button show?
At 0:10 the "Weekly sales" chart on the product page shows a low Tuesday next to an "Increase ad spend" button. At 0:12 a tooltip reads "Revenue: $29,872.46" and the button becomes "Increase by 20%", so the chart leads straight to an action.
Is the code in the video real?
The code at 0:23 is readable React: it imports Chart from "@sisense/sdk-ui" and filterFactory and measureFactory from "@sisense/sdk-data", and labels a chart "Top 10 Categories by Revenue". It is there so a developer can see the syntax, not just a code-shaped blur.
Which frameworks does the video show?
TypeScript, Angular, Vue and React, as logos on discs from 0:18 to 0:21. The YouTube description backs this with "support for popular frameworks and prebuilt sample code".
How does a 50-second video cover security?
At 0:42 one chart card on the dashboard darkens under a padlock. It is a single shot that matches the description's "secure, in-app experiences", placed just before the logo.
What did the Sisense app preview video take to make?
The scope covered 2D asset design, bespoke illustration, motion graphics animation, UI element treatment, visual effects, sound design, color grading and the final edit. Production took 3 to 4 weeks on a budget of $1,200 to $2,000.
What Advids clients say
"Highly skilled and professional video production company. From the first interaction to final delivery, Advids team was prompt in communication and delivered high quality work on-time."Aashish Singhvi, CEO at DvSum


Need developers to see your SDK working inside their own app?
Talk to Advids